Changes in Physicochemical Parameters of Soil Along the Villages in Pendhurti Block of Visakhapatnam District, Andhra Pradesh
H. Shanthi Vardhan Dora1
 , Y.V. Singh1
, Prem Kumar Bharteey2
*
, A. M. Latare1
, Surajyoti Pradhan3
, Sumit Rai4
and H. Bhagyasri5
, Y.V. Singh1
, Prem Kumar Bharteey2
*
, A. M. Latare1
, Surajyoti Pradhan3
, Sumit Rai4
and H. Bhagyasri5
1
Department of Soil Science and Agricultural Chemistry,
Institute of Agricultural Sciences,
Banaras Hindu University,
Varanasi,
Uttar Pradesh
India
2
Department of Agricultural Chemistry and Soil Science,
C.C.R (P.G.) College,
Muzaffarnagar,
Uttar Pradesh
India
3
Department of Agronomy,
Krishi Vigyan Kendra (OUAT),
Mayurbhanj-2,
Orissa
India
4
Centre for Environment Assessment and Climate Change,
GB Pant National Institute of Himalayan Environment Kosi-Katarmal,
Almora,
Uttrakhand
India
5
Department of Botony,
Andhra University,
Visakhapatnam,
Andhra Pradesh
India
http://dx.doi.org/10.12944/CWE.18.3.23
Copy the following to cite this article:
Dora H. S. V, Singh Y. V, Bharteey P. K, Latare A. M, Bhagyasri H, Pradhan S, Rai S. Changes in Physicochemical Parameters of Soil Along the Villages in Pendhurti Block of Visakhapatnam District, Andhra Pradesh. Curr World Environ 2023;18(3). DOI:http://dx.doi.org/10.12944/CWE.18.3.23
Copy the following to cite this URL:
Dora H. S. V, Singh Y. V, Bharteey P. K, Latare A. M, Bhagyasri H, Pradhan S, Rai S. Changes in Physicochemical Parameters of Soil Along the Villages in Pendhurti Block of Visakhapatnam District, Andhra Pradesh. Curr World Environ 2023;18(3).
Download article (pdf) Citation Manager Publish History

Introduction
The assessment of soil quality often relies on the analysis of physicochemical properties, as highlighted by previous studies8, 19, 27. However, alternative indicators, including microbial biomass, soil respiration, activities of soil macro-fauna, and enzymes, have been identified as significant contributors to the quality of soil and health 5, 33.The combination of crops and vegetation, in conjunction with cultural practices, has the potential to alters the environment of soil through its influence on microclimatic conditions and the production of detritus 28, 6, 34. This alteration involves the redistribution of nutrients 16, facilitation of Nitrogen fixation 15 and significant influence on population of soil invertebrates 35. Furthermore, this interaction significantly contributes to the soil formation process 26. Enhancing soil structure, increasing infiltration rate, improving aeration, and augmenting water-holding capacity are some of the benefits it provides 25. Minerals, as well as organic matter, air and water are a part of the soil, making it a complex substance. The soil-structure, texture, and porosity of the soil are markedly influenced by these fractions. These characteristics consequently impact water and airflow within the layers of soil and consequently the functionality of the soil, a soil physicochemical characteristic hence significantly affects the quality of soil. The soil quality analysis also examines variables and processes that have an impact on how effectively soil functions as a part of a healthy ecosystem. Over the past fifty years, agricultural practices have witnessed a shift towards intensive production, marked by a heightened use of commercial seeds, pesticides, fertilizers, and similar inputs 4, 39. Global alterations in land use patterns have transpired due to the expansion and intensification of agriculture, coupled with various other developmental initiatives 13, 22. Land use modifications have had a notable impact on the fertility and resilience of ecosystems, as indicated by recent research 21. The detrimental impact of these methods extends to the well-being of the soil 32, conventional crops 36, 22. Therefore, there is a pressing need to formulate innovative approaches that leverage ecological interactions. Although there are significant nutrient reserves in the soil, the Food and Agriculture Organization reported in 2008 7 that their full utilization by crops may be hampered by the possibility that they are not present in a form that is available to plants. Essential nutrients are necessary for a plant's growth and entire life cycle. Crop yields can be drastically reduced if any of these components are lacking. A nutrient is regarded as essential if it directly affects plant metabolism and is necessary for the plant's life cycle. Therefore, it is crucial to perform an extensive soil investigation to identify which nutrients are lacking and the proper dosages to be supplied. The most prevalent plant nutrients C, H, and O, are universal elements that can be derived from air and water. Primary macronutrients, secondary macronutrients, and micronutrients are the three types of nutrients that plants absorb. The remainder, however, must either be supplied by fertilizers or exclusively taken up by plants as minerals from the soil. Most important primary macronutrients are N, P and K. In contrast to secondary macronutrients and micronutrients, plants receive considerable amounts of these main macronutrients through fertilizers. Secondary macronutrients including Ca, Mg, and S are needed in smaller amounts than basic macronutrients. These fertilizers with secondary macronutrients are also known as amendment nutrients since they are used to reclaim unbalanced acidic and alkaline soil conditions. In contrast to macronutrients, micronutrients are necessary in smaller quantities; nevertheless, they remain vital for the growth, development, and metabolic processes of plants. By supporting enzymes in many enzymatic reactions, these substances have a considerable impact. Their crucial contribution lies in fostering the holistic growth of plants and guaranteeing the smooth operation of vital elements. Evaluating soil quality necessitates a thorough examination of its physical, chemical, and biological attributes, as these elements collectively shape its overall state. The present research specifically concentrates on scrutinizing the soil physicochemical parameters in diverse villages within the Pendhurti Block of Visakhapatnam District.
Materials and Methods
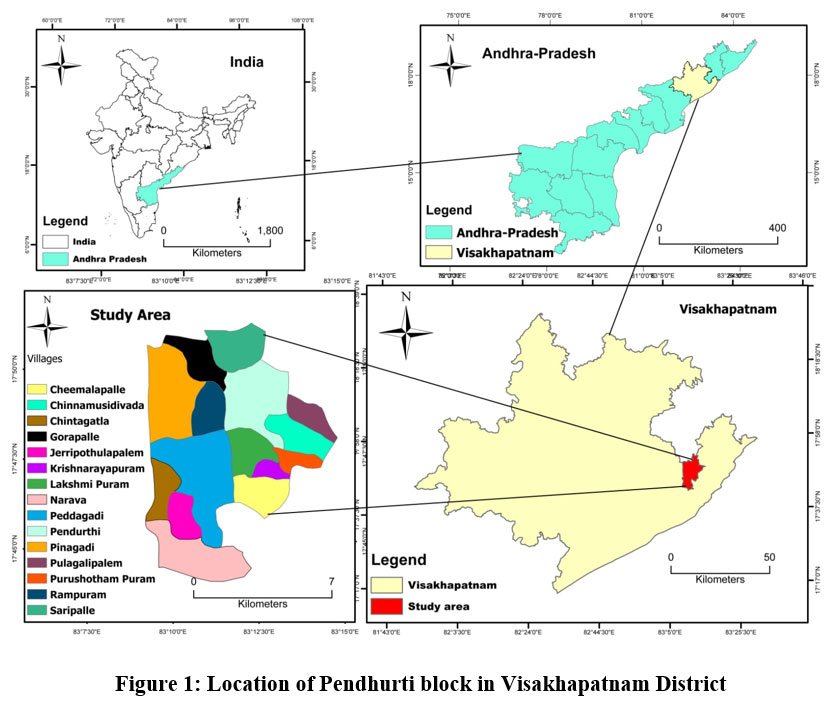
Study area: Pendhurti, situated in the Visakhapatnam district of Andhra Pradesh, is positioned at 17.8333°N latitude and 83.2000°E longitude. Located on the western outskirts of Visakhapatnam City, this locality encompasses a total of 15 villages. The predominant soil type in this area is red loamy soil, characterized by easy drainage and poor texture. Sandy loamy soils are found, especially in coastal regions, while black cotton soils make up a minimal proportion of the region. The majority of soils in this block exhibit low organic matter and nitrogen content. The primary crops cultivated include paddy and vegetables, with additional cultivation of sugarcane, sesame, and millets. Notably, vegetable crops like brinjal, tomato, okra, and chili thrive, along with fruit crops such as papaya and banana. Marigold is a prevalent flower crop, and in certain areas, trees like casuarinas are cultivated.
.jpg) | Figure 1: Location of Pendhurti block in Visakhapatnam District.
|
Analysis of physicochemical parameters
In Pendhurti Block, Visakhapatnam District, Andhra Pradesh, a collection of 30 soil samples was procured from fifteen distinct locations or villages, reaching 0 to15cm depths with utilization of spade. Before collecting the samples, the area underwent cleaning to remove twigs, litter, and stones. Using an iron spade, soil was excavated to a depth of 15cm in a V-shape to expose all soil horizons. Randomly, 4 to 5 samples were collected in a zigzag pattern from each field. The quartering technique was utilized by partitioning the samples into four equal sections, eliminating two diagonally opposite quadrants, and subsequently amalgamating and re-blending the remaining two quadrants. This process was repeated until a minimum sample weight of 500 g was obtained. The collected samples were then placed in zip-lock covers, appropriately labelled for identification. Next to this collected samples of soil were shade-dried in a room and manually crushed using a mortar and pestle, and sifted through a mesh with a 2mm sieve size. After sieving, approximately 200 to 300g of soil sample was obtained, which was then labeled and stored in a polythene cover or jute bag. Subsequently, the gathered soil samples underwent further analysis in the laboratory to assess major physicochemical soil parameters.The determination of bulk density and particle density was carried out through the utilization of a pycnometer, as outlined by 9. Porosity, in turn, was computed based on the values obtained from BD and PD. The estimation of WHC employed the keen box method, following the recommendations of 36. For pH assessment, the potentiometric method was applied, involving the creation of soil:water suspension in 1:2.5 ratio. Simultaneously, EC was gauged using an Electrical conductivity meter, following the methodology described by 20.The analysis of organic carbon was conducted using the Walkley and Black technique, as recommended by 43. The assessment of nitrogen availability was conducted using the alkaline KMnO4approach, as proposed by 41, utilizing a Kjeldahl semi-auto-analyzer.Olsen's method, implemented with a spectrophotometer instrument, was employed for the estimation of Available-P, as documented by 30. The assessment of Available K was conducted using a flame photometer and neutral normal (NH4OAc) as the extractant, following the methodology outlined by 17. Exchangeable Ca and Mg were determined through the Versenate titration method, as specified by 20. Available-S, on the other hand, was estimated using the turbidimetric method with a spectrophotometer, following the procedure described by 10.
Results and discussions
Table 1, 2 displays results pertaining to the physicochemical characteristics, macronutrients and micronutrients observed in soil specimens obtained from diverse villages within Pendhurti block, situated in the Visakhapatnam district.
Table 1: Status of physicochemical and primary macronutrient parameters of different villages of Pendhurti block of Visakhapatnam District in Andhra Pradesh.
| Sample No | Villages | B.D g cm3 | P.D gcm3 | Porosity % | WHC % | pH | EC dSm-1 | OC % | N Kgha-1 | P Kgha-1 | K Kgha-1 |
S1 | Pinagadi | 1.52 | 2.68 | 43.28 | 31.71 | 7.4 | 0.076 | 0.27 | 100.32 | 32.98 | 123.20 |
S2 | Pinagadi | 1.53 | 2.56 | 40.33 | 32.87 | 7.3 | 0.102 | 0.38 | 100.32 | 39.46 | 168.00 |
S3 | Pinagadi | 1.43 | 2.30 | 37.80 | 37.32 | 6.9 | 0.098 | 0.34 | 125.44 | 57.87 | 179.20 |
S4 | Gorapalle | 1.52 | 2.71 | 43.91 | 30.76 | 7.6 | 0.141 | 0.43 | 112.89 | 62.59 | 224.00 |
S5 | Saripalle | 1.56 | 2.38 | 34.48 | 29.90 | 7.2 | 0.096 | 0.23 | 137.98 | 25.03 | 190.40 |
S6 | Saripalle | 1.52 | 2.23 | 31.90 | 29.01 | 7.1 | 0.091 | 0.23 | 112.89 | 27.39 | 123.20 |
S7 | Pendurthi | 1.5 | 2.30 | 34.9 | 22.22 | 7.1 | 0.381 | 0.56 | 125.44 | 96.61 | 313.60 |
S8 | Pendurthi | 1.43 | 2.47 | 42.09 | 21.09 | 7.3 | 0.106 | 0.31 | 125.44 | 22.67 | 156.80 |
S9 | Pendurthi | 1.47 | 2.26 | 34.88 | 23.53 | 7.4 | 0.114 | 0.12 | 137.98 | 22.38 | 78.40 |
S10 | Pulagalipalem | 1.52 | 2.42 | 37.07 | 24.63 | 7.5 | 0.214 | 0.56 | 112.89 | 87.18 | 280.00 |
S11 | Chinnamusidivada | 1.48 | 2.21 | 33.10 | 26.92 | 7.6 | 0.172 | 0.46 | 75.26 | 38.87 | 280.00 |
S12 | Purushotham puram | 1.45 | 2.75 | 47.22 | 41.95 | 7.8 | 0.158 | 0.59 | 125.44 | 65.53 | 268.80 |
S13 | Krishnarayapuram | 1.5 | 2.25 | 33.25 | 39.72 | 7.6 | 0.146 | 0.28 | 87.8 | 30.63 | 100.80 |
S14 | Lakshamipuram | 1.51 | 2.73 | 44.69 | 30.64 | 7.8 | 0.177 | 0.5 | 125.44 | 95.72 | 190.40 |
S15 | Chinnalapalle | 1.56 | 2.34 | 33.39 | 32.80 | 7.7 | 0.194 | 0.33 | 112.89 | 80.7 | 257.60 |
S16 | Chinnalapalle | 1.55 | 2.11 | 26.69 | 32.96 | 7.6 | 0.191 | 0.28 | 100.35 | 70.83 | 134.40 |
S17 | Rampuram | 1.55 | 2.27 | 31.8 | 36.46 | 7.6 | 0.155 | 0.27 | 125.44 | 65.97 | 246.40 |
S18 | Peddagadi | 1.52 | 2.20 | 30.84 | 21.15 | 7.1 | 0.256 | 0.38 | 137.98 | 151.98 | 201.60 |
S19 | Peddagadi | 1.56 | 2.31 | 32.45 | 28.18 | 7.7 | 0.34 | 0.46 | 137.98 | 76.43 | 268.80 |
S20 | Peddagadi | 1.54 | 2.74 | 43.80 | 27.35 | 7.2 | 0.202 | 0.28 | 125.44 | 63.03 | 313.60 |
S21 | Peddagadi | 1.48 | 2.22 | 33.4 | 29.43 | 7.2 | 0.102 | 0.2 | 87.8 | 45.65 | 123.20 |
S22 | Narava | 1.42 | 2.37 | 40.08 | 31.13 | 8.2 | 0.198 | 0.36 | 125.44 | 43 | 134.40 |
S23 | Narava | 1.48 | 2.09 | 29.26 | 27.65 | 7.4 | 0.182 | 0.38 | 100.35 | 49.33 | 100.80 |
S24 | Narava | 1.46 | 2.34 | 37.51 | 24.30 | 7.5 | 0.167 | 0.23 | 112.89 | 67.74 | 112.00 |
S25 | Chinnamusidivada | 1.56 | 2.48 | 36.98 | 29.68 | 7.4 | 0.17 | 0.47 | 112.89 | 92.92 | 100.80 |
S26 | Chintagatla | 1.51 | 2.28 | 33.86 | 44.02 | 7.2 | 0.192 | 0.52 | 100.35 | 64.5 | 354.00 |
S27 | Peddagadi | 1.47 | 2.05 | 28.29 | 42.75 | 7.4 | 0.222 | 0.33 | 112.89 | 80.99 | 389.40 |
S28 | Narava | 1.57 | 2.64 | 40.53 | 43.21 | 6.9 | 0.135 | 0.28 | 94.08 | 48.15 | 268.80 |
S29 | Jerripothulapalem | 1.51 | 2.8 | 46.07 | 42.77 | 7.6 | 0.11 | 0.31 | 131.71 | 28.27 | 212.80 |
S30 | Jerripothulapalem | 1.33 | 2.46 | 45.93 | 42.58 | 8 | 0.306 | 0.57 | 125.44 | 51.98 | 288.60 |
Mean |
| 1.50 | 2.40 | 36.99 | 31.96 | 7.44 | 0.17 | 0.36 | 114.98 | 59.55 | 206.13 |
S.D |
| 0.05 | 0.21 | 5.73 | 7.07 | 0.30 | 0.07 | 0.12 | 16.58 | 28.58 | 84.53 |
CV (%) |
| 3.53 | 8.91 | 15.50 | 22.14 | 4.06 | 42.36 | 33.63 | 14.42 | 48.00 | 109.28 |
Range |
| 1.33-1.57 | 2.05-2.8 | 26.69-47.22 | 21.09-44.02 | 6.9-8.2 | 0.076-0.381 | 0.12-0.59 | 75.26-137.98 | 22.38-151.98 | 78.4-389.40 |
Table 2: Status of secondary and micronutrient parameters of different villages of Pendhurti block of Visakhapatnam District in Andhra Pradesh.
| Sample No | Villages | Ca2+ meq100g-1 | Mg2+ meq100g-1 | S meq100g-1 | Cu (mgkg-1) | Mn (mgkg-1) | Fe (mgkg-1) | Zn (mgkg-1) |
S1 | Pinagadi | 1.70 | 10.70 | 3.25 | 1.20 | 15.12 | 13.28 | 1.48 |
S2 | Pinagadi | 7.20 | 0.30 | 1.30 | 1.40 | 24.86 | 17.76 | 1.58 |
S3 | Pinagadi | 6.40 | 4.80 | 0.21 | 1.68 | 26.48 | 3.28 | 1.92 |
S4 | Gorapalle | 5.60 | 34.70 | 2.82 | 1.86 | 29.66 | 26.18 | 1.74 |
S5 | Saripalle | 6.70 | 0.60 | 8.24 | 0.96 | 27.16 | 10.20 | 1.00 |
S6 | Saripalle | 8.20 | 6.50 | 2.82 | 1.27 | 26.72 | 12.60 | 1.14 |
S7 | Pendurthi | 14.80 | 16.90 | 14.97 | 1.83 | 25.04 | 12.68 | 0.32 |
S8 | Pendurthi | 5.30 | 3.10 | 2.17 | 1.34 | 33.20 | 12.36 | 1.34 |
S9 | Pendurthi | 12.20 | 12.30 | 0.86 | 0.78 | 20.54 | 8.06 | 0.36 |
S10 | Pulagalipalem | 3.10 | 13.70 | 5.85 | 1.24 | 23.06 | 12.32 | 1.66 |
S11 | Chinnamusidivada | 23.60 | 5.40 | 9.54 | 5.36 | 0.32 | 12.30 | 0.30 |
S12 | Purushotham puram | 5.50 | 13.00 | 12.15 | 1.58 | 21.08 | 6.52 | 2.90 |
S13 | Krishnarayapuram | 5.00 | 15.30 | 7.37 | 2.04 | 30.78 | 9.68 | 0.34 |
S14 | Lakshamipuram | 4.80 | 5.10 | 13.23 | 0.98 | 21.88 | 8.62 | 0.34 |
S15 | Chinnalapalle | 9.50 | 21.10 | 18.66 | 1.38 | 18.32 | 11.62 | 2.34 |
S16 | Chinnalapalle | 5.80 | 4.40 | 11.50 | 0.94 | 16.40 | 7.16 | 2.54 |
S17 | Rampuram | 8.80 | 17.70 | 17.14 | 1.32 | 20.88 | 7.72 | 2.40 |
S18 | Peddagadi | 5.90 | 7.60 | 17.36 | 1.48 | 22.50 | 10.70 | 0.44 |
S19 | Peddagadi | 11.40 | 26.00 | 17.79 | 1.76 | 22.70 | 20.20 | 0.40 |
S20 | Peddagadi | 4.00 | 31.70 | 6.51 | 1.34 | 21.42 | 7.26 | 2.16 |
S21 | Peddagadi | 8.80 | 14.80 | 5.85 | 2.44 | 27.16 | 16.34 | 2.38 |
S22 | Narava | 16.30 | 37.90 | 7.16 | 1.64 | 16.84 | 12.76 | 1.24 |
S23 | Narava | 10.30 | 45.60 | 8.24 | 3.66 | 103.92 | 3.90 | 1.40 |
S24 | Narava | 10.80 | 22.20 | 4.12 | 2.42 | 32.08 | 20.54 | 0.26 |
S25 | Chinnamusidivada | 14.10 | 3.70 | 5.64 | 2.44 | 37.14 | 15.74 | 0.18 |
S26 | Chintagatla | 12.50 | 17.40 | 19.31 | 1.42 | 16.68 | 10.26 | 2.34 |
S27 | Peddagadi | 7.40 | 46.70 | 19.96 | 4.28 | 0.16 | 8.80 | 2.64 |
S28 | Narava | 4.80 | 3.60 | 13.23 | 1.20 | 0.04 | 19.74 | 2.12 |
S29 | Jerripothulapalem | 24.30 | 4.30 | 9.11 | 2.06 | 0.08 | 15.16 | 2.96 |
S30 | Jerripothulapalem | 20.90 | 3.80 | 15.19 | 2.24 | 1.02 | 13.70 | 0.02 |
Mean | 9.52 | 15.03 | 9.39 | 1.85 | 22.77 | 12.25 | 1.41 | |
S.D | 5.78 | 13.11 | 6.11 | 1.01 | 18.48 | 5.15 | 0.94 | |
CV (%) | 60.65 | 87.25 | 65.09 | 54.50 | 81.13 | 42.02 | 66.48 | |
Range | 1.7-24.3 | 0.3-46.7 | 0.21-19.96 | 0.78-5.36 | 0.04-103.92 | 3.28-26.18 | 0.02-2.96 |
Physico-chemical parameters
The soil samples under examination demonstrate pH levels ranges from 6.9 to 8.2, with a mean of 7.44. The findings suggest that a majority, specifically 56.6% of the samples, exhibit a slightly alkaline character, 36.6% register as neutral, and 6.6% demonstrate a moderately alkaline reaction. These findings align with those recorded by 40. The EC of samples ranges between 0.076 to 0.381 dSm-1 with a mean 0.17 dSm-1. The results lead to the conclusion that all of the samples fall within acceptable limits, making them suitable for cultivating various crops without posing any salinity risks. This aligns with the findings of 2 in Himachal Pradesh. Regarding organic-C content, the soil exhibits a variation from 0.12% to 0.59%, with an average concentration of 0.36%.As per the recommended thresholds outlined by 29, it is evident that 80% of the samples exhibit a low organic-C content. Corresponding results were noted by 38 in the Visakhapatnam district, where 20% of the samples are within the medium range of organic-C content. Concerning the BD of soil samples varied between 1.33 to 1.57 g cm-3 and particle densities varied between 2.05 to 2.8 g cm-3, respectively, yielding average of 1.50g cm-3and 2.40 g cm-3. Additionally, the porosity of the samples ranging from 26.68 to 47.22% and WHC ranged from 21.09 to 44.02%, with a mean value of 36.99 and 31.96%, respectively. Differences observed in the physical parameters of soil across diverse villages could be attributed to variances in land use patterns, topography, and weathering processes etc 7, 1. Similar outcomes were documented by 13 in South Sikkim. The distribution of physicochemical parameters is presented in Fig. No.2
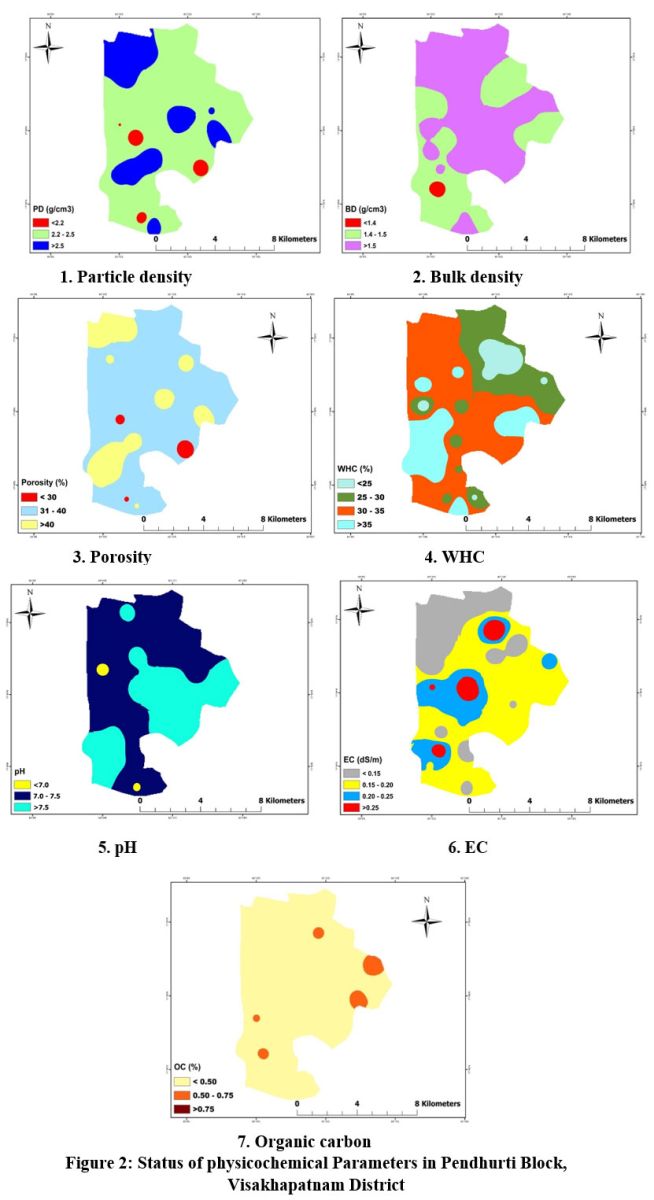 | Figure 2: Status of physicochemical Parameters in Pendhurti Block, Visakhapatnam District
|
Status of Primary Macronutrients
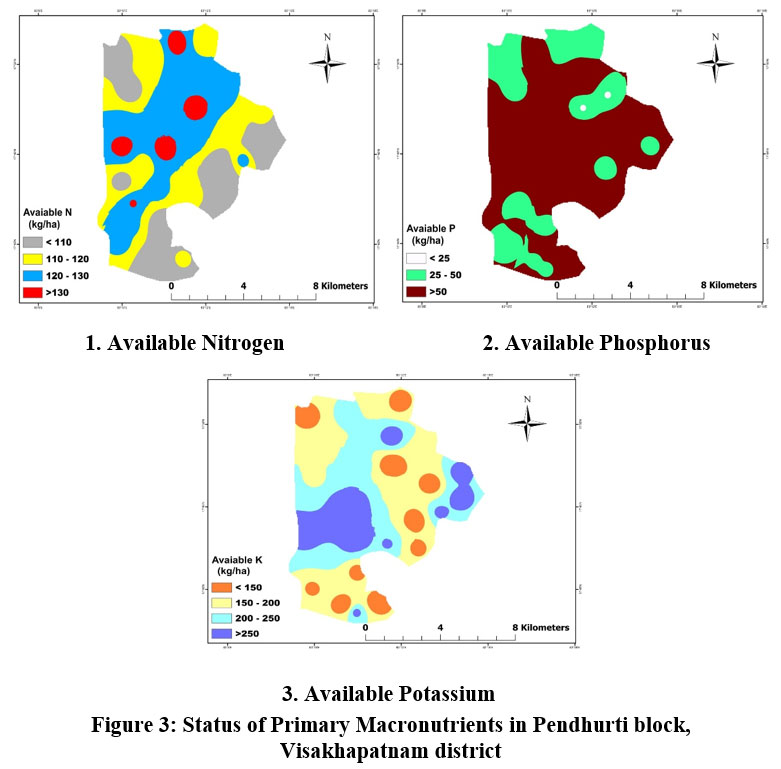
The concentration of N in the samples varies from 75.26 to 137.98 kg ha-1, with an average value of 114.98 kg ha-1 (Table 1). In accordance with the guidelines proposed by 29, it becomes apparent that all of the soil samples exhibit a deficiency in N content. This observation aligns with the results recorded by 11 in the Matiya village of Kasdol bock in the Balodabazar district, Chhattisgarh. The assessed P levels in the soil vary from 22.38 to 151.98 kg ha-1, average in at 59.55 kg ha-1. Referring to the criteria presented by 37, it becomes evident that 93.3% of the samples fall within the high P range. This phenomenon could be attributed to the neutral to slightly alkaline pH of the Pendhurti block soils, enhancing P availability. Furthermore, 6.6% of the samples are categorized within the medium P range. K content in the samples varies from 78.4 to 389.40 kg ha-1, with an average of 206.13 kg ha-1. Referring to criteria outlined by 37, it is evident that 60% of the samples fall within the medium K range, while 33.3% of the soil samples exhibit low K levels, and 6.6% fall into the high K range. Within dissected landscapes, bioclimatic conditions undergo swift alterations, leading to a notable diversity in soil types and their corresponding physicochemical characteristics over short distances 7, 42, 38 documented comparable results in the Visakhapatnam district. The distribution of primary macronutrient parameters is presented in Fig. No. 3
 | Figure 3: Status of Primary Macronutrients in Pendhurti block, Visakhapatnam district.
|
Status of Secondary Macronutrients
The soil samples exhibit exchangeable-Ca content ranging from 1.7 to 24.3 meq 100 g-1, with an average value of 9.52 meq 100 g-1 (Table 2). According to the criteria proposed by 37, it becomes evident that all of the samples fall within the high range of Ca content. The soil samples display exchangeable Mg content varying from 0.3 to 46.7 meq 100g-1, averaging at 15.03 meq 100 g-1. According to the criteria established by 37, all samples fall within the high range of Mg content, as indicated by the specified limits. Available-S content in soil samples ranges between0.21 to 19.96 mg kg-1with a mean of 9.39 mg kg-1. In accordance with the thresholds suggested by 23, it is disclosed that 60% of the soil samples exhibit a low range of S content and 40% of samples are in the medium range of S concentration. Comparable results were noted by 18 at NAI, SHUATS, Prayagraj. The distribution of secondary macronutrient parameters is presented in Fig. No. 4
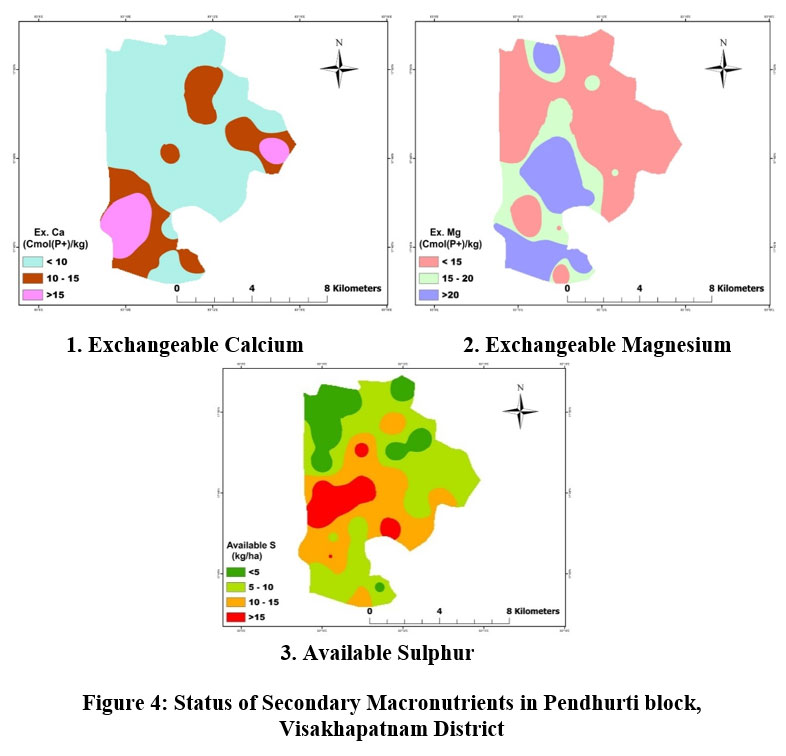 | Figure 4: Status of Secondary Macronutrients in Pendhurti block, Visakhapatnam District.
|
Status of micronutrients
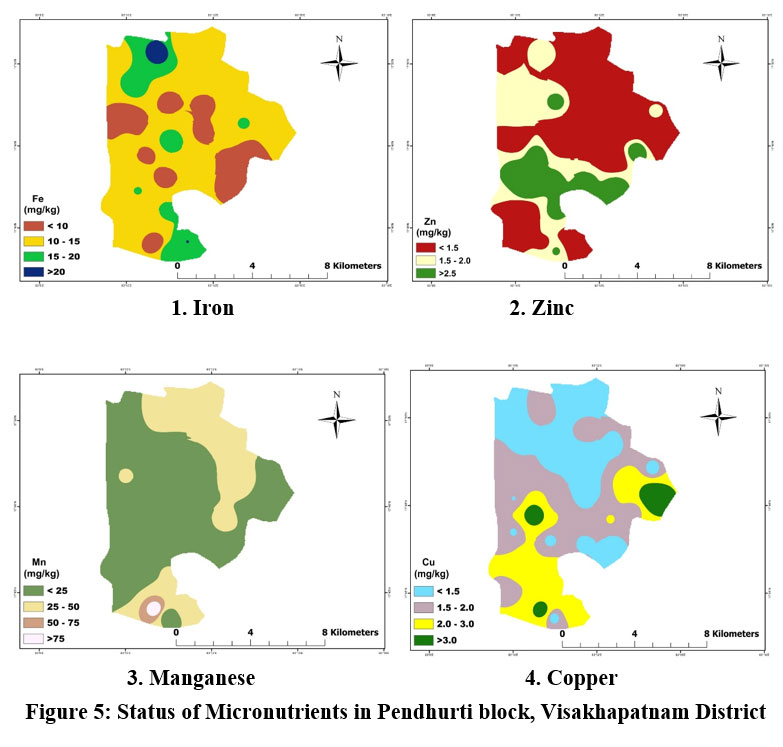
The soil samples display a range of Fe content, varying from 3.28 to 26.18 mg kg-1 soil, with an average of 12.25 mg kg-1 soil (Table 2). Following the critical limits recommended by 24, it can be observed that 70% of these soil samples exhibit a high Fe content, 23.3% register as having a sufficient Fe level, and 6.6% are deficient in Fe content. Mn content in the samples ranging from 0.04 to 103.92 mg kg-1 soils, with an average value of 22.77 mg kg-1 soil. In accordance with the defined thresholds established by 24, 83.3% of these samples fall into the high range for Mn content, while 16.6% are deficient. Regarding Zn content in soil ranges between 0.02 to 2.96 mg kg-1 soils, with an average of 1.41 mg kg-1 soil. 60% of the samples are within range of high Zn content, while 33.3% are deficient in Zn. In terms of Cu content, the soil samples are found with a range of 0.78 to 5.36 mg kg-1 soil, with an average of 1.85mg kg-1 soil. Following critical limits proposed by 24, it reveals that all analyzed soil samples exhibit a high Cu content. Interestingly, despite the general principle that micronutrient availability decreases with an increase in pH, this analysis reveals a neutral to slightly alkaline pH range, with micronutrient levels ranging from sufficient to high. This may be attributed to the application of fertilizers containing these micronutrients. Similar results were corroborated by 3 in their assessment of micronutrient status in the Pendhurti Block of the Visakhapatnam District in Andhra Pradesh. The distribution of micronutrient parameters is presented in Fig. No. 5
 | Figure 5: Status of Micronutrients in Pendhurti block, Visakhapatnam District.
|
Soil nutrient index
To obtain a meaningful comparison of soil fertility between different locations, it was essential to have a single numerical representation for each nutrient. As indicated by 40, the Nutrient Index (NI) serves as an evaluation of the soil's capacity to provide nutrients to plants. Table 3 provides the calculated values for the N, P, K & S Indices. The calculation of the NI is carried out utilizing the formula established by 29.
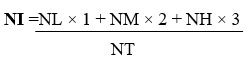
Where, N.L: denotes no of samples comes under category of low nutrient level
N.M: denotes no of samples comes under category of medium nutrient level
N.H: denotes no of samples comes under category of high nutrient level
N.T: denotes total no of samples.
A nutrient indicator below 1.5 was categorized as low, while a range of 1.5 to 2.5 was considered moderate, and values exceeding 2.5 were deemed high in terms of fertility degree, following the recommendations of 37.
Table 3: Nutrient index status of different villages in Pendhurti Block in Visakhapatnam District of Andhra Pradesh.
Sl. No | Available Nutrients | Nutrient index | Category |
1 | N | 1 | Low |
2 | P | 2.93 | High |
3 | K | 1.76 | Medium |
4 | S | 1.4 | Low |
5 | OC | 1.2 | Low |
Correlation among various physicochemical parameters in soil
This data illustrate the degree of association and significance among various physicochemical soil parameters, both in relation to one another and within the context of evaluating soil quality. The correlation among physicochemical properties in soil is given in the Table 4. The BD of the soil shows a negative correlation, although not statistically significant, with porosity (correlation coefficient, r = -0.307), WHC (-0.106), pH (-0.328), EC (-0.101), OC (-0.2), N (-0.099), Ca (-0.346), Mg (-0.077), and Cu (-0.276). However, there exists a correlation of negatively significant between BD and K (-0.536). Furthermore, BD displays a positive, though not statistically significant, correlation with PD (r = 0.083) and with P, S, Mn, Fe and Zn (0.211, 0.155, 0.035, 0.175, 0.194). The PD of soil exhibits a non-significant positive correlation with regarding to WHC (0.190), pH (0.144), OC (0.209), N (0.201) and K, Fe, Zn (0.078, 0.319, and 0.163). PD is significantly positive in correlation with porosity (0.920). However, it is negatively correlated, albeit not significantly, with EC, P, Ca, S and Mn (0.228, 0.120, 0.106, 0.240, 0.226, 0.246) and is significantly negatively correlated with Cu (-0.370). Porosity in soil has a negative but not significant correlation with regarding to EC (-0.178), P (-0.206), Mg (-0.224), S (-0.294), Cu and Mn (-0.267, -0.252). Porosity is positively, but not significant in correlation with WHC (0.2), pH (0.252), OC ( 0.276), N (0.232), K (0.285), Ca (0.039), Fe and Zn (0.262, 0.046). WHC of soil is in negative correlation, but not significantly with EC (0.129), N (-0.193), P (-0.194), Mg (-0.02), and Fe (-0.088). However, WHC has a negative correlation significantly with Mn (-0.391). WHC is positively, but significantly correlated with K (0.363), Zn (0.506), and positive correlation but not significant with pH (0.154), OC (0.133), Ca (0.118), S (0.353), and Cu (0.059). Soil pH shows a negative correlation but statistically non-significant with P (-0.028), Mn and Zn (-0.128, -0.112). However, pH is correlated positively but not significant with EC (0.246), OC (0.313), N (0.106), K, Ca, Mg, S, Cu, and Fe (0.307, 0.349, 0.240, 0.198, 0.110, 0.064). EC in soil has a negative correlation but not significant with Mn (-0.069), Zn (-0.331). EC is in positive correlation but not significant with regarding to N (0.261), Ca (0.280), Mg (0.3), Cu and Fe (0.161 and 0.043). However, it has a positive correlation, significantly with regarding to OC (0.597), P (0.620), K (0.469), and S (0.645). OC in soil exhibits a negative correlation but not significantly with Mn and Zn (-0.038, -0.146). OC is positively correlated but not significant with N (0.046), Ca (0.216), Mg (0.005), Cu and Fe (0.173 and 0.038) and has positive correlation significantly with P (0.470), K (0.444), and S (0.383). N in soil has a negative correlation but not significant with Mg (-0.004), Mn (r -0.048), Fe (-0.133), and Zn (-0.123). However, N is in negative correlation but significant with Cu (-0.458) and has positive correlation but not significant with P (0.238), K, Ca and S (0.134, 0.022, 0.109). P in soil has a negative correlation but statistically not significant with Ca (-0.153), Cu (-0.008), Fe (-0.032) and Zn (-0.118). P is non significantly, positive in correlation with K (0.061), Mg (0.135) and Mn (0.003). P is in positive correlation and significant with S (0.541). K in soil is negatively correlated but statistically not significant with Mg (-0.081), Mn and Fe (-0.347 and -0.158). However, K is in positive correlation and significant with Ca (0.370), S (0.367) and is in positive correlation but not significant with Cu and Fe (0.125 and 0.046). Ca in soil is in negative correlation but statistically not significant with Mg, Mn and Zn (-0.049, -0.225 and -0.232). Ca is non significantly positive in correlation with S and Fe (0.174 and0.136) and is in positive correlation, but statistically significant with Cu (0.483). Mg in soil is in negative correlation but not significant with Fe (-0.028) and positively but not significantly correlated with S, Cu, Mn and Zn (0.204, 0.359, 0.341 and 0.180). S in soil is in negative correlation but statistically not significant with Mn and Fe (-0.283 and -0.124) and in positive correlation but not significant with Cu and Zn (0.137 and 0.136). Cu in soil is in negative correlation but statistically not significant with Zn (-0.111) and in positive correlation but not significant with Mn and Fe (0.077 and 0.009). Mn in soil has negative correlation but statistically not significant with Fe and Zn (-0.218 and -0.154). Fe in the soil is in negative correlation but not significant with Zn (-0.182).
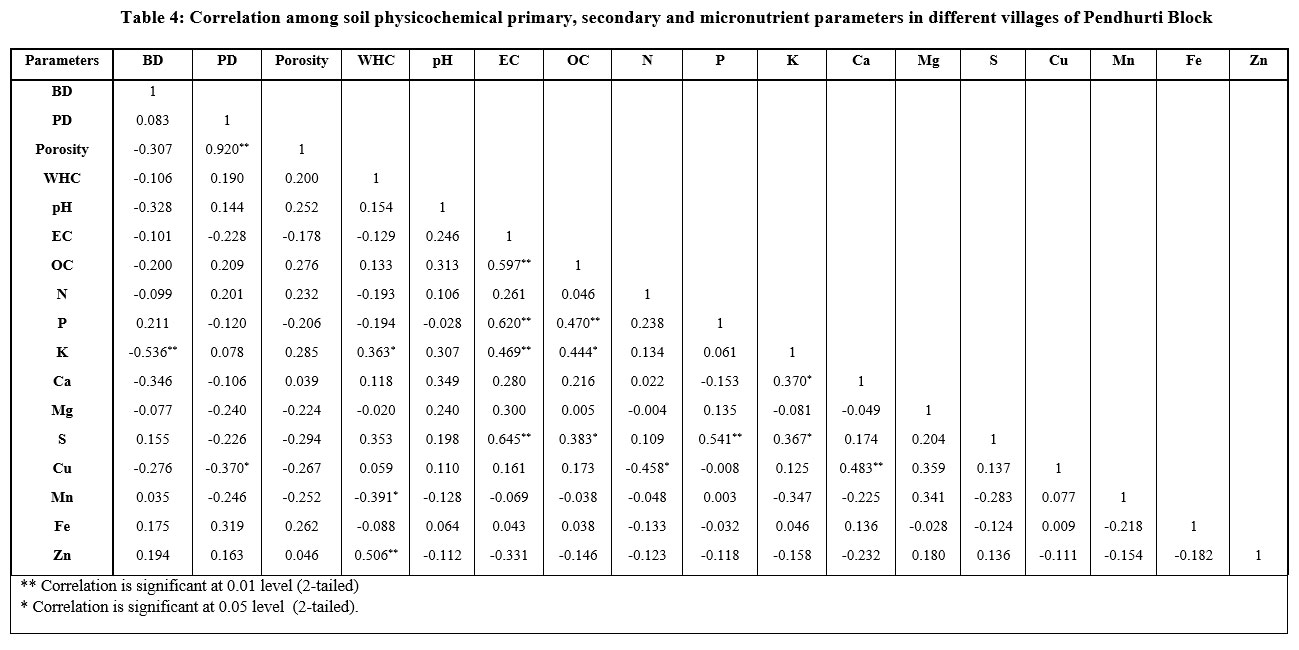 | Table 4: Correlation among soil physicochemical primary, secondary and micronutrient parameters in different villages of Pendhurti Block
|
Conclusion
The findings derived from soil analysis were interpreted using relevant literature, presenting insights into the necessary nutrients for effective supplementation. This information proves valuable for farmers in addressing nutrient deficiencies, ultimately contributing to enhanced crop yields. The analysis of Pendhurti block soils reveals a neutral to slightly alkaline pH, indicating no salinity hazards in terms of EC. The Organic-C content varies from low to medium, attributed to temperature fluctuations, monocropping, and improper land use or management practices, leading to rapid organic matter decomposition in the soil. Low N levels are may be attributed due to low Organic-C content in soil. High to moderate P content in the soil may be attributed to the soil's pH range, which is neutral to slightly alkaline, influencing the availability of phosphorus in the soil. K content ranges from medium to low, suggesting a moderate K content in Pendhurti block soils. The nutrient index highlights that Pendhurti block soils are deficient in organic-C, N and S while exhibiting high P and medium K levels. This analysis emphasizes the necessity for improved soil quality through practices such as Integrated Nutrient Management, following balanced fertilizer doses and crop rotations, steering away from sole cropping.
Acknowledgements
The authors are highly grateful to the Head of the Department of Soil Science and Agricultural Chemistry, Institute of Agricultural Sciences, Banaras Hindu University Varanasi for providing the necessary facility to carry out this work.
Conflict of Interest
The authors declare no conflict of interest.
Funding sources
There is no funding or financial support for the above research work.
References
- Awasthi P. K., Bargali S. S., Bargaliand K. & Khatri b. Nutrient return through decomposing Coriaria nepalensis litter in degraded hills of Kumaun Himalaya, India. Frontiers in Forests and Global Change DOI 10.3389/ffgc.2022.1008939
- Annepu S. K., Shirur M. & Sharma, V. P. Assessment of soil fertility status of mid Himalayan region, Himachal Pradesh. I. J. of Ecol. 2017; 44(2): 226-231.
- Bano S. & Dadhich A. S. Evaluation of Micronutrient Status with Physico-Chemical Properties of Some Agricultural Soils of Selected Areas of Pendurthi Mandal, Visakhapatnam District, Andhra Pradesh. R. J. of Chem. 2022; 15(2): 1557-1562.
- Bargali S. S., Shahi C., Bargali K., Negi B. & Khatri K. Energy and monetary efficiencies at the different altitudinal agroecosystems in Central Himalaya, India ?Heliyon. 2022; 8: e11500. https://doi.org/10.1016/j.heliyon.2022.e11500
- Bargali S. S., Padalia K. & Bargali K. Effects of tree fostering on soil health and microbial biomass under different land use systems in central Himalaya. Land Degrad. Develop.. 2019; 30(16): 1984-1998. DOI: 10.1002/ldr.3394.
- Bargali K., Manral V., Padalia V., Bargali S. S. & Upadhyay V. P. Effect of vegetation type and season on microbial biomass carbon in Central Himalayan forest soils, India. Catena. 2018; 171(12): 125-135. https://doi.org/10.1016/j.catena.1018.07.001
- Baumler R., Miehe, Pendry. & C. A. An Introduction to the Natural History, Ecology and Human Environment in the Himalayas - A Companion to the Flora of Nepal, Edition: 1st. Publisher: The Royal Botanical Garden Edinburgh. 2015; 125–134.
- Bargali S. S., Singh P. R. & Joshi Mukesh. Changes in soil characteristics in eucalypt plantations replacing natural broad leaved forests. J. Veg. Sci. 1993; 4: 25-28.
- Black C. A. Methods of soil analyses. Black CA ed. Madison Wisconsin, USA 1-2. 1965; 1572.
- Chesnin L. & Yien C. H. Turbidimetric determination of available sulphur. Proc. Soil Sci. 1950.
- Dameshwar M. & Navaz, M. Evaluation of soil fertility status of Matiya village of Kasdol block under Balodabazar district of Chhattisgarh. Inter. J. Chem. stud. 2018; 6(2): 38-41.
- Deb P., Debnath P. & Pattanaaik S. K. Physico-chemical properties and water holding capacity of cultivated soils along altitudinal gradient in South Sikkim, India. Ind. J. of Agric. Res. 2014; 48(2): 120-126.
- Davidar P., S. Sahoo P. C. Mammen P. Acharya J. P. Puyravaud M. Arjunan J. P. Garrigues K. & Roes Singh. Assessing the extent and causes of forest degradation in India: Where do we stand? Biol. Conserv. 2010; 143: 2937–2944.
- FAO. Conference, Thirty-fifth (Special) Session: Admission to the Session of Representatives and Observers of International Organizations (C 2008/6) (Rome: Food and Agriculture Organization of the United Nations). 2008.
- Gonzalez?Quinones V., Stockdale E. A., Banning N. C., Hoyle F. C., Sawada Y., Wherrett, A. D. & Murphy D. V. Soil microbial biomass—Interpretation and consideration for soil monitoring. Soil Res. 2011; 49: 287–304. https://doi.org/10.1071/SR10203
- Hadgu K. M., Kooistra L., Rossing W. A. H. & Van Bruggen A. H. C. Assessing the effect of Faidherbia albida based land use systems on barley yield at field and regional scale in the highlands of Tigray, Northern Ethiopia. Food Sec. 2009; 1: 337–350. https://doi.org/10.1007/s12571?009?0030?2
- Hanway J. & Heidel H. Soil analysis methods as used in Iowa State College Soil Testing Laboratory. Iowa State College Agri. Bull., 1952; 57: 1- 13.
- Jat R. K. & David A. A., Thomas T., Naga I. R. Assessment of Physico-chemical Properties of Soil from Different Departments of NAI, SHUATS, Prayagraj, UP, India. Inter. J. P. & Soil Sci. 2023; 35(15): 311-316.
- Joshi M, Bargali, K. & Bargali S. S. Changes in physico- chemical properties and metabolic activity of soil in popular plantations replacing natural broad leaved forests. J. Arid Environ.1997; 35: 161-169.
- Jackson M. L. Soil chemical analysis, pentice hall of India Pvt. Ltd., New Delhi, India. 1973; 498: 151-154.
- Karki H. K., Bargali S. S. & Bargali. Dynamics of fine root and soil nitrogen in Mangifera indica based agroforestry systems in Central Himalaya, India. Land Degrad. & Develop. 2022; 33(17): 3523-3538. https://doi.org/10.1002/ldr.4406
- Karki H., Kiran Bargali,. S. S. & Bargali. Spatial and Temporal Trends in Soil N-Mineralization Rates under the Agroforestry Systems in Bhabhar belt of Kumaun Himalaya, India. Agro. Syst. 2021; 95: 1603-1617. https://doi.org/10.1007/s10457-021-00669-9
- Kanwar J. S., Soil Fertility: Theory and Practice. SS Grewal, Under Secretary, for the ICAR, New Delhi. 1976.
- Lindsay W. L. & Norvell W. Development of a DTPA soil test for zinc, iron, manganese, and copper. Soil Sci. Soc. of Am. J. 1978; 42(3): 421-428.
- Manral V., Bargali K., Bargali S. S., Karki H. & Chaturvedi K. R. Seasonal Dynamics of Soil Microbial Biomass C, N and P along an Altitudinal Gradient in Central Himalaya, India. Sustainability. 2023;15: 1651. https://doi.org/10.3390/su15021651
- Manral V., Bargali K., Bargali S. S., Jhariya K. M. & Padalia K. Relationships between soil and microbial biomass properties and annual flux of nutrients in Central Himalayan forests, India. Land Degrad. & Develop. 2022; 33 (12): 2014-2025. https://doi.org/10.1002/ldr.4283
- Manral V., Bargali K., Bargali S. S. & Shahi C. Changes in soil biochemical properties following replacement of Banj oak forest with Chir pine in Central Himalaya, India. Ecol. Proc. 2020; 9:30 https://doi.org/10.1186/s13717-020-00235-8
- Montagnini F., Ramstad K. & Sancho F. Litterfall, litter decomposition and the use of mulch of four indigenous tree species in the Atlantic lowlands of Costa Rica. Agroforestry Systems. 1993; 23: 39–61.
- Muhr G. R., Datta N. P., Shankara Subraney N., Dever F., Lecy V. K. & Donahue R. R. Soil Testing in India. USAID Mission to India. 1963.
- Olsen, S. R. Estimation of available phosphorus in soils by extraction with sodium bicarbonate (No. 939). US Department of Agriculture. 1954.
- Pandey R, Bargali S. S., Bargali K. & Pandey C. V. Temporal variability in fine root dynamics in relation to tree girth size in sub-tropical Shorea robusta forests. Land Degrad. & Develop. 2023; 34(5): 1522-1537. https://doi.org/10.1002/ldr.4550
- Padalia K., Bargali S. S., Bargali K. & Manral. V. Soil microbial biomass phosphorus under different land use systems. Tropical Ecol. 2022; 63:30-48 https://doi.org/10.1007/s42965-021-00184-z
- Padalia K., Bargali S. S., Bargali, K. & Khulbe. K. Microbial biomass carbon and nitrogen in relation to cropping systems in Central Himalaya, India. Curr. Sci. 2018; 115 (9): 1741-1750
- Pant M., Negi G. C. S. & Kumar, P. Macrofauna contributes to organic matter decomposition and soil quality in Himalayan agroecosystems, India. Appl. Soil Ecol. 2017; 120: 20–29. https://doi.org/10.1016/j.apsoil.2017.07.019
- Padalia Kirtika., Kiran Bargali. & Bargali S. S. Present scenario of agriculture and its allied occupation in a typical hill village of Central Himalaya, India. Indian J. of Agric. Sci. 2017; 87 (1): 132-141.
- Piper C. S. Soil and plant analysis, Hans. Publishers. Bombay. Asian Ed. 1966; 368-74.
- Ramamoorthy, B. & Bajaj, J. C. Available nitrogen, phosphorus and potassium status of Indian soils. Fertiliser news. 1969.
- Sahu R. K., Thomas T., Singh, A. K. & Naga, I. R. Assessment of Physico-chemical Properties of Soil from Different Blocks of Visakhapatnam District, Andhra Pradesh. Inter. J. Plant & Soil Sci. 2023; 35(15): 322–335.
- Shahi C, Bargali S. S., Bargali K. & Vibhuti. Dry matter dynamics and CO2 mitigation in the herb layer of Central Himalayan agroecosystems along an altitudinal gradient, India. Trop. Eco. 2023; 64 (1): 180–192. https://doi.org/10.1007/s42965-022-00258-6
- Singh Y. V., Singh S. K., Sahi S. K., Verma S. K., Yadav R. N. & Singh, P. K. Evaluation of soil fertility status from Milkipur village, Arajiline block, Varanasi, district, Uttar Pradesh, in relation to soil characteristics. Journal of Pure and Applied Microbiology. 2016; 10(2): 1455-1461.
- Subbiah B. V. & Asija, G. L. A rapid procedure for the determination of available nitrogen in soils. Curr. Sci.1956;25: 259–60.
- Vibhuti Kiran Bargali. & Bargali S. S. Effect of size and altitude on soil organic carbon stock in homegarden agroforestry system in Central Himalaya, India. Acta Eco. Sinica. 2020;40(6): 483-491. doi.org/10.1016/j.chnaes.2020.10.002
- Walkley A. & Black, I. A. An examination of the Degtjareff method for determining soil organic matter, and a proposed modification of the chromic acid titration method. Soil Sci. 1934; 37(1): 29-38.


