Biogas Plants in Chhattisgarh (India): A Case Study
Kumar Shailendra 1 * , B. P. Mishra 2 , M. S. Khardiwar 1 , S. K. Patel 1 , B.K. Yaduvanshi 1 and B. P. Solanki1
1
Anand Agricultural University,
Dahod,
389151
Gujarat
India
2
Department of Farm Machinery and Power,
IGKV,
Raipur,
Chhattisgarh
India
http://dx.doi.org/10.12944/CWE.11.2.31
This study focused on evaluating the performance of biogas plants among the different district of Chhattisgarh State. Data from an existing biogas plants, located in Chhattisgarh state, was used for the performance evaluation of randomly selected biogas plants. Overall district wise biogas generation efficiency of Chhattisgarh plain was found to be 75.73 % and the efficiency was found maximum in district Mahasamund (83.50 %) and Durg (80.81 %) whereas minimum in district Raigarh (71.7 %). Average consumption or say use of biogas burner in the Chhattisgarh plains was found to be 3.75 h / day. However, the burner use-time varied with owner to owner from 2.70 h to 6.04 h /day. The district wise overall plant efficiency of Chhattisgarh plains was found 64.72 %, which varied district to district from 46-82 %. Overall performance was found maximum of 2 m3 plant (73.44 %) followed by 3 m3 (64.85 %). Minimum overall performance was found 8 m3 size (40.87 %) followed by 4m3 (44.62 %) size of plant. The overall plant efficiency reduced with increasing the plant size.
Copy the following to cite this article:
Shailendra K, Mishra B. P, Khardiwar M. S , Patel S. K, Yaduvanshi B. K, Solanki B. P. Biogas Plants in Chhattisgarh (India): A Case Study. Curr World Environ 2016;11(2) DOI:http://dx.doi.org/10.12944/CWE.11.2.31
Copy the following to cite this URL:
Shailendra K, Mishra B. P, Khardiwar M. S , Patel S. K, Yaduvanshi B. K, Solanki B. P. Biogas Plants in Chhattisgarh (India): A Case Study. Curr World Environ 2016;11(2). Available from: http://www.cwejournal.org/?p=14149
Download article (pdf) Citation Manager Publish History
Introduction
Biogas is a well established, sustainable source and widely-popular source of energy globally by virtue of its production from waste, and available cattle dung. The biogas substitutes both fuel and fertilizer, the plant gives gas and at the same time enhances the fertilizer value of dung. It is estimated that out of the total dung available, 69 % is used as manure, 29 % as cakes for fuel and remaining 2 % is used for other purposes (Nesmith, 1991).
In general, by using biogas, India can produce power of about 17000MW. It is estimated that this power is over 10% of the total electricity in India (Chauhan, 2009, Ranga Nathan, 2010). Heat obtained from biogas is more efficient than the combustion. In Chhattisgarh, use of biogas is limited to only cooking purpose. If the Plant does not perform satisfactory, it should be treated as national loss (Kumar et.al, 2014). The total numbers of biogas plants installed by CREDA in the Chhattisgarh state were found to be 30,376 till year 2010. And on an average more than three thousand (3375) plants are added annually. In present scenario the total gas and slurry availability in each districts of Chhattisgarh is a little varied in accordance to the capacity of plants installed (Kumar et.al, 2013). Animal excreta and other agricultural wastes are used to produce biogas through anaerobic digestion. The existing as well as future energy requirements of the rural areas can be achieved through this energy. Biogas is supplying 13 per cent of the total energy in the world, equivalent to 25 million barrels of primary energy (Mittal, 1997). Cattle dung is the main raw material used for biogas production. India has the largest population of livestock of over 300 million which produce about 980 million tones of dung. The entire quantity of available cattle dung is used for biogas genration, it could generate about 195 billion kW-h of energy annually (Govil and Gaur, 2000). Dung energy not yet fully explored, still its contribution is limited to 1.2 % where as the contribution of other energy sources are more ie. coal (32.5 %), oil ( 38.5%) and gasses (19 %) ( Rai., 1997). These latter energy sources are exhausting rapidly and therefore, there is need to search for an alternative cheep source of energy, which could fulfill the requirement of energy in rural areas as well as urban areas. At present energy generating system in India depends mostly on local sources of wood, straw and dung for burning. However, the lack of cheap and adequate energy often hampers rural development and retards improvement in the quality of village life.
Material and Methods
A survey was conducted randomly in each district of Chhattisgarh plains. It was conducted by visiting the biogas plant and collecting feedback from the operator / owners. The major objectives of biogas plants are to achieve higher gas generation efficiency, uniformity in application and maintaining the input raw materials to increase the performance of plants. As aiming collection of performance data to establish the viability, feasibility of selected biogas plants and cost of fabrication, maintenance are also collected for further improvement in the design and comparison with the ferro-cement gas holder. For collecting the important data required for technical knowledge, dung fed % to required dung, plant efficiency, repair and maintenance for each and every randomly selected plant, collection of relevant data detailed as under is a prerequisite should be taken following points into consideration.
- Technical knowledge
- Climatologically data for temperature
- Collection of data for gap between dung required and dung fed, status of biogas plant in Chhattisgarh plain, gap between feeding practices and prevailing practice, techno-economics of plant and performance of biogas plants
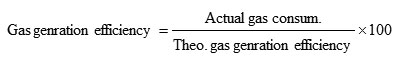
Performance of biogas plant is given in Table 1. The theoretical gas generation was worked out 0.04 m3 gas per kg fresh dung per day (Rai, 1997). Burner diameter, dung fed in kg and gas consumption time are noted at the site of plants.
Therefore, theoretical gas produced was calculated by multiplying dung fed with 0.04. Therefore, plant use or presently working efficiency was calculated as below.
Capacity Wise Performance of Biogas Plant
By survey in Chhattisgarh Plains, the size of plants was found 1- 6 m3/day. As per standard practice, the required dung for different size of plants is given as below
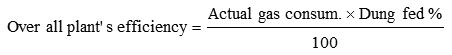
The capacity wise performance of biogas plants is calculated as given below:
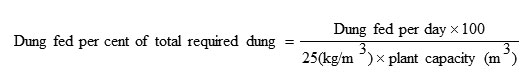
Capacity wise Dung Feeding
Capacity wise dung feeding was calculated by weighing dung at the site of plant and by personal interview of owners. And it is given in table below.
Table 1: Capacity wise dung requirement and dung feeding percentage
|
S.N. |
Plant's capacity, m3 |
Required dung per day |
Dung fed, % |
|
1 |
1 |
25 |
NA |
|
2 |
2 |
50 |
95.87 |
|
3 |
3 |
75 |
83.95 |
|
4 |
4 |
100 |
62.77 |
|
5 |
6 |
150 |
61.44 |
|
6 |
8 |
200 |
47.50 |
Result and Discussions
Data on dung fed per day, burner size and gas use time were determined from the owners. The overall plant working efficiency of individual plant was calculated. The performance of biogas plant was observed in terms of gas generation efficiency, dung fed percentage and gas use time and for evaluation of the plant performance the overall plant efficiency was calculated and presented under following heads:
Gas Generation Efficiency
It is revealed by Table 2 that the average gas generation efficiency in the biogas plants was found maximum in the district Mahasamund (83.5 %) followed by Durg (80.81 %) and minimum plant gas generation efficiency was found in district Rajnandgaon (71.6 %) followed by Raigarh (73.10 %). On an average the overall gas generation efficiency of biogas plants in the Chhattisgarh plain was found to be 75.73 %. However, the mean plant gas generation efficiency did not differ significantly. It was observed that the gas generation efficiency is highly dependent on feeding and maintenance practices followed by owners.
Table 2: District-wise performances of biogas plants in CG plain
|
S.N. |
District |
Gas generation efficiency, (%) |
Dung Fed, (%) |
Gas use, time, h |
Overall plant efficiency, % |
|
1 |
Raipur |
76.11 |
78.77 |
4.35 |
59.95 |
|
2 |
Mahasamund |
83.50 |
98.60 |
4.30 |
82.30 |
|
3 |
Dhamtari |
72.00 |
101.66 |
3.03 |
73.20 |
|
4 |
Durg |
80.81 |
56.29 |
6.04 |
45.49 |
|
5 |
Rajnandgaon |
71.60 |
94.94 |
3.60 |
67.97 |
|
6 |
Kawrdha |
76.70 |
87.90 |
3.17 |
67.41 |
|
7 |
Bilaspur |
72.23 |
81.00 |
2.70 |
58.50 |
|
8 |
Korba |
75.20 |
88.00 |
3.90 |
66.18 |
|
9 |
Raigarh |
71.73 |
73.10 |
3.17 |
52.43 |
|
10 |
JanjgirChampa |
78.00 |
85.00 |
3.90 |
66.30 |
|
11 |
Kanker |
75.20 |
96.00 |
3.10 |
72.20 |
|
Average |
75.93 |
85.51 |
3.75 |
64.78 |
|
|
SD |
4.23 |
13.25 |
0.93 |
10.07 |
Dung Feeding Practices in C. G. Plains
Dung feed practices is given in the Table 1. Maximum average dung feed percentage was found in Dhamtari (101.67) followed by Mahasamund (98.6 %) and minimum was found in Durg (56.29 %) followed by Raigarh (73.10 %). The dung feed percentage is significantly differing among the districts. On an average the overall gas dung feeding percentage in the biogas plants in the Chhattisgarh plain was found to be 85.56 %.
Gas use time in the Districts
The use of biogas (time, h) by the owners was determined from the use of burner for cooking and other purposes in one day. It is shown in Table 2. The gas use time was found maximum in district Durg (6.04 h) followed by Raipur (4.35 h) and was found minimum in district Bilaspur (2.7 h) followed by Dhamtari (3.03 h). On an average the overall biogas use time in the Chhattisgarh plain was found 3.75 h / day.
Overall Plant Efficiency in the Districts
The overall plant efficiency of each districts of Chhattisgarh plains is presented in Table 2 and Table 3. The overall district wise plant efficiency of biogas plants of C.G plain was found 64.72 %, which varied district to district from 46-82 %. The maximum overall plant efficiency was recorded in district Mahasamund (82.3 %) followed by Dhamtari (73.2 %).
Table 3: Capacity-wise status and performance of biogas plants
|
S.N. |
Plant capacity ,m3 |
Under working Nos. |
Non- working Nos. |
Total sample, Nos. |
Working / gas generation efficiency,% |
Dung fed, % |
Over all plant’s efficiency % |
|
1 |
2 |
62 |
10 |
72 |
76.60 |
95.87 |
73.44 |
|
2 |
3 |
08 |
01 |
09 |
77.25 |
83.95 |
64.85 |
|
3 |
4 |
13 |
01 |
14 |
71.08 |
62.77 |
44.62 |
|
4 |
6 |
14 |
05 |
19 |
75.86 |
61.14 |
46.38 |
|
5 |
8 |
02 |
01 |
03 |
81.75 |
50 |
40.87 |
|
Total |
99 |
18 |
117 |
- |
- |
- |
|
|
Average |
76.51 |
70.75 |
54.00 |
||||
Whereas the minimum overall plant efficiency was recorded in the district Durg (45.49 %). In only one district the plant performance index feed less than 50% that was found due to dung feed percentage lowest than the other districts. Maximum number of plant was found of size 2 m3 (72) in which 62 (86 %) were found in working condition and rest 10 (14 %) in non-working condition followed by 6 m3 (19) in which 14 (about 74 %) were in working condition and 05 (about 26 %) in non-working condition. Minimum number of plants were found of size 8 m3 (3) in which 2 (about 67 %) were found in working condition and only one (about 36 %) was in non-working condition followed by 3 m3 biogas plant (9) in which 8 (about 89 %)were found in working condition and one (about11 %) was found in non-working condition. Average gas generation efficiency was found maximum of 8 m3 (81.750 %) followed by 3 m3 (77.25 %). Minimum Average gas generation efficiency was found of 4 m3 (71.08 %) followed by 6 m3 plants (75.86 %).
Overall performance (Performance index) was found maximum of 2 m3 plant (73.44 %) followed by 3 m3 (64.85 %). Minimum performance was found of 8 m3 size (40.48 %) followed by 4 m3 size of plant (44.62 %).
Conclusions
Performance of the biogas plant could be used for identifying points in time in which production problems arise and with further studies these problems could perhaps be taken care of to increase biogas production. It could also be used to compare biogas plants to find the one which operate with greatest efficiency. Overall efficiency of biogas plants in the Chhattisgarh Plains was found 64.72 %, and its trend was found in decreasing order (73.44 to 40.87 %.) with increase in size of plant (2 to 8 m3). Overall district wise biogas generation efficiency of Chhattisgarh plain was found to be 75.73 %. On an average the dung fed percentage, in the biogas plants, of the Chhattisgarh plain was found to be 85.5 % of the total capacity. The dung fed was found maximum in Dhamtari (101.6 %). Capacity wise average gas generation efficiency was found maximum of 8 m3 size plants (81.75 %) however rest are found similar in gas generation efficiency. Dung fed percent was found in decreasing trend 73.44 – 40.87 % with increasing size of plants 2 – 8 m.3
Acknowledgment
The authors are grateful to CREDA and Faculty of Agriculture Engineering, IGKV, Raipur (C.G) for providing facilities and valuable guidance to carry out the study.
References
- Chauhan, B. M., 2009. The biogas cum fertilizer plant: MNRE Scheme. A Review. http://www.IREDA,Gov.in/pdf/April-Dec-2009.
- Govil, G. P. and Gaur, R. R., 2000. Development of conversion kits to promote the use of biogas in existing diesel engines for variable load rural applications. In: Proc. Nation. conf. on commercialization aspects of renewable energy sources. 100-111.
- Kumar Shailendra, 2008. Techno Economic Study of Biogas plants in the Chhattisgarh Plains. Unpublished M.Tech, Thesis, Dept of Farm Machinery and Power, IGKV, Raipur, Chhattisgarh, India.
- Kumar S, Mishra B. P., Patel S. K., Yaduvanshi B. K., Chinchorkar S. S. and Khardiwar M.S. 2013. Trends of biogas plants adoption in Chhattisgarh, India. Spring, 2013, 2(2), Pp 10-13.
- Kumar, Shailendra, Mishra, B.P., Patel, S.K., Yaduvanshi B.K, Sayyad, F.G. and Khardiwar, M.S., 2014. A Block and Capacity Wise Status of Biogas Plants of Chhattisgarh Plains in India. International Journal of Multidisciplinary and Current Research, issue Jan/Feb 2014 pp 18-21.
- Mittal, K. M., 1997, Conventional energy systems, principal, progress and prospect. Wheeler publishing company, New Delhi: 120-121.
- Nesmith, C., 1991. Gender, Trees and Fuel. Social Forestry in West Bengal, India. Human Organisation. Vol.50, No.4, pp337-348.
CrossRef - Rai, G.D. 1997. Non-Conventional Energy Sources. Khanna Publishers Pvt. Ltd. New Delhi, India: 311 -435.
- Ranga Nathan, 2010. Biogas in India - Current Status and Future Possibilities.http://Enzine Article.com.


