Estimation of air quality in the opencast mine of Jharia Coal field, India
Snigdha Kundu1 * and Asim Kumar Pal1
1
Department of Environmental Science and Engineering,
Indian School of Mines,
Dhanbad,
826004
Jharkhand
India
http://dx.doi.org/10.12944/CWE.10.2.37
A systematic air quality assessment study was carried out at Rajapur opencast mine in Jharia Division as per standard guideline. The average concentration of SPM, PM10 and PM2.5 concentrations were observed to be in the range of 294 to 965μg/m3, 100 to 498 μg/m3 and 85 to 296 μg/m3 respectively. The SO2 and NOx concentration were in the range of 48.2 to 98.2μg/m3 and 32.8 to 149.39 μg/m3 respectively. The trace metals concentration in PM10, e.g., lead, nickel, arsenic etc. were also analyzed by Atomic Absorption Spectroscopy technique and were observed to be 0.380 ± 0.009 μg/m3, 0.06 ±0.02 μg/m3, and 0.00432±0.028 μg /m3 respectively. The observed concentrations were then compared with National ambient air quality standard (NAAQS, 2009) and Ambient Air quality Standard for existing as well as new Coal Mines (CMS, 2000). Most of them were found exceeding the statutory norms.
Copy the following to cite this article:
Kundu S, Pal A. K. Estimation of air quality in the opencast mine of Jharia Coal field, India. Curr World Environ 2015;10(2) DOI:http://dx.doi.org/10.12944/CWE.10.2.37
Copy the following to cite this URL:
Kundu S, Pal A. K. Estimation of air quality in the opencast mine of Jharia Coal field, India. Curr World Environ 2015;10(2). Available from: http://www.cwejournal.org/?p=10170
Download article (pdf) Citation Manager Publish History
Introduction
Coal mining industry now uses modern technology with powerful and high capacity machinery so as to increase coal extraction capability at the cost of large amount of dust, gases, etc. spewed into the atmosphere, thereby degrading quality of air. These pollutants have harmful consequences not only on the mine workers, but also, depending on the meteorological conditions, on the human settlements, agricultural lands and live stocks in the nearby areas.
Particulate matter is the predominant pollutant connected with the coal mining and its handling operations. The airborne particulates and the associated trace metals were found to be the major cause of both acute and chronic adverse health effects (Prieditis and Adamson, 2002; Magas et al., 2007; Wild et al., 2009). A number of epidemiological studies indicated a significant linkage between airborne particulate matters and elevated rate of mortality (Pope, 2000; Shah, 2009). The techniques of coal extraction and processing are very specific to the individual site due to difference in geology, mineralogy, terrain and many other factors. Through this research study, emphasis has been made to provide salient information/features of air quality aspects in an open cast mine of Jharia Coalfield.
Description of study area
Rajapur OCP (open cast project) is one of the important OCP in Cluster VII of Bharat Coking Coal Ltd (BCCL) in Jharia Coalfield (Fig 1).BCCL which is a subsidiary of Coal India Limited operates in the state of Jharkhand and West Bengal. Its operation is spread over 305 Km2 in the districts of Dhanbad, Bokaro and Burdwan. Mining operation is spread over two coalfields namely Jharia Coalfield and Ranigunj Coalfield. BCCL has produced 29.04 Mt. of coal during 2010-11. Cluster VII covers 12 mining lease holds with 14 underground/opencast mines. The total leasehold of this Cluster is 2127.70 Ha. It is located in the East Central part of JCF. It falls between the latitude 230 47’ 00” to 230 43’ 10’’ N and longitudes 860 22’ 54.6’’ to 860 24’ 45’’ E. The Cluster has long history of fire and subsidence.
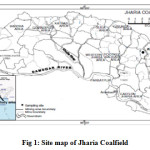 |
Figure 1: Site map of Jharia Coalfield Click here to View figure |
Materials and methodology
Ambient air quality monitoring was undertaken at Rajapur OCP of Jharia coalfield during Summer, 2014. The sampling was done for twenty four hours and twice a week and it was continued for four weeks in summer season as per the criteria of IS 5158 Part-XIV, 2006.
Sampling for estimation of SPM and PM10 concentrations were performed with the help of Respirable Dust Sampler with thermo-electrically cooled gaseous sampler attachment (Envirotech make). The flow rate of the sampler was maintained at 1.1-1.3 m3/min for respirable particulate matter and 0.5 and 0.2 lpm for SO2 and oxides of nitrogen (NOx) respectively. The respirable dust sampler (APM 460 NL) uses an enhanced model of cyclone to separate the coarser particles from the air stream before filtering it on the 0.5 micron glass-fiber pore-size filter which allows a determination of both SPM and the respirable fraction of suspended particulate matter (RPM). The coarse particles collected in the cyclone separator are transferred quantitatively on a petridish and evaluated gravimetrically. Sum of masses of coarse and respirable particles gives the mass of SPM collected during sampling. The SPM concentrations are computed from the mass of SPM and total volume of air sampled. Similarly, for PM2.5, APM 560 Fine Dust Sampler (16.7 LPM) was used. Here, ambient air is allowed to pass through Louvered inlet and WINS Impactor assembly. Particulate matter of size <2.5 microns is deposited on 46.2 mm dia. PTFE filter paper. The difference of final weight and initial weight of filter paper gives the weight of particulate matter of size <2.5 microns. The concentration of PM 2.5 is computed as the weight of dust deposited on the filter divided by volume of air sampled.The samplers were installed in the field as per the prescribed sampling siting criteria of IS: 5182 part IV giving a special emphasizes on machine safety and power availability. For analysis of trace metals in ambient air was done according to standard methodology. The acid digestion was performed in Teflon bombs. The filtrates were analyzed using AAS (GBC Avanta) for determination of trace metals. The detection limit for different trace metals for the AAS are as follows Fe (0.005 ppm), Pb (0.01 ppm), Ni (0.009 ppm), Zn (0.005 ppm), Cu (0.001 ppm, Cd (0.004 ppm), Mn 90.0015 ppm) and Cr 90.003 ppm).The concentration of an element in the atmosphere is obtained from the following relation,
C(μg/m3) = Concentration of the element in digested sample (μg/mL)/volume of the air sample(m3) x Total volume of the sample (mL)/Percent of filter area used for analysis.
Results and Discussions
The average concentration of SPM, PM10 and PM2.5 concentrations were observed in the range of 294 to 965μg/m3, 100 to 498 μg/m3 and 85 to 296 μg/m3 respectively. SO2 and NOx concentration were in the range of 48.2 to 98.2μg/m3 and 32.8 to 149.39 μg/m3 respectively. The air quality data are depicted in Table 1. The observed concentrations were then compared with National ambient air quality standard (NAAQS, 2009). Ambient Air quality Standard for existing as well as new Coal Mines (CMS, 2000) laid down and notified by MOEF, GOI in September 2000 was also considered to evaluate the pollution status. The comparisons are presented in Fig 2 to Fig 6.The average PM10 concentration exceeded both NAAQS (100 μg/m3) and CMS (300 μg/m3). The high concentration of PM 10 is mainly due to different mining activities as well as running of vehicles on the unpaved road including abrasion of road materials, tires and brake linings as well as re-suspension of soil material because of traffic induced turbulence (Barmpadimos et al., 2011; Bukowiecki et al., 2010).The PM2.5 concentration exceeded NAAQS (60 μg/m3).The sources of PM2.5 has generally been confined to movement of vehicle on paved/unpaved roads, vehicular exhaust (diesel based), mining activities particularly drilling and blasting of rocks. The emission inventory indicates that heavy duty diesel trucks were accountable for majority of the exhaust particulate matter(Sawyer et al., 2000).The SPM concentration exceeded permission level of CMS (600 μg/m3). The movement of vehicles on the haul road of the opencast mines has been recognized as the major source of fugitive dust emitted from the surface coal mines (Cowherd, 1979). The average SO2 concentration was below NAAQS (80 μg/m3) and CMS (120 μg/m3). The same for NOX was found above NAAQS (80 μg/m3) but below CMS (120 μg/m3). The main source of NOx in coal mining rejoin are vehicular exhaust, blasting operations, etc. Unpremeditated burning of coal in waste dumps and mine fire release considerable amount of oxides of nitrogen. During combustion process (at high temperature) atmospheric nitrogen combines with oxygen to form NOX which is aggravated when engine is diesel operated. Tunnel studies indicated that diesel engine produce five times the amount of NOX per mass of fuel burned when compared to gasoline vehicles (Kirchstetter et al., 1998).
Table 1: Air Quality Data
| Parameters | SPM | PM10 | PM 2.5 | SO2 | NOx |
| No. of observations | 24 | 24 | 24 | 24 | 24 |
| Minimum Concentration(μg/m3) | 294 | 100 | 85 | 48.2 | 32.8 |
| Maximum Concentration(μg/m3) | 965 | 498 | 296 | 98.2 | 149 |
| Average | 743.875 | 333.2 | 160.91 | 79.47 | 111.39 |
| 98th percentile | 957.18 | 492.02 | 288.18 | 97.64 | 148.43 |
Table 2: Trace elements concentration level in summer season
| Trace Metal | Concentration in µg/m3 |
| Pb | 0.380 ± 0.009 |
| Ni | 0.06 ±0.02 |
| As | 0.00432±0.028 |
| Cu | 3.10 ± 0.01 |
| Mn | 1.52 ± 0.21 |
| Fe | 18.29 ± 0.25 |
| Zn | 0.42 ± 0.24 |
| Cd | 0.04 ± 0.016 |
| Cr | 0.440 ± 0.30 |
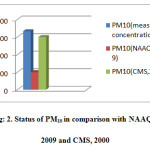 |
Figure 2: Status of PM10 in comparison with NAAQS, 2009 and CMS, 2000 Click here to View figure |
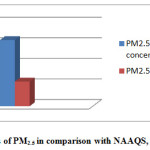 |
Figure 3: Status of PM2.5 in comparison with NAAQS, 2009 Click here to View figure |
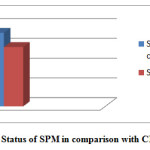 |
Figure 4: Status of SPM in comparison with CMS, 2000 Click here to View figure |
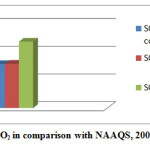 |
Figure 5: Status of SO2 in comparison with NAAQS, 2009 and CMS,2000 Click here to View figure |
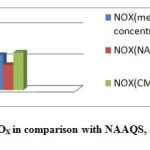 |
Figure 6: Status of NOX in comparison with NAAQS, 2009 and CMS,2000 Click here to View figure |
Trace elements analysis of dust samples (PM10) during summer season were done and shown in Table 2.Trace element pollutants in PM10 may be natural or anthropogenic. Several trace elements (Pb, Cu, Mn, Co) are considered essential for life. The sources of trace elements may be attributed as discussed below:
Pb (Lead): may be due to higher emissions from vehicular exhausts. This does not rule out the case of adulteration of fuel for automobiles.
Ni (Nickel): may be due to traffic exhausts, wearing and tearing of vehicular engines parts for old vehicles, etc.
As(Arsenic):Arsenic compounds can be either organic or inorganic. Inorganic arsenic can cause acute, sub acute and chronic effects, which may be either chronic or systematic.
Cu (Copper): this originates from wearing of brake pads of vehicles due to forced deceleration (Hulskotte et al., 2006).
Mn (Manganese): this may be due to crustal dust which includes the suspension of road dusts by vehicles and wind erosion .
Fe (Iron): This is due to the use of iron in brake lining which leads to its emission in ambient air. (Hulskotte et al., 2006)
Zn (Zinc): This is due to tracer of tire wear particles from vehicular movement (Birmili et al., 2006; Wang et al., 2006)
Cd (Cadmium): Cd level may be related due to the composition of gasoline, motor oil, car tires and road side deposition of the residues of those materials as well as traffic density (Sharma and Prasad,2010)
Cr (Chromium): Chromium is emitted mainly by fumes stainless steel welding (WHO.2000; Langard,1994; Danielsen et al.,1993) and from the abrasion of brake lining and tire of the vehicles (Sadasivan and Negi,1900;Hopke,1980).
The observed concentrations were then compared with National ambient air quality standard (NAAQS, 2009) (Fig 7-9).The measured concentration of Ni (0.06µg/ m3) was found more than NAAQS limit concentration (0.02 µg/m3) whereas measured concentration of Arsenic and lead ( 4.320 ng/m3 and 0.380 µg/ m3 respectively) was found considerably less than NAAQS concentration 6.0 ng/m3 and 1.0 µg/m3 respectively.
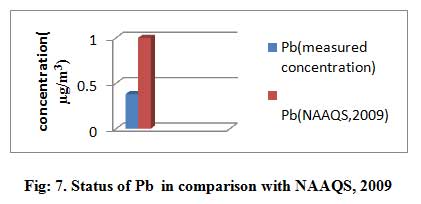 |
Figure 7: Status of Pb in comparison with NAAQS, 2009 Click here to View figure |
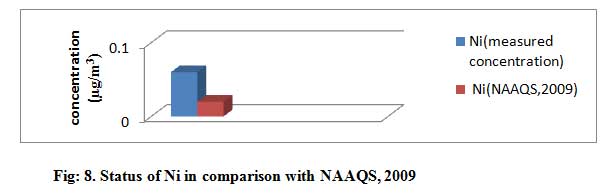 |
Figure 8: Status of Ni in comparison with NAAQS, 2009 Click here to View figure |
 |
Figure 9: Status of As in comparison with NAAQS, 2009 Click here to View figure |
Conclusion
The study reveals the generation of considerable amount of particulate matters due to various mining activities of the concerned opencast mine of the Jharia coalfield. The measured concentration of the particulate matter (SPM, PM10 and PM2.5 ) exceeded the NAAQS, 2009 and CMS, 2000 standards. Among heavy metals, observed concentration of Ni was found more than NAAQS limit due to vehicular exhausts, wearing and tearing of vehicular engine parts, etc. However, the concentration of Arsenic and lead was found within the permissible limit. The trace metals concentrations were observed as per following decreasing trend, Fe> Cu> Mn> Cr> Zn> Pb>Ni>Cd> As. For the lack of any existing guidelines, the concentrations of other trace metals could not be compared.
Acknowledgment
The authors would like to thank the Department of Environmental science and Engineering of Indian School of Mines, Dhanbad for providing necessary facilities to undertake the present research study. We are also thankful to Bharat Coking Coal Ltd for their support and encouragement.
References
- Prieditis, H.R.,Adamson, I.Y.,Comparative pulmonary toxicity of various soluble metals found in urban particulate dust.Experimental Lung Research.28,563-576(2002).
- Magas, O.K.,Gunter,J.T.,Regens,J.L. Ambient air pollution and daily pediatric hospitalizations for asthma. Environmental Science and Pollution Research.14,19-23(2007).
- Wild , P.,Bourgkard,E.,Paris,C. Lung cancer and exposure to metals:the epidemiological evidence. Method Molecular Biology .472,139-167(2009).
- Pope, C.A. Review: epidemiological basis for particulate air pollution health standards. Aerosol Sci.Technol,32,4-14(2000).
- Shah,M.H. Atmospheric particulate matter: trace metals and size fractionation, VDM Verlag Dr.Muller, Saarbrucken,Germany,228(2009).
- NAAQS,National Ambient Air Quality Standard, India, prescribed by Central Pollution Control Board on 18 November(2009).
- Barmapadimos, I.,Nufer, M., Oderbolz,D.C.,Keller, J., Aksoyoglu, S., Hueglin, C,. Baltensperger,U. Prevot, A.S.H. The weekly cycle of ambient concentration and traffic emission of coarse (PM10 to PM2.5) atmospheric particles. Atmospheric Environment.45, 4580-4590(2011).
- Bukowiecki, N., Lienemann, P.,Hill,M., Furger,M.,Richard,A.,Amato, F.,. Prevot,A.S.H., Baltenspurger,U.,Buchmann,B.,Gehrig, R. PM10 emission factors for non-exhaust particles generated by road traffic in an urban street canyon and along a freeway in Switzerland.Atmospheric Environment.44,2330-2340(2010).
- Sawyer, R.F.,Harley, R.A.,Cadle, S.H.,Norbeck,J.M.,Slott, R., Bravo, H.A. Mobile sources critical review:1998 NARSTO assessment. Atmospheric Environment. 34,2161-2181(2000).
- Cowherd , C.Jr. Measurements of fugitive dust emission from haul roads. Report No. EPA600/7-79-181, Research Triangle Park, NC;USEPA, Industrial Environmental Research Lab(1979).
- Chadwick MG, Highton NH, Lindman N. Environmental impacts of The coal mining and utilization. England: Pergamon Press,p. 295(1987).
- Kirchstetter, W.T., Miguel, H.A., Harley , A.R. On road comparison of exhaust emission from gasoline and diesel engines.In: Proceedings of the Eighth CRC On-road Vehicle Emission Workshop, April 20-22,San Diego, CA(1998).
- Hulskotte, J.H.H., Schaap,M.,Visschedijk,A.J.H. Brake wear from vehicles as an important source of diffuse copper pollution.10 th international conference on diffuse pollution and sustainable Basin Management,Sept pp.18-22,Istambul,Turkey(2006).
- Birmili , W.,Allen,A.G.,Bary,F., Harrison R.M. Trace metal concentrations and water solubility insize fractioned atmospheric particles and influence of road traffic.Environmental Science Technology.40(4),1144-1153(2006).
- Wang,X.L.,Sato, T., Xing,B.S. Size distribution and anthropogenic sources apportionment of airborne trace metals in Kanazawa, Japan.Chemosphere. 65,2440-2448. 16.Sharma, S., and Prasad, F.M. 2010.Accumulation of lead and cadmium in soil and vegetable crops along major highways in Agra (India).E-Journal of Chemistry.7(4),1174-1183(2006).
- World Health Organisation(WHO).Guidelines for Air Quality.World Health Organisation, Geneva. Retrieved from http://www.who.int/environmentalinformation/Air/Guidelines/aqguide7.pdf. (2000)
- Langard,S. Nickle-related cancer in welders.The science of the total environment.148,303-309(1994).
- Danielsen,T.E.,Langard,S.,Andersen,A.,Knudsen,O. Incidence of cancer among welders of mild steel and other shipyard workers. British Journal of Industrial Medicine.50,1097-1103(1993).
- Sadasivan, S., Negi , B.S.Elemental characterization of atmospheric aerosols. Science of the Total Environment.96,269-279(1990).
- Hopke, P.K. Multielemental characterization of urban roadway dust.Environmental Science and Technology.14,164-172(1980).


