A Study of Maximum and Minimum Temperatures Trends at Junagadh (Saurashtra Region) of Gujarat, India
Bhavin Ram1 * , S. S. Chinchorkar1 , M. S. Khardiwar1 and F. G. Sayyad1
1
Anand Agricultural University,
Muvaliya Farm,
Dahod,
389 151
Gujarat
India
http://dx.doi.org/10.12944/CWE.10.1.41
Copy the following to cite this article:
Ram B, Chinchorkar S. S, Khardiwar M. S, Sayyad F. G. A Study of Maximum and Minimum Temperatures Trends at Junagadh (Saurashtra Region) of Gujarat, India. Curr World Environ 2015;10(1) DOI:http://dx.doi.org/10.12944/CWE.10.1.41
Copy the following to cite this URL:
Ram B, Chinchorkar S. S, Khardiwar M. S, Sayyad F. G. A Study of Maximum and Minimum Temperatures Trends at Junagadh (Saurashtra Region) of Gujarat, India. Curr World Environ 2015;10(1). Available from: http://www.cwejournal.org/?p=8142
Download article (pdf) Citation Manager Publish History
This problem worries the scientific community, as it could have a major impact on natural and social systems at local, regional and national scales. Numerous climatologists1 2; Intergovernmental Panel on Climate Change (IPCC),3-5 agree that there has been a large-scale warming of the Earth’s surface over the last hundred years or so. This warming up of the Earth during the 20th century brought with it a decrease in the area of the world affected by exceptionally cool temperatures, and, to a lesser extent, an increase in the area affected by exceptionally warm temperatures.1 Some analyses of long time-series of temperatures on a hemispheric and global scale3 have indicated a warming rate of 0.3-0.6oC since the mid-19th century, due to either anthropogenic causes 3 or astronomic causes.6, 7 The Third Assessment Report projections for the present century are that average temperature rises by 2100 would be in the range of 1.4-5.8oC. 3, 8 Records show that global temperatures, averaged world-wide over the land and sea, rose 0.6 ± 0.2oC during the 20th century. A number of recent studies have been devoted to global, hemispherical, or regional long-term temperature variations. On a global scale, climatologically studies indicate an increase of 0.3-0.6oC of the surface air temperature 0.5-0.7oC for the Northern Hemisphere) since 1860,1,9,10 while the eighth warmest years ever recorded were observed after.11 A broad consensus of scientists has concluded that, the earth’s surface air temperature increased by about 0.6oC during the 20th century, that most of the warming during the latter half of the century is attributable to human emissions of greenhouse gases, and that temperature increases were greatest during the 1990 s.3 Numerous other factors such as variations in solar radiation and pollutant aerosols also contribute to climate change12,13 The IPCC panel further concluded that global temperature increases are likely to persist in the 21st century and will probably be accompanied by changes in precipitation and runoff amounts. Future climate change is more difficult to predict with great certainty at the regional scale due to spatial resolution limitations of current climate models and to the likely influence of unaccounted for factors such as regional land use change.14 The dominating climatic feature in the region is the summer Southwest Asian Monsoon, which influences the climatology of the nations within the sub-region to varying degrees and in diverse ways3 Climate trends and variability in Asiaare generally characterized by increasing surface air temperature which is more pronounced during winter than in summer. The observed increases in some parts of Asiaduring recent decades ranged between less than 1oC to 3oC per century. Increases in surface temperature are most pronounced in North Asia15 ; Climate Change in Russia16,17 The Third Assessment Report predicted that the area-averaged annual mean warming would be about 3oC in the decade of the 2050s and about 5oC in the decade of the 2080s over the land regions ofAsia as a result of future increases in atmospheric concentration of greenhouse gases18 Several studies (Balling and Idso, 1989; Karl et al., 1988; Goodrich 1992)19,21,27 published in the last 15 years have attempted to assess the effects of urbanization on local and regional climate. A study by Jones et al. (1990)23 on urbanization and related temperature variation indicates that the impact of urbanization on the mean surface temperature would be no more than 0.05 1C per 100 years. This value appears to be too small when compared with the other studies (Fujibe, 1995; Hingane,1996)20,22 using a similar technique. According to the study for Japan by Fujibe (1995)20 a rising trend of 2–5 1C per 100 years in minimum temperature has been observed at several large cities in Japan. While another study (Hingane, 1996)22 estimates rising trends of 0.84 and 1.39 1C per 100 years in the mean surface temperature calculated for Mumbai and Kolkata, respectively. Another study (Wibig and G"owicki, 2002)25 related to the variability of minimum and maximum temperature in Poland reveals that the strongest increase in minimum and maximum temperatures occurs in mid and late winter. However, beginning of winter and summer indicates decreasing tendencies. A similar study by Thapliyal and Kulshreshtha (1991)24 on temperature trends over Indian cities indicates a slight warming within the limits of 1 SD between 1901 and 1990. It is now recognized that urbanization and changing land-use influence minimum temperature. Local temperature is thus one of the major climatic elements to record environmental changes brought about by industrialization and urbanization. In view of the importance of air temperature, as indicated above, it would be of interest to study the long-term variation of surface air temperature in Junagadh (Saurashtra Region) of Gujarat, India, which, during the last two decades saw phenomenal rise in urbanization and industrialization. Therefore, the objective of the present work is to investigate the annual and seasonal temperature trends over Junagadh (Saurashtra region) Gujarat, India. It is also of interest to find out whether the overall change in temperature is due to change in minimum or maximum temperature. This will help to know changes in night and day temperatures as well.28
Study Area
The Junagadh city is located between latitudes 21º 31’N and 70º 49’ E in fig 1. The city is a gate way to famous Gir Forest which is the natural habitat for the last existing population of Asiatic Lion in the wild. Apart from Gir, there is Girnar Ranges, Barda Hills and extensive grasslands known as Vidis, which also support a variety of wildlife especially avifauna. Junagadh has a tropical wet and dry climate, with three distinct seasons observed, a mild winter from November to February, a hot summer from March to June, and a monsoon from July to October. Junagadh faces adverse climatic conditions in the summer months with the temperature ranging from 28° Celsius to 38° Celsius. In the winter months, the temperature ranges from 10° Celsius to 25° Celsius. Various factors such as its close proximity to the sea influence the weather of Junagadh. The latent winds from the sea affect the climatic conditions in the region..
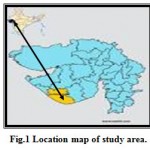 |
Location map of study area. Click here to View figure |
Data and methodology
Monthly maximum and minimum temperature data during the period 1980–2011 (35 years) were obtained from Department of Agricultural Meteorology, Junagadh Agricultural University, Junagadh (Saurashtra Region) Gujarat. From the basic temperature data, mean maximum (Tmax), mean minimum (Tmin) and mean temperature, along with their standard deviation (SD) and coefficient of variation have been computed for each month and three seasons, viz summer, monsoon and winter, that are depicted in Table 1. December, January and February are considered for the analysis of winter temperature as these 3 months record lower temperatures (Table 1). While computing the mean for winter season December of the previous year is included. March, April and May are months with highest mean maximum temperatures and, therefore, represent the summer season. June to September months constitute monsoon season. These data were then subjected to a 11-year running mean to find the trends. A linear trend line was added to the series to simplify the trend. Temporal changes in the annual and seasonal values were also analysed by Mann–Kendall rank statistics (t) to confirm the significance of the observed trend. The value of t can be used as the basis of a significant test by comparing it with
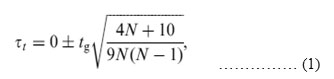
Table 1: Monthly and seasonal temperature means
| Month | Tmax (0C) | Tmin (0C) |
Mean Temp (0C) |
Standard Deviation (%) | Coefficient of Variance (%) |
| January |
33.6 |
11.5 |
22.5 |
1.4 |
6.1 |
| February |
36.7 |
14.0 |
25.3 |
1.3 |
5.2 |
| March |
40.5 |
18.9 |
29.7 |
1.4 |
4.8 |
| April |
42.6 |
23.0 |
32.8 |
1.2 |
3.7 |
| May |
43.0 |
25.3 |
34.2 |
1.3 |
3.8 |
| June |
43.0 |
26.0 |
34.5 |
1.4 |
3.9 |
| July |
35.4 |
25.1 |
30.3 |
1.2 |
3.9 |
| August |
33.1 |
24.6 |
28.8 |
1.2 |
4.1 |
| September |
36.1 |
23.6 |
29.9 |
1.0 |
3.2 |
| October |
38.4 |
21.2 |
29.8 |
1.2 |
3.9 |
| November |
36.4 |
16.7 |
26.6 |
1.4 |
5.4 |
| December |
34.4 |
12.2 |
23.3 |
1.5 |
6.4 |
| Annual |
37.8 |
20.2 |
29.0 |
0.9 |
3.0 |
| Winter |
34.9 |
12.6 |
23.7 |
1.2 |
4.9 |
| Summer |
27.8 |
14.8 |
32.2 |
1.0 |
3.2 |
| Monsoon |
36.9 |
24.8 |
30.9 |
0.9 |
3.0 |
Note: SD and CV are computed for mean temperature.
Annual Temperature Trends
The mean annual, Tmax and Tmin along with 11-year moving mean and trend line are presented in Fig. 1. The mean annual temperature shows a significant long-term slightly decreasing trend. However, it can be seen from the figure that there had been a relatively warm period during 2000-2004. Similar features are also seen in annual Tmin and Tmax with slight differences in the relative dominance of warm and cool periods. A conspicuous cooling after mid-1999s can be seen in both Tmin and Tmax temperatures. However, it is observed that there is no significant trend in Tmin, while Tmax shows cooling trend, significant at 0.05 levels.
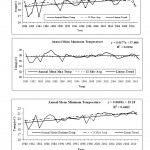 |
Figure 1: Annual temperature trends at Junagadh(Saurashtra Region). Click here to View figure |
Seasonal Temperature Trends
The mean temperature and the Tmax and Tmin for summer, winter and monsoon seasons during the period 1980–2011 (32 years) are presented in Fig. 2. The figure also gives 11-year moving average of the temperature.
Winter
The winter mean temperature shows a decreasing trend in spite of intermittent increases, which is statistically significant at 0.01 level (Table 2). Tmin and Tmax also show cooling. However, this cooling trend of Tmin is significant at 0.01 level. The Tmax during winter though shows decrease, is not statistically significant. The 11-year running mean indicates that winter temperature is increasing up to mid-2000s and then decreasing. While minimum temperature depicts two epochs of warming around mid-2000s and mid-2004s, significant decrease in winter mean temperature can be attributed to predominant decline in minimum temperature (Fig. 2).
Summer
The summer mean temperature also shows a decreasing trend, significant at 0.05 levels. However, unlike winter season this decrease is caused by significant fall in maximum temperature. The Mann–Kendall test indicates that Tmax decrease is significant at 0.05 levels, while Tmin shows no particular significant trend. Therefore, it can be inferred that daytime temperatures in summer are significantly decreasing. The 11-year running mean indicates that the temperature during summer was higher during 1995s to early 1997s after which it has come down.
Table 2: Result of Mann–Kendall rank statistics
|
Month |
Tmax |
Tmin |
Tmean |
|
January |
-0.004 |
0.336** |
0.168 |
|
February |
0.128 |
0.474** |
0.388 |
|
March |
0.214 |
0.366** |
0.306 |
|
April |
0.130 |
0.254** |
0.157 |
|
May |
0.071 |
0.285** |
0.177 |
|
June |
0.091 |
0.375** |
0.189 |
|
July |
0.078 |
0.151 |
0.095 |
|
August |
0.128 |
0.112 |
0.112 |
|
September |
-0.128 |
0.325** |
0.002 |
|
October |
-0.059 |
0.183 |
0.142 |
|
November |
0.249 |
0.420** |
0.420 |
|
December |
0.006 |
0.373** |
0.144 |
|
Annual |
0.086 |
0.499** |
0.280 |
|
Winter |
0.032 |
0.495** |
0.271 |
|
Summer |
0.131 |
0.344** |
0.245 |
|
Monsoon |
-0.050 |
0.267** |
0.073 |
*Significant at 0.05 level, **significant at 0.01 level.
Monsoon
The monsoon season, on the contrary, depicts a significant increase in the mean temperature. This is due to the increase in Tmin being significant at 0.01 levels. This indicates that the night temperatures during recent years have gone up during monsoon. t-Test when applied (Table 3) indicates that annual mean temperatures decrease at 0.05 level and of all seasonal temperatures, winter mean Tmin and monsoon Tmin trends are significant at 0.01 level. Thus, all the trends are also well-supported statistically.
Monthly Temperature tTrends
Behaviour of minimum and maximum temperature has been studied for individual months by subjecting them to the Mann–Kendall test. The results are presented in Table 2. It is interesting to note that the Tmin shows a significant trend in a majority of the months. The beginning of winter, though it shows decreasing trend in minimum temperature, is not statistically significant. The later part of winter (i.e. January and February) shows decreasing trend significant at 0.01 level. The reverse trend of Tmin is seen during the monsoon months of June to September, significant at 0.01 level. Tmax also shows cooling trend practically for all months except July and September. However, this cooling is significant for January at 0.01 level and April and May at 0.05 level.
Table 3: Linear equations and their significance tested by t-test
|
Month |
Linear equation |
Calculated t |
| Annual mean temperature |
y= 0.0393x + 28.332 |
2.556* |
| Annual Tmin |
y = 0.0609x + 19.18 |
4.917** |
| Annual Tmax |
y = 0.0177x + 37.48 |
0.795 |
| Winter mean temperature |
y = 0.0562x + 22.80 |
-0.344 |
| Winter Tmin |
y = 0.0993x + 10.922 |
6.393** |
| Winter Tmax |
y = 0.013x + 34.691 |
0.432 |
| Summer mean temperature |
y = 0.0676x + 26.186 |
-1.531 |
| Summer Tmin |
y = 0.0993x + 10.922 |
1.755 |
| Summer Tmax |
y = 0.0359x + 41.45 |
1.557 |
| Monsoon mean temperature |
y = 0.0239x + 30.482 |
-0.27 |
| Monsoon Tmin |
y = 0.0424x + 24.135 |
0.144 |
| Monsoon Tmax |
y = 0.0053x + 36.829 |
-0.204 |
*Significant at 0.05 level, **significant at 0.01 level.
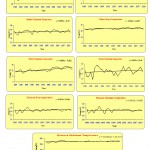 |
Figure 2: Temperature trends for summer, winter and monsoon at Junagadh (Saurashtra Region) Gujarat, India. Click here to View figure |
Conclusion
An important aspect of the present study is the significant cooling trend in mean annual temperature, which is more predominant during winter season. The summer season also shows significant cooling trend due to slightly decrease in Tmax. This cooling trend in Junagadh (Saurashtra Region) Gujarat, India temperature is supported by studies conducted by other researchers (Rupa Kumar and Hingane, 1988).26 These authors studied the temperature for Junagadh (Saurashtra region) Gujarat, India during the period 198-2007 and observed a cooling trend, but not significant at any level. Against this background, in the present study, temperature data during the period 1980-2011 have been studied. The result indicates significant slightly decrease in winter temperature at 0.01 level. This suggests that the last decade has witnessed a phenomenal epoch in temperature series, leading to a decreasing trend from non-significant to significant. Contrary to this, the monsoon season shows warming trend. This may be due to significant increase in the low cloud amount during this season. We are still a long way from understanding the complex interaction of many physical processes that determine the evolution of climate.
References
- P. D. Jones, E. B. Horton, C. K. Folland, M. Hulme, D. E. Parker and T. A. Basnett, “The Use of Indices to Identify Changes in Climatic Extremes,” Climatic Change, Vol.42, No. 1, 1999, pp. 131-149.
- D. E. Parker and E. B. Horton, “Global and Regional Climate in 1998,” Weather, Vol. 54, 1999, pp. 173- 184.
- Inter Governmental Panel on Climte Change (IPCC),“Climate Change 2001: Synthesis Report, Contribution Of Working Groups I and III to the Third Assessement of the (IPCC),” CambridgeUniversityPress,Cambridge, 2001.
- P. D. Jones and A. Moberg, “Hemispheric and Large-Scale Surface Air Temperature Variations: An Extensive Revision and Update to 2001,” Journal Climate, Vol. 16, 2003, pp. 206-223.
- K. Y. Vinnikov and N. C. Grody, “Global Warming Trend of Mean Tropospheric Temperature Observed by Satellites,” Science, Vol. 302, 2003, pp. 269-272.
- W. Soon,S. Baliunas, E. S. Posmentier and P. Okeke, “Variations of Solar Coronal Hole Area and errestrial Lower Tropospheric Air Temperature from 1979 to Mid-1998: Astronomical Forcings of Change in Earth’S Climate,” New Astron, Vol. 4, No. 8, 2000, pp. 563-579.
- T. Landscheidt, “Solar Wind near Earth: Indicator of Variations in Global Temperature,” Proceedings of the 1st Solar and Space Weather Euroconference on the Solar Cycle and Terrestrial Climate, Tenerife, 2000, pp.497-500.
- IPCC, “Climate Change 2001: Impacts, Adaptation and Vulnerability,” In: J. McCarthy, O. Canziani, N. Leary, D.Dokken and K. White, Eds., Contribution of Working Group II to the Third Assessment Report of the (IPCC),World Meteorological Organisation and United Nations Environment Programme, Cambridge University Press, Cambridge, 2001.
- P. D. Jones, T. M. L. Wigley and P. B. Wright, “Global Temperature Variations between 1861 and 1984,” Nature,Vol. 322, 1986, pp. 430-434.
- P. D. Jones, “Hemispheric Surface Air Temperature Variations: Recent Trends and an Update to 1987,” Journal of Climate Vol. 1, 1988, pp. 654-660. [12] WMO, “WMO Statement on the Status of the Global Climate in 1996,” WMO, No. 858, World Meteorological Organization,Geneva, 1997.
- G. P. Brasseur andE. Roeckner, “Impact of Improved Air quality on the Future Evolution of Climate,”Geophysical Research Letters Vol. 32, No. L23704, 2005, p. 4
- N. Scafetta and B. J. West, “Estimated Solar Contribution to the Global Surface Warming Using the ACRIM TSI Satellite Composite,” Geophysical Research Letters, Vol.32, 2005, p. L18713.
- R. A. Pielke, “Land Use and Climate Change,” Science,Vol. 310, No. 5754, 2005, pp. 1625- 1626.
- I.P. Savelieva, L. N. Semiletov, Vasilevskaya and S. P.Pugach, “A Climate Shift in Seasonal Values of Meteorological and Hydro Logical Parameters for Northeastern Asia,” Progress in Oceanography, Vol. 47,No. 2,2000, pp. 279-297.
- Climate Change in Russia, IGCE Rusian Agency on Hydrometeorology and Environmental Monitoring Publishing,Moscow, 2003. G. Gruza and E. Rankova, “Detection of Changes in Climate State, Climate Variability and
- Climate Extremity,”Institute of Global Climate and Ecology,Moscow, No. 4, 2004, pp. 90- 93.
- M. Lal, H. Harasawa, D. Murdiyarso, W. N. Adger, S. Adhikary, M. Ando, Y. Anokhin, R. V. Cruz, et al., “Asia Climate Change (2001): Impacts, Adaptation, and Vulnerability Contribution of Working Group II to the Third Assessment Report of the IPCC, J. J. Mc- and K. S. White, Eds.,Cambridge University Press, Cambridge,2001(a).
- R. C. Balling Jr. and S. W. Brazel, “The Impact of Rapid Urbanization on Pan Evaporation in Phoenix, Arizona,”Journal of Climatology, Vol. 7, No. 6, 1987, pp. 593-597.
- Balling Jr., R.C., Idso, S., 1989. Historical temperature trends in the United States and the effect of urban population. Journal of Geophysical Research 94, 3359–3363.
- Fujibe, F., 1995. Temperature rising trends at Japanese cities during the last one hundred years and their relationships with population, population increasing rates and daily temperature ranges. Papers in Meteorology And Geophysics 46, 35–55.
- Goodrich, J.D., 1992. Urban bias influences on long-term California air temperature trends. Atmospheric Environment 26B, 1–7.
- Hingane, L.S., 1996. Is a signature of socio-economic impact written on the climate? Climatic Change 32, 91–102.
- Jones, P.D., Groisman, P.Ya., Coughlan, M., Plummer, N., Wang, W.C., Karl, T.R., 1990. Assessment of urbanization effects in time series of surface air temperature over land. Nature 347, 169–172.
- Thapliyal, V., Kulshreshtha, S.M., 1991. Climate changes and trends over India. Mausam 42, 333–338.
- Wibig, J., G"owicki, B., 2002. Trends of minimum and maximum temperature in Poland. Climate Research 20, 123–133.
- Rupa Kumar, K., Hingane, L.S., 1988. Long term variations of surface air temperature at major industrial cities of India. Climatic Change 13, 287–307.
- Karl, T.R., Diaz, H.F., Kukla, G., 1988. Urbanization: its detection and effect in the United States climate record. Journal of Climate 1, 1099–1123.
- Alaka Gadgil_, Amit Dhorde,’ Temperature trends in twentieth century at Pune,India, Atmospheric Environment 39 (2005) 6550–6556 Atmospheric Environment 39 (2005) 6550–6556


