Assessment of Ground Water Quality in Rajajinagar of Bangalore
Alimuddin 1 *
1
Department of CS and IT,
Maulana Azad National Urdu University,
Gachibowli,
Hyderabad- 32
India
http://dx.doi.org/10.12944/CWE.10.1.40
Copy the following to cite this article:
Alimuddin. Assessment of Ground Water Quality in Rajajinagar of Bangalore. Curr World Environ 2015;10(1) DOI:http://dx.doi.org/10.12944/CWE.10.1.40
Copy the following to cite this URL:
Alimuddin. Assessment of Ground Water Quality in Rajajinagar of Bangalore. Curr World Environ 2015;10(1). Available from: http://www.cwejournal.org/?p=8199
Download article (pdf)
Citation Manager
Publish History
Introduction
Water is the most essential component for all living things. Living things cannot survive without water. It is one of the most essential constituents of the human environments. It is used for many purposes viz. drinking, irrigation, industrial water supply. It is also used for hydro- electric power generation. The quality of ground water varies from one place to another along with the depth of water table .it also changes with seasonal variation and is primarily governed by the extent and composition of dissolved solids present in it.1 Drinking water needs to be protected from pollution and biological contamination. Underground water is clean but it depends upon quality and quantity of materials dispersed and dissolved in it.2 The reason for contamination and pollution of water in the surroundings and in the storage are pesticides, fertilizers, industrial wastes.2 The physico-chemical contaminants that adversely affect the quality of groundwater may be arises from a variety of sources, including land application of agricultural chemicals and organic wastes, infiltration of irrigation water, septic tanks.3 Ground water quality is usually characterized by different physico-chemical characteristics.These parameters varies widely due to the various types of pollution, seasonal fluctuation and groundwater extraction4 Therefore, a continuous monitoring on groundwater becomes essential in order to minimize the groundwater pollution have control on the pollution- caused agents.Materials and Methods
The city of Bangalore lies towards the southeast in the South Indian state of Karnataka. On the northeast of the city is Kolar District, on the northwest is Tumkur District, on the southwest is Mandya District and on the southeast is the state of Tamil Nadu. The geographical location of Bangalore city of India is such that it lies at an altitude of approximately 920 m. Spread over an area of 2190 sq. km, the city stands positioned at 12.97° N 77.56° E. Ground water samples were collected from 6 different sampling point. The samples for the routine analysis of parameters were collected in 500ml polyethylene bottles. The DO samples were collected in 250 ml glass bottles. The samples for determining the BOD were collected in 250 ml dark bottles. pH and conductivity (µ mhos/cm) were determined at the site. The samples were analyzed using standard method, APHA 19955
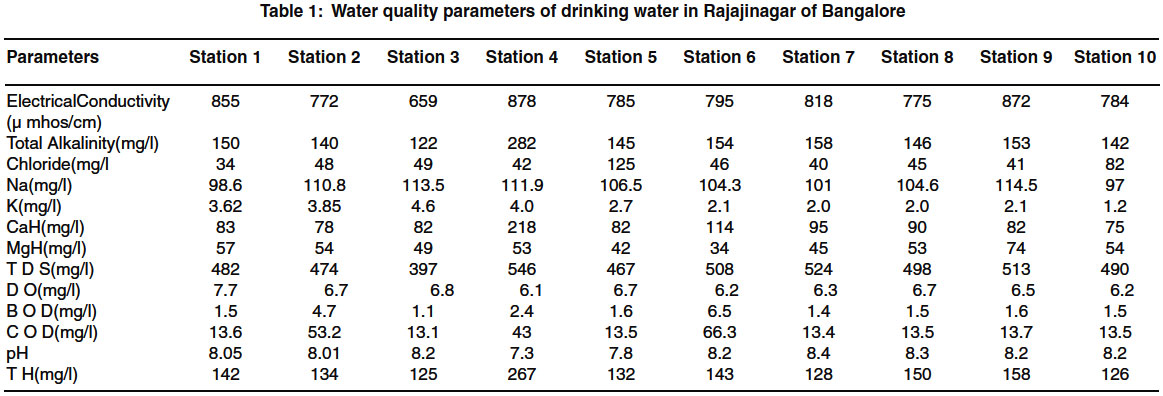 |
Table 1: Water quality parameters of drinking water in Rajajinagar of Bangalore Click here to view figure |
Results and Discussion
The measure of concentration of ionized substances that convey electric current in water is known as electrical conductivity.6 Conductivity is a good indicator to assess groundwater quality. EC were found within the range of 659 to 878 µ mhos/cm. The alkalinity indicates the presence of natural salts in water. The alkalinity is mainly due to the presence of carbonates, bicarbonates and hydroxides. The alkalinity values varied from 122 to 282 mg/l which is well within the limit prescribed by BIS. The chloride found in the range between 34 to 125 mg/l which shows that all the samples is well within the prescribed limit of BIS. Cardiovascular diseases and taxemia in pregnant women 7 is causes due to presence of high concentration of sodium in water. The sodium concentration ranges in between 97 to 114.5 mg/l. Potassium content in the ground water samples varied from 1.2 to 4.6 mg/l. Calcium is a determinant of water hardness because it is found in water as Cu ions. Calcium varies in the ground water from 75 to 218 mg/l. Almost all the samples were within maximum permissible limit as prescribed by the BIS. Magnesium comes up in water from many sources. Magnesium used in chemical in chemical industries to plastic and other materials as a fire protection measure or as filter. It also comes in the environmental from fertilizer application and from cattle feed. The magnesium ranges from 34 to 57 mg/l. TDS is the total concentration of cations and anions. Gastro-intestinal diseases to the human beings are caused by the higher TDS value but the intake of water with the higher TDS for a long period of time can cause kidney stones and heart diseases.8 The TDS value found from 397 to 546 mg/l. The dissolved oxygen (DO) enhances the quality of water and also acceptability. Dissolved oxygen (DO) of water under the area determined in the present investigation ranged between 6.1 to 7.7 mg/l. The BOD values determines the amount of organic waste present in the water.9 The BOD values varied from 1.1 to 6.5 mg/l. The COD values indicates the amount of toxicity in water.10 The COD values ranges from 13.1 to 66.3 mg/l. The pH is the determination of hydrogen ions [H+ ] in water. Water with pH value below 7 is called acidic and water with a pH value above 7 is called basic in nature.11 The pH ranges between 7.3 to 8.4 which is within prescribed limit as per BIS standard. The property of water which prevents the lather formation with soap is known as hard water which increases the boiling point of water. The hardness of water conveys whether the water can be used for domestic, industrial or agricultural purposes or not? The hardness is caused due to the presence of excess of Ca and Mg salts. The values of hardness of water ranges from 125 to 267 mg/l which is within the prescribed limit as per BIS.
References
- Jain C.K , Bandyopadhyay A.and Bhandra A., J. Ind. Water Resource. Soc., 32(3-4), 8 ( 2012).
- Tambekar D.H. and NewareB.B., Sci. Res. Reporter, 2(3), 229 (2012).
- Pathak H. and Limaye S.N., Pelagia Res. Lib., 3(1),555, (2012).
- Srinivas G. and Nageswarrarao G., Arch. Environ.Sci. 7, 1 (2013).
- American public health association, American water works association, water environment federation 1995.
- Kumar N. and Sinha D.K., Int. J. Environ. Sci.1, 253 (2010).
- Shah M. C., Shilpkar P.G. and Achrarya P.B., E- J. Chem., 5(3), 435 (2008).
- Garg et. al., Environ. Geol., 58, 1329 (2009).
- Usharani et. al., J. Environ., Sci. and Environ. Mgmt., 14(2), 29 (2010).
- Patil V. T. and Patil P.R., E-J. Chem., 8(1), 53 (2011).
- Trivedi R. K. and Goel P. K., Chemical and Biological Methods for Water Pollution Studies, Environmental Publication, Karad, India, 1986


