Assessment of Phenolic Compounds in the Surface Waters of Godavari Canal, Andhra Pradesh, India
P. Kiran Kumar1 * and M. Mahaboob Pacha2
http://dx.doi.org/10.12944/CWE.10.1.43
Copy the following to cite this article:
Kumar P. K, Pacha M. M. Assessment of Phenolic Compounds in the Surface Waters of Godavari Canal, Andhra Pradesh, India. Curr World Environ 2015;10(1) DOI:http://dx.doi.org/10.12944/CWE.10.1.43
Copy the following to cite this URL:
Kumar P. K, Pacha M. M. Assessment of Phenolic Compounds in the Surface Waters of Godavari Canal, Andhra Pradesh, India. Curr World Environ 2015;10(1). Available from: http://www.cwejournal.org/?p=8170
Download article (pdf) Citation Manager Publish History
Phenolic compounds are ubiquitous in environment. Many of them are found in nature and found to be responsible for colour of many flowers and fruits.1 They are undegradable organic materials and pollute the natural ecosystem. They can arise from natural substance degradation, industrial activity and agricultural practices. They are found in wastes of synthetic resin, plastics, rubber-proofing, dye manufacturing and many chemicals.2 They are found to be toxic and persistent. They are proved to have bioaccumulation effects in animal and vegetable organisms and may be dangerous for human health.3 There are several anthropogenic sources for phenolic compounds in the environment. The presence of phenolic compounds in aquatic environment may be due to human and animal metabolism, industrial activities and agricultural practices.4 Polyphenolic macro molecules are also present in some species of marine algae, including green macro algae and red macro algae.5 Low levels of phenol are found in some foods (smoked summer sausage, fried chicken, some species of fish, cheese) and in tobacco smoke. Phenolic compounds in water environment may have a natural, industrial, domestic or agricultural origin. In agricultural practice, phenolic compounds are employed as herbicides, insecticides or can derive from degradation of the chlorophenoxycarboxylic herbicides and organ phosphorous insecticides.6 Phenolic compounds can reach the water environment through industrial and domestic waste and through treated sewage discharges. Once in water reservoir, phenols may undergo destruction and transformation by the impact of different physico-chemical factors and by the activity of aqueous organisms like fungi, algae, saprophytes.7 The presence of phenols in a stream is undesired because of their strong action, persistence and their toxicity to invertebrates.8 A number of analytical methods are reported for the determination of phenols, based on spectrophotometric, fluorimetric, kinetic, gas chromatographic, liquid chromatographic and enzyme and biosensors. Due to several characteristic features such as high sensitivity, operational facility and low cost the UV-visible spectroscopy is one of the most useful analytical techniques.9 In the recent years, many papers have been devoted to the occurrence of phenols and phenolic compounds in surface waters of canals.10-11 However, there is paucity of data about their concentration levels in surface waters of canals in India. Hence present study was carried out to investigate the concentrations of phenolic compounds in Godavari canal. In the present study surface water samples were collected for a period of four months period at ten day intervals and the levels of phenolic compounds (in mg/lit) were determined using molecular spectrophotometry method prescribed by American Public Health Association (APHA).12
Materials and Methods
Fifteen sampling stations were chosen based on human activity to collect the surface water samples from the canal as shown in Figure 1. The geographical location of the sampling sites is presented in Table 1.
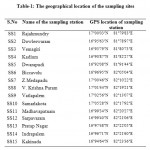 |
Table 1: The geographical location |
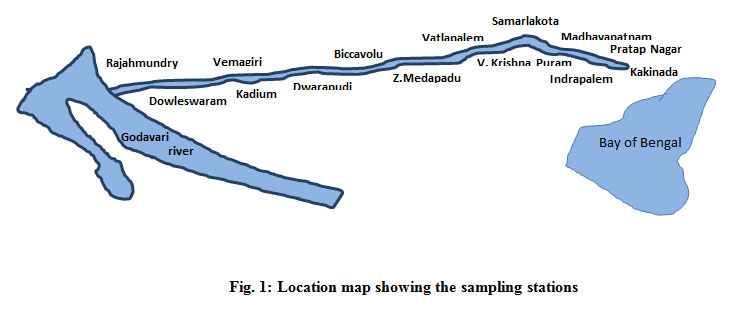 |
Figure 1: Location map showing the sampling stations Click here to View figure |
Grab sampling method was employed to collect the samples randomly from all the fifteen stations. The sampling was carried out over a period of four months at ten day intervals to give a total number of 180 samples. The samples were collected and conserved as reported in the literature. The samples were collected in 1 litre amber glass bottles and acidified with 4 ml of concentrated sulphuric acid and were kept cool during transportation and then stored at 4°C, until analysed. The samples were stored not more than 24 hours in the refrigerator. Most of the samples were analysed within a few hours after they were brought to the lab. The analytical procedure recommended by APHA (American Public Health Association) was used to determine the concentration of phenolic compounds.12 The levels of phenolic compounds (in mg/lit) were determined using molecular spectrophotometry after distillation, complexation with 4-aminoantipyrine and extraction into chloroform. The phenolic compounds react with 4-aminoantipyrine in the presence of potassium ferricyanide at a pH of 10 to form a stable reddish-brown antipyrine dye. The amount of colour produced is a function of the concentration of phenolic compounds. JASCO V-450 spectrophotometer was used to carry out the spectrophotometric studies.
Results and Discussion
The mean concentrations of phenols in four different months are presented in Table 2
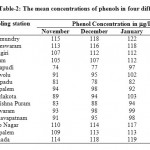 |
Table 2: The mean concentrations of phenols in four different months Click here to View table |
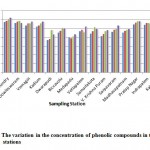 |
Figure 2: The variation in the concentration of phenolic compounds in the sampling stations Click here to View figure |
The variation in the concentration of phenolic compounds in the sampling stations during the four month period is shown in Figure 2. The levels of phenolic compounds were found to be in the range of 80-179 mg/lit in the sampling stations. Higher levels of phenolic compounds (in the range of 110-179 mg/lit) were reported in seven sampling stations, sampling stations 1 to 4, sampling station 13, sampling station 14 and sampling station-15. The higher levels of phenolic compounds in these stations may be attributed to more urbanized activities and agricultural activities near these stations. In these sampling stations the density of population was found to be high. The phenol concentrations in all the sampling locations were well within the permissible limits prescribed by the Central Pollution Control Board (CPCB) of India. Statistical analysis showed that there is a strong correlation between concentrations of phenolic compounds determined in the months of November and December (r = 0.99), November and January (r = 0.90). November and February (r = 0.95). A strong correlation was also observed in the months of December and January (r = 0.91), December and February (r = 0.96) and January and February (r = 0.88). T-test was carried out to determine the significant difference in the concentrations of phenolic compounds in different months. There is a significant difference in the concentrations of phenolic compounds in the month of November with respect to January (at p = 0.05) and November with respect to February (at p < 0.05).
Conclusion
The APHA recommended molecular spectrophotometric method for determination of phenolic compounds in surface waters of Godavari canal was used. The study shows that the surface waters of Godavari canal were polluted with phenolic compounds mainly due to rapid urbanisation and anthropogenic activities. Even though the levels of phenolic compounds were lower than permissible limits prescribed by Central Pollution Control Board of India, continuous monitoring is required due to the fact that continuous emissions of phenolic compounds in surface waters results in their deposition and their increase in soil sediment. Due to the lack of previous data on the levels of phenolic compounds in surface waters of Godavari canal, the results of the present study could not be compared and correlated to determine the extent of contamination of the surface waters of the canal in the past. However the data in the present study may serve as a reference in the future since regular monitoring of phenolic compounds is essential due to their toxicity and bioaccumulation effects in animal and vegetable organisms.
References
- Companella L, T-Beone, Sammartino, M.P and Tomassetti T., Analyst, 118, 979(1993)
- Wallace J.C, Basu I and Hites R.A., Environ. Sci. Technol., 30, 2730-2734(1996)
- Bruce R.M, Santodonato J. and Neal M.W., Toxicol. Ind. Health., 3, 535-568(1987)
- Brodzinsky R. and Singh H.B. (1983): Volatile organic chemicals in the atmosphere: an assessment of available data (Final Report Sep 80- Dec 82). Report EPA 600/3-83- 027A Environmental Science Research Laboratory, NTIS PB 83-195503
- Van Heemst J. D. H, Peulve A. S, de Leeuw J. W, Sicre M. A. and Saliot A. Algal poly- phenolic resistant macromolecules in marine dissolved and particulate organic matter. In 17th International Meeting on Organic Geochemistry, San Sebastion. 1995.
- Lacorte S. and Barcelo D., Environ.Sci. Technol. 28, 1159-1163 (1994)
- Mohn W. W. and Tiedje J. M., Microbiol. Rev. 56, 482-507 (1992)
- Michalowicz J and Duda W., Polish J. of Environ. Stud., 16, 347-362(2007)
- De Souza K.V and Peralta-Zamora., An. Acad. Bras. Cienc., 73(4), 519-524(2001)
- Davi M.L. and Gnudi F., Water Research.,33, 3213-3219(1999)
- Michael K.S, George A.S, Aristidis N.A and Themistoclis A.K., Inern.J.Environ. Anal.Chem., 78(3-4), 353-365 (2000)
- APHA - Standard methods for the examination of waters and waste waters (1998)


