Change in Fishing Patterns in Jammu and Kashmir Provinces of J and K-A Comparative Study
Imtiyaz Qayoom1 * , Masood ul1 and Bilal Ahamad Bhat1
1
Faculty of Fisheries,
Sher-e-Kashmir,
University of Agricultural Sciences and Technology of Kashmir,
Rangil Ganderbal,
190000
Jammu and kashmir
India
http://dx.doi.org/10.12944/CWE.10.1.20
Copy the following to cite this article:
Qayoom I, Balkhi M. H, Bhat B. A. Change in Fishing Patterns in Jammu and Kashmir Provinces of J and K – A Comparative Study. Curr World Environ 2015;10(1) DOI:http://dx.doi.org/10.12944/CWE.10.1.20
Copy the following to cite this URL:
Qayoom I, Balkhi M. H, Bhat B. A. Change in Fishing Patterns in Jammu and Kashmir Provinces of J and K – A Comparative Study. Curr World Environ 2015;10(1). Available from: http://www.cwejournal.org/?p=8678
Download article (pdf) Citation Manager Publish History
Jammu and Kashmir is known as a tourist destination due to its munificence of blossoms and magnanimity of resorts, the state is holding huge water spread area of 57000 hectares approximately out of which about 24000 hectares are in the shape of lakes, marshy areas and reservoirs and 23000 hectares in the shape of river systems (Anayat and Arjamand 2013). These water bodies are home to various freshwater organisms of plant and animal origin serving congenial habitats for their well being. Temperate and tropical zones of the state offer a potential resource for the development of cold & warm water fisheries including Trouts, Schizothoracines, Indian major carps and Chinese carps. The Fisheries Development Programme was launched with the object of increasing the fish production by establishment and up gradation of fish farms, hatcheries, popularisation of fish farming in private sector, imparting training to fish farmers and creating infrastructure for marketing of fish (Wagay, 2012) Moreover, under the Centrally Sponsored Scheme, National Mission for Protein Supplement (NMPS), a new activity has been sanctioned in which cage/pen culture units are to be established in water bodies like reservoirs and lakes with the financial assistance from Government of India. It is due to these efforts that fish production which was 18.46 thousand tonnes in 2000-01, has now reached 20.0 thousand tonnes in 2013-14 (J&K Fisheries Department). While as that of famous trout has touched 262.00 tonnes during 2013-14. Among the ten districts of Kashmir valley, Baramulla leads in the fish production (42770.40 quintals) followed by district Bandipora which contributes about 34970.60 quintals of total fish production of the valley (Report by department of Fisheries J&K). From Jammu province, district Jammu leads in fish production (6657.90 quintals) followed by Kathua and Udhampur districts that contribute 4481.70 and 4195.00 quintals respectively. Therefore the study was undertaken to forecast the fish production on the basis of data collected from 1956 –57 and best fitted statistical models applied on it to assess whether the modern technologies implied the field will continue to enhance the production of fishes in these regions in future.
Material and Methods
The work has been carried out on secondary data. Main sources of data collection include Year books; Statistical Digest, audit reports, research papers and data available on the website of Department of State Fisheries Jammu and Kashmir. The data consisted of the annual production of three different fish species viz. Trout (Oncorhynchus mykiss), Mirror carp (Cyprinus carpio specularis) and Country fish (Schizothoracine species) from Kashmir province and various fishes from Jammu region collectively named as Jammu fish. Various statistical models were applied in order to predict the future production of fishes in the state. The Compound Growth Rates were estimated using the following equation:
Log Y = log a + t log b ….… (1)
Where Y = Fish Production t = time trend, denoting years Compound growth rate in percent = {antilog of (log b) – 1}*100 Equation (1) was fitted to the given data using “Least Square Method” and “Goodness of Fit” is assessed by the coefficient of determination R square. Besides assessing a comparative growth performance of different species of Kashmir, a prediction of the future production was also made on the basis of prediction models and related to the demand of protein in the province.
Results
Results obtained from the present study showed an increase in the trend of fish production of both the regions with compound growth rate of 7.2% in Jammu while as in Kashmir province was found 4.2 % only. The annual percentage increase in growth of fish production in Jammu and Kashmir is given in the Table 1.
Table: 1. Annual Percentage Increase in Growth Rate of Fish Production.
| KASHMIR PROVINCE | JAMMU PROVINCE | ||||||
| S. No | Year | Trout | Mirror Carp | Country Fish | Total | Jammu Fish | Total State |
| 1 | 1957 | 12 | 2207 | 4138 | 6357 | 839 | 7196 |
| 2 | 1967 | 44 | 33741 | 11403 | 45188 | 2366 | 47554 |
| (266.67) | (1428.88) | (175.57) | (610.84) | (182.00) | (560.84) | ||
| 3 | 1977 | 81 | 46112 | 21904 | 68097 | 2210 | 70307 |
| (84.09) | (36.66) | (92.09) | (50.69) | (- 6.59) | (47.85) | ||
| 4 | 1987 | 154 | 71060 | 32560 | 103774 | 5340 | 109114 |
| (0.009) | (0.005) | (0.004) | (0.005) | (0.014) | (0.005) | ||
| 5 | 1997 | 248 | 112021 | 40588 | 152857 | 22944 | 175801 |
| (61.039) | (57.64) | (24.66) | (47.298) | (329.663) | (61.117) | ||
| 6 | 2007 | 1520 | 116835 | 43028 | 161383 | 30617 | 192000 |
| (512.90) | (4.297) | (6.012) | (5.578) | (33.44) | (9.21) | ||
| 7 | 2013 | 2600 | 78508 | 38150 | 118668 | 28332 | 199500 |
| (71.053) | (-32.804) | (-11.34) | (-26.47) | (-7.46) | (3.91) | ||
Forecasts showed cubic model to be the best fitted model for all fish species in both the provinces. The R2 calculated by least square method was found 0.946 for overall fish production of Kashmir valley (Table 2).
Table 2: Model Summary and Parameter Estimates of Total Fish Production of Kashmir
| Equation | Model Summary | Parameter Estimates | |||||||
| R2 | F | df1 | df2 | Sig. | Constant | b1 | b2 | b3 | |
| Linear | .851 | 256.137 | 1 | 45 | .000 | 3.314E4 | 3.142E3 | ||
| Logarithmic | .861 | 279.547 | 1 | 45 | .000 | -3.405E4 | 4.899E4 | ||
| Inverse | .449 | 36.677 | 1 | 45 | .000 | 1.268E5 | -1.934E5 | ||
| Quadratic | .930 | 292.566 | 2 | 44 | .000 | 2.079E3 | 6.945E3 | -79.226 | |
| Cubic | .946 | 250.353 | 3 | 43 | .000 | 1.953E4 | 2.798E3 | 134.514 | -2.969 |
| Compound | .651 | 83.944 | 1 | 45 | .000 | 3.484E4 | 1.042 | ||
| Power | .916 | 489.434 | 1 | 45 | .000 | 1.047E4 | .749 | ||
| S | .799 | 179.089 | 1 | 45 | .000 | 11.798 | -3.826 | ||
| Growth | .651 | 83.944 | 1 | 45 | .000 | 10.459 | .041 | ||
| Exponential | .651 | 83.944 | 1 | 45 | .000 | 3.484E4 | .041 | ||
| Logistic | .651 | 83.944 | 1 | 45 | .000 | 2.870E-5 | .960 | ||
Table 3: Model Summary and Parameter Estimates Total Production of Jammu
| Equation | Model Summary | Parameter Estimates | |||||||
| R2 | F | df1 | df2 | Sig. | Constant | b1 | b2 | b3 | |
| Linear | .828 | 217.169 | 1 | 45 | .000 | -4.830E3 | 823.113 | ||
| Logarithmic | .570 | 59.652 | 1 | 45 | .000 | -1.587E4 | 1.058E4 | ||
| Inverse | .181 | 9.923 | 1 | 45 | .003 | 1.800E4 | -3.257E4 | ||
| Quadratic | .850 | 124.542 | 2 | 44 | .000 | -540.658 | 297.912 | 10.942 | |
| Cubic | .901 | 130.143 | 3 | 43 | .000 | 7.782E3 | -1.679E3 | 112.847 | -1.415 |
| Compound | .773 | 153.114 | 1 | 45 | .000 | 1.391E3 | 1.079 | ||
| Power | .651 | 84.066 | 1 | 45 | .000 | 368.927 | 1.085 | ||
| S | .300 | 19.311 | 1 | 45 | .000 | 9.449 | -4.028 | ||
| Growth | .773 | 153.114 | 1 | 45 | .000 | 7.238 | .076 | ||
| Exponential | .773 | 153.114 | 1 | 45 | .000 | 1.391E3 | .076 | ||
| Logistic | .773 | 153.114 | 1 | 45 | .000 | .001 | .927 | ||
Table 4: Model Summary and Parameter Estimates Dependent Variable of Jammu & Kashmir
| Equation | Model Summary | Parameter Estimates | |||||||
| R2 | F | df1 | df2 | Sig. | Constant | b1 | b2 | b3 | |
| Linear | .888 | 356.671 | 1 | 45 | .000 | 2.831E4 | 3.965E3 | ||
| Logarithmic | .835 | 227.467 | 1 | 45 | .000 | -4.991E4 | 5.957E4 | ||
| Inverse | .402 | 30.234 | 1 | 45 | .000 | 1.448E5 | -2.260E5 | ||
| Quadratic | .927 | 278.035 | 2 | 44 | .000 | 1.547E3 | 7.242E3 | -68.277 | |
| Cubic | .949 | 268.012 | 3 | 43 | .000 | 2.732E4 | 1.119E3 | 247.303 | -4.383 |
| Compound | .713 | 112.058 | 1 | 45 | .000 | 3.611E4 | 1.045 | ||
| Power | .936 | 661.805 | 1 | 45 | .000 | 1.071E4 | .780 | ||
| S | .766 | 147.506 | 1 | 45 | .000 | 11.914 | -3.859 | ||
| Growth | .713 | 112.058 | 1 | 45 | .000 | 10.494 | .044 | ||
| Exponential | .713 | 112.058 | 1 | 45 | .000 | 3.611E4 | .044 | ||
| Logistic | .713 | 112.058 | 1 | 45 | .000 | 2.769E-5 | .957 | ||
Table: 5 Forecast of Fish Production in Jammu and Kashmir Provinces
| Year | Trout | Mirror carp | Country fish | Total production of Kashmir | Jammu Fish | Total production of the state |
| 2014 – 15 | 2295.20 | 111118 | 40170.1 | 152896 | 38968.8 | 191865 |
| 2015 – 16 | 2441.32 | 110739 | 39779.2 | 152156 | 40328.0 | 192484 |
| 2016 – 17 | 2591.77 | 110247 | 39344.2 | 151257 | 41709.2 | 192967 |
| 2017 – 18 | 109643 | 109643 | 109643 | 150200 | 43112.2 | 193313 |
| 2019 – 20 | 2746.56 | 108927 | 38865.0 | 148985 | 44537.1 | 193523 |
| 2020 – 21 | 3069.14 | 108098 | 37774.0 | 147611 | 45983.9 | 193596 |
| 2021 – 22 | 3236.94 | 107156 | 37162.3 | 146079 | 47452.6 | 193533 |
| 2022 – 23 | 3409.07 | 106102 | 36506.3 | 144388 | 48943.1 | 193333 |
| 2023 – 24 | 3585.54 | 104935 | 35806.2 | 142539 | 50455.6 | 192996 |
| 2024 - 25 | 3766.34 | 103655 | 35061.8 | 140531 | 51989.9 | 192523 |
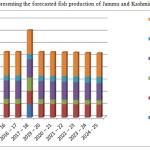 |
Figure 1: Graph Representing the Forecasted Fish Production of Jammu and Kashmir provinces Click here to View figure |
Discussion
Total fish production of the state does not show an appreciable increase in the coming decade, despite the annual fish production data depicts increase in quantum fish production every year. Future production models showing a feeble increase in the production of trout (Table 5) may be attributed to various intensive trout culture and rearing units operating mostly under governmental supervision valley wide. Decline in the production of country fish (Schizothoracines) is attributed to its sensitive response to polluting environments unlike the mirror carps which have ability to withstand adverse environmental conditions (Table 5).
On the other hand the Jammu fish which mainly comprise of hardy fishes like Indian major carps and exotic carps have ability to grow in natural as well as in captive habitats. It is the reason that statistical models reflect increase in fish production in future. The results obtained showed that there is a continuous growth in fish production. On the basis of fitted models we present the forecasts of fish production as shown in Table 6. Kashmir valley has reached population of 6.907623 million (Bureau of census, India, 2013). The recommended intake of fish per capita for people of India is 13 kg (Manual of Fishery Statistics, Govt. of India 2011). It implies that we need 89.7million kg of fish in the state to ensure the eradication of protein deficiency against 161248 quintals (Fisheries department J & K) of fish presently got from both capture and culture practices. In other words, there is a huge gap between the demand and supply of fish. The 27781 Km. length of Rivers / streams facilitates farming of more than 40 million tonnes of fish.
Unscientific cultural practices, less availability of technical staff and non utilization of water resources up to their full potential might be the prime causes for the dwindling development of the sector in the valley. Moreover, when predicting the future development of fisheries sector and fish production, the graph doesn’t show sharp increase as shown up till now. In other words we will not be able to increase our fish production up to the level to meet the demand of protein. This might be due to the non implementation of scientific methodology, less availability of the technical staff, lack of funds and oblivion to the technical know how in the field (Qayoom et al,. 2014). Hence the compendia for the same demands the adoption of scientific methods in both capture and culture fisheries to meet the protein demand and reduce malnutrition.
References
- Annual Reports published by the Department of Fisheries J&K State. Digest J&K 2006 – 07.
- Manual of Fishery statistics. 2011. Government of India, Ministry of Statistics and Programme Implementation New Delhi.
- Noor-ul Hassan and D. N. Pandey 2012. Present status of trout fisheries in Jammu and Kashmir. IOSR Journal of Pharmacy.2(5):35-37.
- Qayoom, I., Wali, A., Balkhi, M. H. and Bhat, B.A. 2014. Utilization of Water Resources and Fishing Patterns in Kashmir Valley – A Case Study. Journal of Chemical, Biological and Physical Sciences. 4(2):1233-1239.
- Wagay, Yaseen, Mohammad. 2012. “Economics of fisheries in Jammu and Kashmir: A case study of district Anantnag”. M.Phill Thesis. P.G. Department of Economics, University of Kashmir, Srinagar. Websites http://jkfisheries.in/top_table.htm. http://jkfisheries.in/achievements.htm


