Depreciation in Ambient Air Quality in Iron Ore Mining Region of Goa
Gurdeep Singh1 and Atahar Perwez1 *
1
Department of Environmental Science and Engineering,
Indian School of Mines,
Dhanbad,
826004
India
http://dx.doi.org/10.12944/CWE.10.1.17
Copy the following to cite this article:
Singh G, Perwez A. Depreciation in Ambient Air Quality in Iron Ore Mining Region of Goa. Curr World Environ 2015;10(1) DOI:http://dx.doi.org/10.12944/CWE.10.1.17
Copy the following to cite this URL:
Singh G, Perwez A. Depreciation in Ambient Air Quality in Iron Ore Mining Region of Goa. Curr World Environ 2015;10(1). Available from: http://www.cwejournal.org/?p=8272
Download article (pdf)
Citation Manager
Publish History
Iron ore mining is a major economic activity of Goa and it has evolved the economy of the State. Mining and quarrying contributed about 20.4 % of the GDP (gross domestic product) to the state’s economy.1 Mining activities, whether small or large, are inherently disruptive to the environment. The environmental deterioration caused by mining activities occurs mainly as a result of inappropriate and wasteful working practices. The magnitude of impact on air quality depends upon the types of mineral being mined, methods, scale and concentration of mining activities, and the geological and geomorphological setting. Mining in Goa is now highly mechanized employing the open-cast method.2 Open-cast mining is more deteriorating to air quality than underground mining. Over the past few years, with the introduction of mechanized mining techniques and heavy earth moving equipment, this problem has been further aggravated.3,4 Major sources of atmospheric emissions from open-cast mining activity include land clearing, removal of overburden, and vehicular movement on the haul roads, excavation, loading and unloading of ore materials as well as overburden. Dust emanating from the haul roads contributes considerably to the particulate matter content in the atmosphere. Air pollution related problems have resulted in an increased public awareness of the air quality in both developing and developed countries.5 Therefore, air quality monitoring and assessment are required to prevent and minimize the deterioration of air quality due to mining and other anthropogenic activities. The existing evaluation and assessment of air quality in India is based entirely on the compliance of measured concentration levels of pollutants with the National Ambient Air Quality Standards (NAAQS).6 This approach is useful up to some extent to maintain the desired quality of the ambient atmosphere, but it cannot truly map the deterioration of air quality when the concentration of pollutants remains below the NAAQS, because NAAQS provides an upper threshold concentration in the form of standards, and the air quality is designated accordingly based on the standards. The concentration level of pollutants found below the NAAQS are falsely interpreted as fair and acceptable air quality, but sometimes the concentrations are sufficiently high to pose serious environmental and health problems. Dee et al., also observed that in many cases these standards are represented as the upper concentration limits or maximum ranges for selected parameters that will be acceptable to maintain some desired quality.7 More precisely, the use of standards is important in administrating and enforcing a desired policy, but they are not a complete tool for evaluating the environmental quality.6 The need to quantify air quality and follow the evolution of pollution has led to a large amount of Air Quality Indices, giving an idea of the state of pollution in a day.8 Air Quality Indices are also of specific significance because; air pollution monitoring data are generally complex and not understandable to the general public. The large data often do not convey the air quality status to the scientific community, policy makers and the general public in a simple and straightforward manner. This problem can be addressed by determining the Air Quality Index (AQI) of a given area using environmental synthetic indices to summarize complex situations in a single ï¬gure, allowing for comparisons in time and in space.9 Plaia and Ruggieri, defined AQIs as a simple and understandable way to measure the air quality with respect to its effects on human health.10 A number of air quality indices have been formulated.11,12 Most of the indices take NAAQS as the base for devising the scale. There are other systems, which are independent of the NAAQS and based on the measurement of air quality (with due weightage to the potential of pollutants to affect biophysical, health and aesthetic attributes) on an absolute environmental quality scale and not in relation to NAAQS.13 Considering the disadvantages of the existing methods of ambient air quality assessment, the present paper attempts to follow an air quality depreciation index that measures deterioration in air quality (with due weightage to the potential of pollutants to affect bio-physical, health and aesthetic attributes) on an 'absolute' environmental quality scale independent of NAAQS.6 The index is determined on the basis of value function curves to assess the air quality. This approach is conceptually similar to the environmental evaluation system developed by Dee et al., for assessing environmental impacts related to water resources.7 Sharma et al., Singh and Roy et al., have also used this concept for determining the air quality status of Raniganj Coalï¬elds (India), coal mining areas of Korba Industrial belt of Chhattisgarh, (India) and a case study from the Coal-fields of eastern India, respectively.14,6,13
Materials and Methods Study Area
Goa is a relatively small state which lies between the latitudes 14°53'54" N & 15°40'00" N and longitudes 73°40'33" E & 74°20'13" E with geographical area of 3,702 km2 and a coastline of 105 km. The average wind speed recorded during the period of study (January 2011 to December 2012) was 0.64 m/s of which 0.5 – 2.1 m/s were observed in 78.7 % of the recorded data and calm conditions prevailed in 21.03 %. The prevailing wind direction accounting for maximum length of time was west. The maximum temperature recorded during the study period was found 30°C while the minimum temperature was 11°C. The average relative humidity was found to be in the range of 35% to 97%. The study area comprising a geographical area of 1513 km2 (situated between 15°16’ to 15°38’N and 73°50’ to 74°17’E) had been selected in order to provide more focus on the key theme of regional impacts of mining and ancillary infrastructures on the pristine environmental setting. The study area encompasses mining and associated activities confined to active mining leases and additional 5 Km around the core mining activities. Map of the study area along with ambient air quality monitoring locations is depicted in Figure 1.
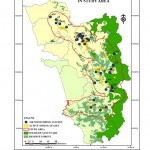 |
Figure 1: Ambient air quality monitoring |
Sampling and Analysis
Systematic ambient air quality monitoring was carried out to obtain an overall picture about air quality parameters in this region using Fine Particulate Samplers (Envirotech-Model APM 550 MFC) and Respirable Dust Samplers (Envirotech- Model APM 460). 24-hourly ambient air samples were collected during post-monsoon, winter and summer seasons for SPM, PM10, SO2 and NOX as the monitoring and analysis criteria provided. For the purpose of ambient air quality monitoring of these criteria pollutants, thirty four (34) representative ambient air quality stations was selected as per selection criteria provided in IS: 5182 Part XIV.15 Of the 34 stations, 8 stations are selected in mines, 12 in buffer zone around core mining activity and remaining 14 in ore transportation routes in order to emphasize and characterize the sources responsible for criteria pollutants. The details of monitoring locations are represented in Table 1 with their respective coordinates.
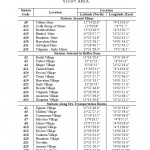 |
Table 1: Ambient Air Quality (Aaq) Monitoring Stations In The Study Area Click here to View table |
Results and Discussion
To assess the air quality status of the study area, the CPCB guidelines for sampling and measurement of ambient air quality parameters were followed. For PM10, SO2 and NOX, NAAQS, 2009 Standards and for SPM, NAAQS, 1994 Standards were followed. The NAAQS for SPM, PM10, SO2 and NOX is depicted in Table 2. The concentration levels of SPM, PM10, SO2 and NOX in the iron ore mining region of Goa are presented in Table 3 and Figure 2, 3, 4 and 5, respectively. The spatial distribution of Concentration Levels of SPM, PM10, SO2 and NOX in the study area is presented in Figure 6.
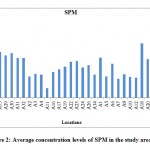 |
Figure 2: Average concentration levels of SPM in the study area Click here to View figure |
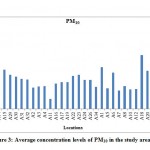 |
Figure 3: Average concentration levels of PM10 in the study area Click here to View figure |
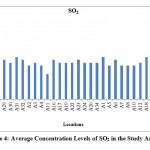 |
Figure 4: Average Concentration Levels of SO2 in the Study Area Click here to View figure |
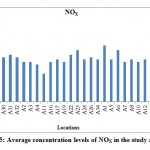 |
Figure 5: Average concentration levels of NOX in the study area Click here to View figure |
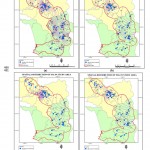 |
Figure 6: Spatial distribution of annual average (a)SPM, (b) PM10,(c)SO2 and (d)NOX concentration levels in the study area Click here to View figure |
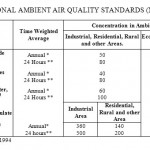 |
Table 2: National Ambient Air Quality Standards Click here to View table |
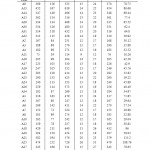 |
Table 3: Ambient Air Quality Monitoring Results In Iron Ore Mining Region Of Goa Click here to View table |
The monitoring results illustrate that particulate materials are the major pollutants to be concerned in mining areas of Goa as the concentration levels of SPM and PM10 were found exceeding the NAAQS standards. The concentration levels of SO2 and NOX were found below the standard at almost all of the stations. In general, the concentration of particulate matters was found higher in the ore transportation routes followed by mines. This depicts that transportation is the most devastating activity in the iron ore mining region of Goa. The preeminent source of particulate matters in transportation routes are suspensions and resuspension of dust due to aerodynamic pressure, spillage of ore dust from the ore carrying dumpers and wearing of tyres, brake, etc.
Air Quality Depreciation Index
The air quality depreciation index adopted for this study, attempts to measure deterioration in air quality on an arbitrary scale that ranges between 0 and –10. An index value of ‘0’represents most desirable air quality having no depreciation from the best possible air quality with respect to the pollutants under consideration while an index value of –10 represents maximum depreciation or worst air quality. The reduction in index values ranging from 0 to –10 represents the successive depreciation in air quality from the most desirable. The air quality depreciation index is calculated as follows:
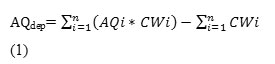
Where, AQdep = Air quality depreciation index AQi = Air quality index value for ith parameter CWi = Composite weight for ith parameter n = Total no. of pollutants considered The values of the AQi were obtained from the value function curves. In the value function curves the value of 0 signifies worst air quality and value of 1 represents the best air quality for corresponding pollutant concentration. Typical value function curves for SPM, SO2, NOX and (TSP x SO2) are given in Figures 7, 8, 9 and 10, respectively. The value of CWi in equation (1) is computed using the following expression:
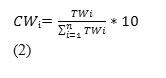
Where, TWi = Total weight of ith parameter TWi = Ai + BPIWi + HWi (3) Where, AWi = Aesthetic weight for it parameter BPIWi = Bio- Physical Impact Weight for ith parameter
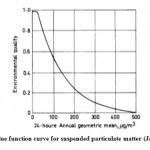 |
Figure 7: Value function curve for suspended particulate matter (Jain et al.) Click here to View figure |
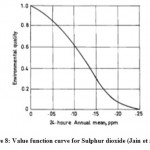 |
Figure 8: Value function curve for Sulphur dioxide (Jain et al.) Click here to View figure |
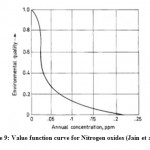 |
Figure 9: Value function curve for Nitrogen oxides (Jain et al.) Click here to View figure |
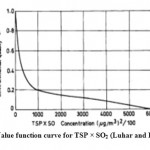 |
Figure 10: Value function curve for TSP × SO2 (Luhar and Khanna) Click here to View figure |
For computing TWi, an importance weight between 1 to 5 is subjectively assigned to AWi, BPIWi and HWi (i.e. for the ith pollutant) by a team of assessors or experts. Least important assignment is 1 and most important marking is 5. The weights are then aggregated in accordance with equations (2) and (3). The assignment and computation of Composite weight for different pollutants are illustrated in Table 4. The values of AQi and AQdep are calculated as per the equation (1) and depicted in Table 5 and Figure 11.
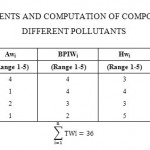 |
Table 4: Assignments And Computation of Composite Weight For Different Pollutants Click here to View table |
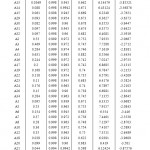 |
Table 5: Value Functions And Aqdep Values For Different Sampling Locations In Iron Ore Mining Region of Goa Click here to View table |
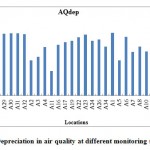 |
Figure 11: Depreciation in air quality at different monitoring stations Click here to View figure |
Air quality depreciation index had been applied to the ambient air monitoring data of the iron ore mining region of Goa as an index that measures depreciation in air quality in more realistic terms. The deterioration of air quality in the iron ore mining region of Goa can be easily assessed from the AQdep values. Depreciation in air quality from the most desired value of 0 is clearly apparent, as AQdep values at all the stations were < -1. Based on the observations of computed AQdep, the air quality ofthe Amona Village (A25) was found most depreciated followed by (A28) Sonshi Village with the depreciation values of 4.35 and 4.099, respectively. The depreciation in the air quality of Tambdi Surla (A11) was found least with an AQdep value of 1.443. The reason of the lowest depreciation of air quality at this site is attributed to its large distance from mines and associated activities, such as ore transportation as well as due to luxurious vegetation in the area. In general, along the ore transportation routes the air quality is found most depreciated followed by mines. The depreciation of air quality in buffer zone was also found considerable, but lower than ore transportation routes and mines. This infers that ore transportation is the most devastating activity in the iron ore mining region of Goa and effective mitigation measure is required with regulatory enforcement to control the deterioration of air quality. Effective mitigation measures are also needed within the mines. This method detects the degree of deterioration in air quality even due to the marginal changes, but the existing approach of ambient air quality assessment, i.e. comparison of measured concentration of pollutants with NAAQS cannot persuasively categorized as unacceptable or objectionable unless the measured concentration exceeded the NAAQS. Till standards are exceeded, there is no indication of deterioration in air quality from what can be considered truly acceptable. It is clearly evident from the measured concentration of pollutants in the study area that, the concentration level of SPM exceeded the NAAQS annual standard at many of the stations and that of PM10 at most of the stations, while the concentration level of SO2 and NOX were found far below the NAAQS at almost all sampling stations. This figure does not provide a meaningful picture about the air quality of the region. This would be significant only when all of the pollutants exceed the NAAQS standard, but this situation is not prevailing in the study area. Hence, simple comparison of the measured concentration value of pollutants with NAAQS may not be a true representation of the overall scenario. Singh (2006) calculated the AQdep index usingNAAQS value for each pollutant and observed a considerably degraded scenario (AQdep = - 6.0320). This gives more credence to the fact that the existing evaluation system may not be the best approach to assess the air quality. The air quality depreciation index is a more articulate approach even to obtain the marginal changes in air quality. The application of depreciation index meaningfully depicts the status of ambient air quality. It provides overall deterioration in air quality from the desired value of 0. The index adopted for this evaluation has superiority over the interpretive evaluations that use a simple comparison of measured concentration of pollutants with National Ambient Air Quality Standards, because the calculation of AQdep index using NAAQS value for each pollutant gives a sufficiently high value indicating a considerably degraded air quality scenario. Hence, the approach of simple comparison of measured concentration of pollutants with NAAQS does not truly serve the purpose of assessment of air quality. In this context, the air quality, depreciation index can be an invaluable tool to map, periodic deterioration in air quality with respect to its potential for environmental damages. The adoption of such an index to monitor air quality in and around the mining clusters will help in assessment and comparison of air quality of different mining areas in India in a much more realistic and meaningful manner. Since the air quality depreciation index is not constrained for the type or number of pollutants and is not geographically specific, it can be easily used for different situations, locations and applications.
Conclusions
Air quality depreciation index was adopted for this study to assess the ambient air quality of the iron ore mining region of Goa. The deterioration in air quality in this region is clearly apparent, as the AQdep values at all the monitoring locations were observed < -1. In general, along ore transportation routes, the air quality is found most depreciated followed by mines. High depreciation along the transportation routes illustrates that transportation is the most devastating activity to the air environment. Based on the observations, the study portrays the need for effective management plans to mitigate the pollution load along the transportation routes as well as within and around the mines. Strict enforcement of the limit on load as well as vehicle speed might be a pertinent solution to reduce the particulate emission along the transportation routes. During the busy hours the transportation of ores should be prohibited.
Acknowledgement
The authors are thankful to the Ministry of Environment and Forests, Government of India for providing ï¬nancial support and Indian School of Mines, Dhanbad for the valuable support during the study. One of the authors is also thankful to the Ministry of Human Resource Development for providing financial support.
References
- Economic Survey, Directorate of Planning, Statistics & Evaluation. Government of Goa, Panaji. Goa, (2012-13).
- TERI, Area wide environmental quality management (AEQM) plan for the mining belt of Goa, Directorate of Planning statistics and Evaluation - Government of Goa, Goa (1997).
- Singh G., Sharma P. K., Ambient air quality status in certain coal mining areas of Raniganj coalfield, Energy Environment Monitor., 7 (2) 56-65 (1991).
- Sharma P. K., Singh G., Distribution of suspended particulate matter with trace element composition and apportionment of possible sources in the Raniganj Coalfields, India, Env. Monit. Asses., 22, 237-244 (1992).
- Kurt A., Oktay A.B., Forecasting air pollutant indicator levels with geographic models 3 days in advance using neural networks, Expert Syst Appl., 37 (79) 86–92 (2010).
- Singh G., An index to measure depreciation in air quality in some coal mining areas of Korba industrial belt of Chhattisgarh, India, Env. Monit. Asses., 122, 309-317 (2006).
- Dee N., Baker J., et al., An Environmental evaluation system for water resource planning, Water Resources Research, 9 (3) 523- 535 (1973).
- Shooter D., Brimblecombe P., Air quality indexing, International Journal of Environment Pollution, 36, 305-323 (2009).
- Bruno F., Cocchi D., Recovering information from synthetic air quality indices, Environmental Geology, 18, 345–359 (2007).
- Plaia A., Ruggieri M., Air quality indices: a review, Reviews in Environmental Science and Bio/Technology, 10, 165–179 (2011).
- Babcock L.R., A combined index for measurement of air pollution, J. Air Pollu. Control Assoc, 20 (10) 653-659 (1970).
- Paolo F. R., A comparison of air quality indices for 26 Canadian cities, J. Air Pollu. Control Assoc., 29 (12) 1242-1243 (1979).
- Roy P., Singh G., Pal A. K., Air quality depreciation index in a coal mining area- a case study from eastern India, Journal of American Science, 6 (5) 107-114 (2010).
- Sharma P.K., Rathore C., Singh G., An index to measure depreciation in air quality in some areas of Raniganj coal-fields, India. Asian Environment, 1991, 13(12) 11–19.
- IS 5182 (Part 14): Methods for Measurement of Air Pollution, Part 14: Guidelines for Planning the Sampling of Atmosphere (Second Revision) (2000).
- CPCB, National Ambient Air Quality Standards (2009), (CPCB) Notification. New Delhi, 18th November, 2009.
- Jain, R. K., Urban, L. V., Stacey G. S., Environmental Impact analysis. Van Nustrand Reinhold, N.Y., 170-187 (1977).
- Luhar A. K., Khanna P., Computer aided rapid environmental impact assessment, Env. Impact Assess Rev., 8, 9-25 (1988).


