Economic Evaluation of Different Size of Biogas Plants in Chhattisgarh (India)
Kumar Shailendra1 * , Mishra B. P2 , Khardiwar M. S1 , Patel S. K1 and Sayyad F. G1
1
Anand Agricultural University,
Dahod,
389151
Gujarat
India
2
Department of Farm Machinery and Power,
IGKV,
Raipur,
Chhattisgarh
India
http://dx.doi.org/10.12944/CWE.10.1.21
Copy the following to cite this article:
Shailendra K, Mishra B. P, Khardiwar M. S, Patel S. K, Sayyad F. G. Economic Evaluation of Different Size of Biogas Plants in Chhattisgarh (India). Curr World Environ 2015;10(1) DOI:http://dx.doi.org/10.12944/CWE.10.1.21
Copy the following to cite this URL:
Shailendra K, Mishra B. P, Khardiwar M. S, Patel S. K, Sayyad F. G. Economic Evaluation of Different Size of Biogas Plants in Chhattisgarh (India). Curr World Environ 2015;10(1). Available from: http://www.cwejournal.org/?p=8563
Download article (pdf) Citation Manager Publish History
The world today is seized with the problem of energy supply, shortage of cheap and efficient fuel resources, shortage of many other usable commodities and growing environmental problem. Fast depletion of fuels particularly oil, mass-scale of deforestation leading to a fuel wood crisis and the population explosion, all combine to emphasize the need for exploiting the unconventional sources of energy which could meet the way to improve the rural economy of the world growing numbers. In C.G. the Installation of biogas plants are carried out by the Chhattisgarh Renewable Energy Development Agency (CREDA) under the Department Of Energy, Government of C.G. from 25th May 2001. Yearly statistically data of C.G. State indicates that the biogas plants are getting popularity among the formers of C.G. (Kumar, et al, 2014) This is supported by the number of units (30376) installed by CREDA during 2001- 2010 and the number is increased about 3000 units per year and on an average more than three thousand (3375) plants are added annually (Kumar S. et.al, 2013). In production of biogas through anaerobic digestion, animal excreta, human excreta and other agricultural wastes are used. The existing as well as future energy demands of the rural areas can be completed by biogas technology. It is the fourth largest source of energy in the world supplying about 13 per cent (55 EJ/Year), which is equivalent to 25 million barrels of primary energy (Mittal, 1997). Cattle dung is the main raw material used for biogas production in India. India has the largest population of livestock of over 300 million which produce about 980 million tones of dung. If the whole quantity of available cattle dung is used for bio-methanation, it could produce about 195 billion kW-h of energy annually (Govil and Gaur, 2000). In some countries, such as Denmark, co-digestion of high-strength organic waste has previously been a prerequisite for economically viable performance of biogas plants but the limited availability of this type of organic waste has created a setback in the establishment of new plants (Raven and Gregersen, 2007). In contrast, other countries, such as Germany, have stimulated the expansion of biogas production to new plants by means of large grants to organizations producing electricity from biogas. Hence, in this field investigation, an economic evolution on 117 biogas plants, covering each district (11) of Chhattisgarh Plains was carried out.
Material and Methods
The study was carried out during 2007-08 in Chhattisgarh (C.G.) plans. A list of villages having Fixed dome type and KVIC type is prepared. The numbers of biogas plants installed in the C. G. plains were 23953 units during 2001-08.Total 117 samples were selected. Out of which, 99 were under working condition and remaining were in non- working conditions. For economical analysis of biogas technology, different capacities of biogas plants under study were taken. Out of total 99 working biogas plants, 62 possessed 2 m3, 8 possessed 3 m3, 13 possessed m3, 14 possessed 6 m3 and 2 possessed 8 m3. To investigate the economics of biogas plant, a questionnaire was prepared. It was aimed at extracting maximum information from farmers by conducting personal interviews with them and data were taken by observing and personal asking with the help of questionnaire at the site of selected plants to the plants owners. For working out economics of biogas technology, data like average installation cost of biogas plants, their average life, average quantity of cow dung feed, quantity of biogas slurry manure and their nutrients value. Fuel value of biogas, junk value, depreciation charge and operational cost were taken and the economics of different capacities of biogas plants was work out by using straight line method. Finally the capacity, model and location wise economics of all biogas plants were worked out and statistically analyze (Shailendra, 2008, Singh, 2002).
Economic Analysis
In the case of biogas plants under study, a detailed economic analysis has been done under following heads Total running cost is calculated by using the formula Total cost = Fixed cost + operational cost Fixed cost is calculated under following heads:
Depreciation
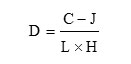
Where, D = Depreciation, Rs / h C = Installation cost including land and material used J = Junk value (10 % of C) L = Average working life of plants (Year), Assumed 20 years as per perception of respondent. As some plants floated drum type found in working condition in district Drug (C.G.) H = Annual working hours of burner (Average gas application time) Interest Interest was calculated by assuming 10 % interest charge annually, by using formula
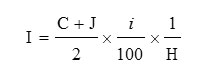 I = Interest, Rs / h i = Interest rate (% annually)
Repair and Maintenance Charge
Repair and maintenance charge was determined through personal interview of owners.
Operational cost
Time was noted in collection of dung, water and other operations. It is assumed that operational charge in term of dung feed rate is 10 kg dung/ Rs. Actual working cost = Fixed cost + Operational cost Plant working cost (Rs / h) = Actual working cost (Rs / h) x Average working time (h / day) Total annual gas production (m3) = Average working hours / year x .467 Total annual Calorific value of biogas (MJ) = Calorific value of biogas per cum (20MJ / m3) x Total annual gas production (m3) Equivalent to LPG (kg) = Total annual Calorific value of biogas (MJ / yr) / Calorific value of LPG (50 MJ / kg) Cylinder number of LPG = Equivalent to LPG (kg) / Weight of gas / cylinder (14.2 kg) Value of gas (Rs / annum) = Number of cylinders x 350 Additional value of N, P and K = (N, P and K in biogas slurry - N, P and K in cow dung manure, kg) x (dung fed / year) x percent solid content Solid contains in cow dung = 18-20 % (Rai, 1997). Additional value of fertilizer (Rs / yr) = Additional value of N, P and K x rate of N, P and K Gross benefit (Rs / yr) = Value of gas (Rs / yr) + Additional value of fertilizer (Rs / yr) Net profit (Rs / yr) = Gross benefit (Rs / yr) – Plant working cost Benefit cost ratio: The use of inputs and outputs of the biogas plants are the measure parameters which affects the B/C ratio. For the present purpose costs and benefits at the individual user’s level an average values as calculated based upon observations of field investigation. Benefit cost ratio = Net profit (Rs / yr) / Plant working cost Theoretical operating cost (Rs / h) is calculated that the performance of biogas plant is hundred per cent.
Results and Discussion Actual Working Cost of Biogas Plants
It is revealed from the Table.1 that the total working cost of the biogas plant is increased from Rs 2.99 to Rs 4.01 Rs / h with the increase in the size of plant from 2 to 8 m3. However, the lowest working cost is found for 3 m3 size (Rs 2.73 / h) followed by 2 m3 (2.99 Rs / h) and 4 m3 (Rs 3.31 Rs / h).
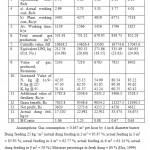 |
Table 1: Capacity Wise Actual Working Costof Biogas Plants, Rs/h Click here to View table |
Assumptions: Gas consumption = 0.467 m3 per hour by 4 inch diameter burner. Dung feeding 25 kg / m3 (actual dung feeding in 2 m3 = 95.87 %; actual feeding in 3 m3 = 83.95 %; actual feeding in 4 m3 = 62.77 %; actual feeding in 6 m3 = 61.14 %; actual dung feeding in 8 m3 = 50 %;) Moisture percentage in fresh dung = 80 % (Das, 1999) Cow dung manure contains = 0.40 % N, 0.20 % P2O5; 0.10 % K2O Biogas slurry contains =1.6 % N, 1.55 % P2O5, 1.0 % K2O Advantage over fresh manure = 1.2 % N; 1.35 % P2O5; 0.9 % K2O Value of N @ 10.9 Rs/kg; Value of P @ 22 Rs/kg; Value of K @ 9.0 Rs/kg; The gas produced was calculated from their daily consumption. Annual plant working cost is increases with the increase of size of plant. It increases from Rs 3405 to Rs 7318 with the size of biogas plant from 2 m3 to 8 m3 Average annual working hour is increases with size of plant, but in case of 4 m3 biogas plant, it is less than 3 m3 size of plant. The trend of annual gas generation is also increases with the size of biogas plant but in case of 4 m3 size of biogas plant, it was found lower than 3 m3 size of biogas plant. Calorific value of biogas is 20 MJ / m3 (Rai, 1997). Calorific value of biogas produced per annum was found lowest of plant size 2 m3 followed by 4 m3 size plant. Calorific value of biogas produced per annum was calculated in terms of LPG gas. The minimum value in terms of LPG gas in kg per annum was found for 2 m3 plant size followed by 4 m3 plants. The maximum value was found for 8 m3 size plant followed by 6 m3 plants. The rate of LPG per cylinder is Rs 350. Value of gas produced was found maximum for 8 m3 followed by 6 m3 plant. It was found minimum for size 2 m3 plant followed by 4 m3 size plant. Value of slurry manure in terms of N, P and K was calculated, it was found that value of N was maximum for plant size 8 m3 followed by 6 m3 and minimum for 2 m3 followed by 4 m3 plant. Same trend was found for additional value of fertilizer, grass benefit, net profit, actual dung fed per annum and benefit cost ratio.
Theoretical Operating Cost of Biogas Plants
The theoretical operating cost of biogas plant under ideal working condition was calculated, considering that it run at 100 % working efficiency. Table 2 reveals that the theoretical working cost or operating cost is decreased (from 2.26 to 1.80 Rs / h) with the increase in the size of biogas plant (from 2 to 8 cum). However, actual working cost of biogas is increased with the increase of plant size (Table.1). It happens due to improper feeding and operational practices.
Table 2. Capacity wise theoretical working cost of biogas plants (Rs / h)
| S.N. | Particulars |
Plant capacity, m3 |
||||
| 2 m3 | 3 m3 | 4 m3 | 6 m3 | 8 m3 | ||
| 1 | Fabrication Cost, Rs | 14,000 | 16,500 | 22,000 | 30,000 | 35,000 |
| 2 | Fixed Cost, Rs / h | 0.90 | 0.71 | 0.70 | 0.63 | 0.56 |
| 3 | Operational cost, Rs / h | 1.36 | 1.31 | 1.27 | 1.25 | 1.24 |
| 4 | Theoretical operating cost, Rs/h | 2.26 | 2.02 | 1.97 | 1.88 | 1.80 |
In economic point of view the larger plant size found more economical. Table.2 reveals that among 2 to 8 m3 family size plants, the largest size plant (8 m3) found most economical due to lowest cost of operation. (1.80 Rs / h) followed by 6 m3 (1.88 Rs/h). Farmer with 2 m3 biogas plant will get back the installation cost 3.86 years and subsequently drive net income of Rs 3620 per annum. Farmer with 3 m3 biogas plant will get back the installation cost 3.12 years and subsequently drive net income of Rs 5273.6 per annum. Farmer with 4 m3 biogas plant will get back the installation cost 5.219 years and subsequently drive net income of Rs 4556 per annum. Farmer with 6 m3 biogas plant will get back the installation cost 6.58 years and subsequently drive net income of Rs 4556 per annum. Farmer with 8 m3 biogas plant will get back the installation cost 7.58 years and subsequently drive net income of Rs 4612 per annum.
Conclusions
The 3 m3 size of plants found more economical with maximum B/C ratio 1.23 followed by 2 m3 (B / C ratio, 1.06). Beyond 3 m3 plant the larger size plants are not found economical. The actual trend of B / C ratio was found in decreasing trend with the increase of size of plant. In ideal and proper feeding conditions, theoretically, the larger size plants are found more economical than the smaller as the operating cost of plant from 2.26-1.8 reduces with increase in size of plant (from 2 to 8 m3) and in economic point of view the larger plant size found more economical.
References
- Das, P.C.1999. Manures and Fertilizers. Kalyani Publishers. Ludhiyana.
- Govil, G. P. and Gaur, R. R., 2000, Development of conversion kits to promote the use of biogas in existing diesel engines for variable load rural applications. In: Proc. Nation. conf. on commercialization aspects of renewable energy sources. 100-111.
- Kumar S., Mishra B.P., Patel S.K., Yaduvanshi B.K., Chinchorkar S.S., Khardiwar M.S. 2013 Trends of biogas plants’ adoption in Chhattisgarh, India. Spring, 2(2), 10-13
- Kumar Shailendra, Mishra B.P., Patel S.K., Yaduvanshi B.K., Sayyad F.G. and Khardiwar M.S. 2014. A Block and Capacity Wise Status of Biogas Plants of Chhattisgarh Plains in India. International Journal of Multidisciplinary and Current Research (Jan/Feb 2014 issue) 18-21.
- Mittal K.M. 1997. Conventional energy systems, principal, progress and prospect. Wheeler publishing company, New Delhi: 120-121.
- Rai, G.D. 1997. Non-Conventional Energy Sources. KHanna Publishshers pvt. Limited. New Delhi, India. Pp 331-435
- Raven, R.P.J.M., Gregersen, K.H., 2007. Biogas plants in Denmark: successes and setbacks. Renewable and Sustainable Energy Reviews 11, 116–132.
- Shailendra Kumar, 2008. Techno Economic Study of Biogas plants in the Chhattisgarh Plain. Unpublished M.Tech, Thesis, Dept of Farm Machinery and Power, IGKV, Raipur.
- Singh, R. and Chaudhary K., Sanjay 2002. A case study for economic analysis of biogas plants in Samastipur district (Bihar). Agricultural Engineering Today, Vol. 26(3-4): 48-52. 2002


