Effects of Boiling Water Temperature on Biofilm Formation in PTI Community Potable Water
E.A. Fadairo1 * and M.I. Otite-Douglas1
1
Industrial Safety and Environmental Technology Department,
Petroleum Training Institute Effurun,
PMB 20 Effurun,
Delta State
Nigeria
http://dx.doi.org/10.12944/CWE.10.1.10
Copy the following to cite this article:
Fadairo E. A and Otite-Douglas M. I, Khardiwar M. S, Kumar S. Effects of Boiling Water Temperature on Biofilm Formation in Pti Community Potable Water. Curr World Environ 2015;10(1) DOI:http://dx.doi.org/10.12944/CWE.10.1.10
Copy the following to cite this URL:
Fadairo E. A and Otite-Douglas M. I, Khardiwar M. S, Kumar S. Effects of Boiling Water Temperature on Biofilm Formation in Pti Community Potable Water. Curr World Environ 2015;10(1). Available from: http://www.cwejournal.org/?p=9021
Download article (pdf) Citation Manager Publish History
The recently observed high E.coli levels in blood samples of the residents of the institute’s hostel accommodation have been of great concern. Coliform bacteria are traditionally used as indicator of E.coli contamination of drinking water source. Although the detection of coliform may not pose serious effect but its presence suggests that there are other disease causing organisms present or that there may be the development of a layer of bacteria (biofilm) within the piping system amongst other causes. The primary reason why there is concern for biofilm in drinking water is because of the growth of coliform bacteria in the pipe net work. Pontius (1995) reported the violation of drinking water standards in the USA in 1993, 1994 and 1995 following the growth of coliform bacteria in the distribution pipe net work. Studies have also shown that nearly 2000 systems in America are significant non compliers because of the repeated detection of coliform bacteria in finished drinking water. Recent studies have examined data from over 90 water systems to determine the factors that contribute to the occurrence of coliform bacterial in drinking water (lechevallier et al .,1996; Volk et al., 1996). These studies revealed that coliform occurrence in drinking water can be linked to the following factors: filtration, temperature, disinfectant type, residual assimilable organic carbon level, corrosion control and pipe material selection (Lechevallier et al., 1996; Volk et al., 1996). Biofilm can also be responsible for loss disinfectants residuals, increased bacterial levels, reduction of dissolved oxygen, taste and odor of drinking water, red or black water problems due to iron or sulfate-reducing bacteria, microbial influenced corrosion, hydraulic roughness and reduced material life (characklis and marshal, 1990). These effects of biofilm in principle depend on the physico-chemical conditions of the interface such as pH value, Oxygen concentration, redox potential and ionic strength etc. There are reports that the presence of biofilm can cause a change in the concentration of these parameters (www.efcweb.org). Research showed that systems that had cold water had increase in coliform occurrences. The influence of pH on purification capacity has generally been studied and in most cases pH has been reported to play a role in bacterial death (Hirn et al. , 1980; Tejordo et al., 1992). Biofilm in drinking water pipe net work can be responsible for a wide range of water quality problems. The report that most of the persistent infections in humans, including the oral, lung, vaginal and foreign body-associated infections, are biofilm-based (Watnick and Kolter, 2000; Tumbarello et al., 1996; Saify et al., 2013) has also prompted our concern for this study. An important characteristic of biofilm is that individual microorganisms are held together by a polymeric substance excreted by the microorganisms, which forms an adhesive matrix ( polysaccharide intracellular adhesion) that holds the biofilm together, allows it to attach to surfaces, and can serve as an encapsulation which protects the colony forming the biofilm ( Ghellai et al., 2014). This protective encapsulation is believed to play a role in some antibiotic-resistant infections experienced in recent times (Lewis, 2001).
This project was therefore conducted to investigate the effect of boiling temperature on possible biofilm formation in domestically stored potable water using coliform bacteria concentration as a marker. The result from this study will be used to inform consumers of water within the community on the significance of boiling and filtration in the prevention of common water born diseases.
Materials and Methods
Collection and Preparation of Samples
A total of 25 representative samples were used for this study. 5 samples each from 5 taps chosen at random and located within female hostel, male hostel, senior staff quarters and Junior staff quarters and 5 150cl Eva water bought from different stores located on PTI road, Effurun. Samples were collected in the early hours of the morning from 20 taps selected at random. Samples were grouped into A, B, C, D and E. Samples in group A were 5 Eva bottled water (EVA), used as control. Samples in group B were potable drinking water collected from the noble female students hostel block (FSH). Samples in group C were water samples from 5 taps located in the male student hostel (MSH) while groups D and E were samples collected from the senior staff quarters(SSQ) and junior staff quarters (JSQ) respectively. Samples were analyzed immediately for physico-chemical parameters, biofilm and coliform test. A portion of the minus boiling water sample was incubated for 5 days for the determination of dissolved oxygen after 5days without any treatment for chlorine and other inhibitors of oxygen use up by microbes. The remaining samples classified as A1, B1, C1, D1 and E1 were subjected to boiling, allowed to cool, filtered and analyzed for same physico-chemical parameters, qualitative biofilm and quantitative coliform test. The boiled and cool sample was also incubated for 5 days for the 5-day dissolve oxygen test.
Biofilm Detection Tube Method
Dthe simple biofilm detection method described by Christensen et al., 1982 with a slight modification was adopted. The sample suspected to contain test organisms was inoculated in 10 mL of trypticase soy broth with 1% glucose (Marthur et al., 2006) in test tubes. The tubes were incubated at 37ºC for 24 h. After incubation, tubes were decanted and washed four times with 200µl phosphate buffer saline (pH 7.2) and dried. Tubes were then stained with crystal violet (0.1%w/v (Boruki et al., 2003; Mathur et al., 2006). Excess stain was washed with deionized water. Tubes were dried in inverted position. The scoring for tube method was done according to the results of the control sample. Biofilm formation was considered positive when a noticeable film lined the wall and the bottom of the tube. The amount of biofilm formed was scored in this present study as 1 for weak/none, 2 for moderate stain and 3 for high/strong. The experiment was carried out in triplicates and repeated thrice (Christensen et al., 1982).
Determination of Coliform Bacteria
Coliform bacterial concentration was determined using the multiple tube technique outlined Fernandez et al., 1992. The media used for the detection of coliform in samples were the Lauryl tryptose broth, brilliant green lactose bile broth and eosin methylene blue for the presumptive, confirmatory and completed stages respectively. Samples were incubated at 35±0.5 0C for 24hrs±2hrs, 48hrs± 3hrs, 24hrs± 2hr and examined for gas formation in all three stages of coliform determination respectively. Coliform bacteria appraised were reported as CFU/100ml.
Determination of Physicochemical Properties
The physico-chemical parameters selected for this study were chosen in line with the multi barrier policy to assessing for drinking water of an acceptable quality which advices the monitoring of total coliform to be in conjuction with other indicators. pH of the water samples were determined prior to boiling and at the end of study duration before cutting of the base of plastic bottles. The pH of the water samples were determined using a pH meter digital model Jenway 3520 at 26 ± 2oC (AOAC, 2000). Conductivity, resistivity and salinity and TDS were determined using a potassium chloride calibrated multi seven mettler Toledo conductivity meter. Dissolved oxygen (DO) was analyzed according to the modified wrinkler and membrane probe method (first devised by wrinkler in 1888 and revised by USA EPA in their SOP, 2007) using Jenway 9500 dissolved oxygen meter before incubation at 20oC for day 5 DO analysis. Total suspended solids were analyzed gravimetrically according to the ASTMD 5907-10 for filterable and non filterable matter in water as outlined by Adeogun et al., 2011.
Statistical Analysis
Data were analyzed using the INSTAT® statistical soft ware. The non significant and significant differences were defined by 0.05Results Tables 3.1, 3.2 and 3.3 show the physico-chemical parameters and coliform count of non-boiling and plus-boiling potable water. For the plus- boiling drinking water, none of the 25 samples contained biofilm nor coliform while for minus-boiling potable water 0.99% of the 25 samples contained biofilm but no gas formation after subjection to coliform bacteria test. The result of the qualitative analysis of biofilm presence in minus-boiling and plus -boiling potable drinking water is presented in Table 3.1.
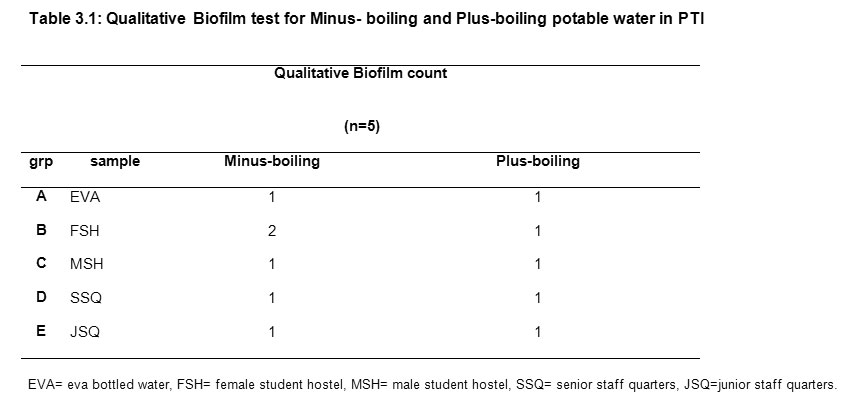 |
Table3.1: Qualitative Biofilm test for Minus- boiling and Plus-boiling potable water in PTI Click here to View table |
The minus boiling FSH sample showed moderate stain in one of the five tubes tested for biofilm. Boiling of the same sample before test for biofilm showed no stain with 0.1% crystal violet (Table 3.1). Table 3.2 represents the relationship coliform and physico- chemical parameters investigated in minus-boiling water drawn from 5 locations within the institute and its environs
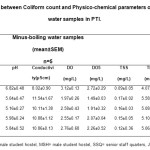 |
Table 3.2: Relationship between Coliform count andPhysico-chemical parameters of Minus-boilingPotable water samples in PTI. Click here to View table |
Table 3.3 represents the relationship between coliform count and potable water samples drawn from 5 different locations with PTI community
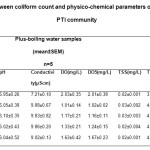 |
Table 3.3: Relationship between coliform count andphysico-chemical parameters of boiled potable waterwithin PTI community Click here to View table |
Discussion
This study examined the effect of boiling temperature on possible biofilm formation and quality of potable water. pH is used as an indicator of how suitable water is for a specific purpose ( Adeogun et al., 2011; Jonnalagadda and Mhere, 2001).Examination of Table 3.2 reveals consistent low pH values. This could be due to the acidic nature of water from the Niger delta region of Nigeria following oil exploration and exploitation activities producing acid rain. This aligns with the work of (Efe and Mogborukor, 2012), who demonstrated the implication of acid rain from flaring of gasses during crude oil refining processes on the quality of water in the Niger delta. But when water samples were subjected to boiling, their pH values were enhanced although values obtained were not statistically significant (P>0.05). High dissolve oxygen concentrations are correlated with high productivity and little pollution, the observed reduction in DO concentration of minus-boiling water samples (Table 3.2) from the female hostel relative to their corresponding plus boiling (Table 3.3) water sample in this study could be an indication of pollution. A lthough, the value were not significant (P>0.05) and was within the WHO acceptable limits for potable water. The measurement of water conductivity is a typical way to monitor continuously the performance trend of water purification systems. Conductivity is the measure of water ability to pass electric current. Pure water is said to be a low conductor of electric current. The observed high concentration of electrical conductivity of minus-boiling potable water sample from the female hostel and all water sample analyzed relative to the control, Eva bottled water could also be an indication of contamination. Although, values obtained fall within WHO acceptable limit for potable water (2004). Conductivity is used as an estimation of total dissolved solids in water. The high levels of electrical conductivity observed in all samples of minus-boiling potable water relative to the control, Eva bottled water, could be due to the high levels of total dissolved solids of the same groups. Increase water temperature has been reported to reduce dissolve oxygen (DO) content of water. The low value obtained for DO of plus-boiling water relative to its minus-boiling water values could be due to boiling. Albeit, dissolved oxygen is not usually considered as a parameter for potable water analysis but in this study we investigated the DO value for day 1 and 5 to enable us ascertain that our suspicion regarding coliform bacteria presence especially in the FSH sample that showed a mild positive result in biofilm screening was incorrect. The dissolved oxygen values for boiled water, day1 and day 5 were almost equal. This could be that the minute biological agents in the minus boiling potable water sample was destroyed by the boiling process. Boiling also reduced the values obtained for total dissolved solids. This could imply that certain non filterable solute in the sample may have been precipitated out at boiling temperature. The low values recorded for total suspended solid in the plus-boiling potable water samples groups may possibly be because of the filteration carried out on the samples after boiling. In this study, salinity values were the same for minus boiling and plus boiling water samples irrespective of the source while resistivity value was reduced significantly (P<0.05) in plus boiling groups relative to the minus-boiling potable water samples. Except for pH values and the qualitative biofilm test result, values obtained in this study fall within the WHO standard for drinking water (2004).
Conclusion
From our findings, boiling of potable water within the institute is advocated in this study for the prevention and management of water borne diseases. Another interpretation of the result from this study could mean that the institute drinking water source may not be adequately treated since coliform can proliferate in storage system biofilm following the moderate biofilm presence observed in the minus-boiling female hostel water sample. One concern is whether opportunistic pathogens can proliferate.
Aknowledgement
The authors thank all staff of Petroleum Analysis Laboratory, Petroleum Training Institute, Effurun, Delta state for providing the necessary laboratory assistance in the course of this study.
References
- Adeogun, A. O., Chukwuka, A.V and Ibor, O.R. (2011). Impact of Abattoir and Saw- Mill Effluents on Water Quality of Upper Ogun River, Abeokuta. American Journal of Environmental Sciences, 7 (6): 525-530.
- (2000). Official method of analysis 17th ed: Association of Official Analytical Chemist: Arlington, VA. USA.
- Borucki, MK, Peppin, JD., White, D., Loge, FJ., Call, DR. (2003). Variation in Biofilm formation among Strains of Listera monocytogenes. Environ. Microbiol, 69:7336-7342.
- Characklis, W.G and Marshall, K.C. (1990).Microbial fouling and Microbial Biofouling control, In: W. G. Characklis and K. C. Marshall (Eds.): Biofilm, John Wiley and Sons inc, New York, 523-634.
- Christensen GD, Simpson WA, Bisno AL, Beachey EH. (1982). Adherence of slime producing strains of Staphylococcus epidermidis to smooth surfaces. Infect Immun, 37:318-326.
- Collins, CH., Lyne,PM.,Grange,JM., and Falkinham,JO.(2004).Microbiological methods. Arnold publishers, London, UK 456pp
- Donlan RM. (2001). Biofilms and device-associated infections. Emerg Infect Dis, 7(2):277-81. ,
- Efe, S.I and Mogborukor, J.O. (2012). Acid rain in Niger Delta Region: Implication on Water Resources Quality and Crisis. AFRREV STECH1 (1);17-46.
- Ghellai, L., Hassaine, H., Klouche,N., Khadir, A., Aissaoui,N., Nas, F and Zingg, W. (2014). Detection of Biofilm formation of a collection of fifty strains of Staphylococcus aureus isolated in Algeria, journal of Bacteriology Research, vol. 6(1), pp. 1-6
- Hirn, J., Viljamaa, H and Raevouri, M. (1980). The effect of physiochemical, phytoplankton and seasonal factors on faecal indicator bacteria in Northern Brakish water. Res, !4, 279-285
- Jonnalagadda,S.B and Mhere, G. (2001). Water Quality of the Odzi River in the Eastern highlands of Zimbabwe. Water Res., 35:2371-2376.
- Lechavallier, M. W. (1990). Coliform regrowth in drinking water: A review Journal of the American Water Works Association, 82: 74-86.
- Lechevallier, M.W., Welch,N.J and Smith, D.B. (1996). Full scale studies of factors related to choliform regrowth in drinking water. Applied Environmental Microbiology; 62:2201.
- Levis, K. (2001). Riddle of biofilm resistance. Antimicrob Agents Chemother, 45:999-1007.
- Mathur, T., Singhal, S., Khan, S., Upadhyay, DJ., Fatima, T., Rattan, A. (2006). Detection of Biofilm formation among the clinical isolates of staphylococci: An Evaluation of three different screening methods. Indian J. Med. Microbiol, 24 (1): 25-29.
- Methods for Chemical Analysis of Water and Wastes.(1979) U.S. EPA 600/4‑79‑020, Method 405.1.
- Pontius, F. (19 95). SDWA advisor or CD. Denver, Colo.; American water works.
- Saify, H., Patidar, R.K., Khare, M., Sahare, K .N and Singh, V. Differences in Biofilm Development Capability of Vancomycin and Ciprofloxacin resistant Staphylococcus aureus Clinical Isolates. J Infect Dis, 1:8.
- Standard Methods for the Examination of Water and Waste water. (1992). APHA‑AWWA‑WEF, 18™ Edition, Method 5210.
- Tejedor, C., Fernandez,A., and Chordi, A. (1992). Water, Air and soil pollution. Kluver Aacademic publishers, printed in The Netherland, 63; 317-320.
- Tumbarello, M., Tacconelli, E., Lucia, MB., Cauda, R and Ortona, L. (1996). Predictors of Staphylococci auereus Pneumonia associated with Human Immunodeficiency Virus Infection. Respir Med, 90: 531-7
- USA EPA (1991). Guidance manual for completion with the filteration and disinfection requirements for public water system using surface. Water sources. U.S. Environmental protection Agency, Washington DC.
- EPA (2010). National primary drinking water regulations: revisions to the total coliform rule; proposed rule. U.S. Environmental Protection Agency, Washington, DC. (EPA-HQ-OW. 2008-0878).
- Volk,C., Welch, N and Lechevallier, M. W. (1996). Survey of Assimilable Organic Carbon and Coliform Regrowth in the American Water System. Voorhees, N.J.; American water works service company, inc.
- Watnick, P and Kolter, R. (2000). Biofilm City of Microbes’. J. Bacteriol, vol.182 no 10; pp 2675-2679.
- WHO.(2004). Guidelines for drinking water quality, 3rd edition. Vol.1. recommendations. World Health Organization, Geneva Switzerland.
- www.efcweb.org/microbial.


