Estimation of Qualitative and Quantitative Parameters of Water in Pendra Block of District Bilaspur
Mohd Irfan Bakshi1 * and Manish Uphadhyay1
1
Department of Chemistry,
Dr. C. V. Raman University,
Kota Bilaspur,
C.G.
India
http://dx.doi.org/10.12944/CWE.10.1.31
Copy the following to cite this article:
Bakshi M. I, Uphadhyay M. Estimation of Qualitative and Quantitative Parameters of Water in Pendra Block of District Bilaspur. Curr World Environ 2015;10(1) DOI:http://dx.doi.org/10.12944/CWE.10.1.31
Copy the following to cite this URL:
Bakshi M. I, Uphadhyay M. Estimation of Qualitative and Quantitative Parameters of Water in Pendra Block of District Bilaspur. Curr World Environ 2015;10(1). Available from: http://www.cwejournal.org/?p=9031
Download article (pdf) Citation Manager Publish History
According to Akaninwor et al. (2007), pollution of freshwater bodies such as drinking waters, streams, lakes and ponds is mostly experienced as a result of industrial discharge, municipal waste disposal and surface runoff. These pollutants may be point source (those that reach water or the environment from a single pipeline or channel, such as sewage discharge) or non-point source (those pollutants coming from diverse sources, entering the environment from multiple venues). Indiscriminate and uncontrolled discharges of waste into drinking waters impact negatively on human health and drinking water ecosystems. Avnish (2010) added that Pollution of surface and ground water is largely a problem due to rapid urbanization and industrialization. The large scale urban growth due to increase in population or migration of people from rural areas to urban areas has increased domestic effluents while industrial development manifested either due to setting up of new industries or expansion of the existing industrial establishments resulting in generation of copious volume of industrial effluents. Pendra Drinking water is one of the drinking waters that drain the surrounding villages in addition to catering the needs of main inhabitants of the block supply water for day to day needs to these villagers who cannot access the Water supply, and many farmers who farm around the drinking water in the catchment area. Other communities downstream use the drinking water for domestic purposes. The Pendra Drinking water passes through the surrounding villages; therefore the wholeness of its water quality is worse. It is mainly contaminated by human excreta, sewage, food waste, and silt. These can be attributed to the increase in urban population and its attendant socio-economic development and sanitation problems. The rate at which the drinking water is being polluted is very high and therefore if nothing is done to control the situation; the water quality will deteriorate beyond levels that can offer useful services to humankind, plants and animals, and the environment at large.
Problem Statement
Pendra, like other urban centers of the developing world is experiencing rapid and uncontrolled growth typified by poor planning, rapid population growth, inadequate amenities and poor sanitation. The effects of this urban growth on surrounding water bodies cannot be overemphasized. Pendra has one of the drinking waters in the Municipality with its headwaters and banks surrounded by refuse dumps, slaughter house, a kraal and a car washing bay. Agricultural activities are also carried out at the areas visited. These issues coupled with runoff from surrounding communities have generated concern about the ecological integrity of the drinking water as well as its water quality.
Specific Objectives
The research is designed to
- Measure conductivity, turbidity, total hardness, pH, nitrate, phosphate, alkalinity, and total dissolved solids levels in the drinking water in the study area. Therefore the present knowledge may help to give first hand information about the quality as well as quantity parameters of water of Pendra block and adjoining areas which will be useful for agriculturists, farmers and inhabitants of the block and surrounding villages. The qualitative and quantitative parameters will provide all the information about the B.O.D and C.O.D values which will be used for the knowledge of aquatic and terrestrial organisms. Hence the research will help us to know the standard of water in the sampling areas and our health, agricultural, horticultural and other related policies will be formed accordingly.
The city of Pendra lies at 81° 95' 00" East Longitude and 22° 76' 67" North latitude. It is, actually, a Nagar Panchayat which refers to a form of urban body prevalent in Indian administrative set up. Pendra or Pendra Road is situated at an elevation of 591 meters above the sea level in the Bilaspur district of the newly formed Indian state of Chhattisgarh. Pendra city is home to 12,392 persons, as per the census of 2001. This population comprises of 50% males and 50% females. thus it is a perfectly balanced region in terms of sex ratio. The average literacy rate of the people of Pendra is 70%, which is quite higher than the Indian national average of 59.5%. 78% of the male population is literate and 63% of the female population of Pendra is literate. 13% of the population of Pendra city is under the age of 6 years. The nearby cities and towns to Pendra Road are Ghaghra, Kotmi Kalan, Gaurela, Menduka and Khodri to which the city is well connected. It houses one of the major railheads of the state of Chattisgarh. The nearby airports of Burhar and Bilaspur serve as the aerodrome for Pendra Road. Summers in Pendra can be scorching hot while winters are mild and pleasant.
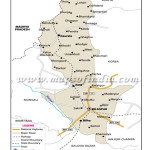 |
Location Specificities Click here to View figure |
Description of Sampling Area
The drinking water takes its source from the foot of mountain Pendra area in Bilaspur Township. The Pendra lies in a semi deciduous forest type of vegetation. Human population around the source is growing; and the major activities around the drinking water include garages, car washing, meat processing, palm kernel extraction, cattle rearing, farming, and petty trading. During dry seasons, inhabitants around the drinking water fetch the water for domestic activities like bathing, washing, cooking, gardening, etc. People who farm around the banks of the drinking water use it for watering their crops. Farmers downstream farther away from the major sources of pollution drink it while on the farm. Research Samples have been divided into two categories comprising main Pendra block and its surrounding villages. The sample has been collected from these areas listed below:-
- Main Pendra Block
- Surrounding Villages
- Kotami
- Dhanpur
- Rumaga
- Bharidand
Treatment of Sampling Containers
Transparent plastic bottles, beakers, test-tubes, pipettes, syringes, used for the estimation of qualitative and quantitative parameters were washed with a brush using detergent (washing powder) solution under running water and thoroughly rinsed with warmed tap water to make sure that all the detergent is removed. The plastic bottles were made to dry by using air from a blower. The glass containers (beakers, test-tubes, pipettes and syringes) were sterilized in an autoclave at 121ÌŠ C for 15 minutes. The sterile bottles were caped and stored in a clean environment.
Sample Collection
The samples collected have been taken from surface water and ground water. The surface water samples were collected from Dam, Reservoir, River, and Rivulet where as the ground water samples included tube well, tap water etc. These samples were taken from main Pendra Block and adjoining areas and after collection of samples estimation on different parameters was done under laboratory conditions. Monthly sampling was made at each sampling site over a period of four month starting from Jan, 2015. The samples were collected using 1000 ml transparent plastic bottles. At each sampling point, a plastic bottle was filled with the drinking water by immersing it into the water at a depth of 5cm from the surface of the water. This was repeated anytime samples were to be taken over the study period. The caps of the plastic bottles were removed by making sure they were not contaminated. Also the bottles were filled by positioning their mouth in the direction of the water current. The filled bottles were properly labelled with the site number, date, and time immediately after collecting the water from the site. Samples were packed into an ice chest with ice blocks on them to maintain the sample temperature at 4oC to 10oC. Sample bottles were not filled completely, at least 2.5 cm air space was allowed for mixing the sample prior to analysis. They were transported to the laboratory at the Dr. C.V. Raman University within 24 hours after collection
Water Quality Indicators
- Turbidity as an indicator of water quality
- pH as an indicator of water quality
- Bacteria as indicators of water quality
- Nutrients as indicators of water quality
- Water hardness as an indicator of water quality:
- Alkalinity as an indicator of water quality:
- Total Dissolved Solids and Conductivity as indicators of water quality
For the collection of data in this research following methods will be used by the researcher.
- Survey Method.
- Questionnaire Method.
- Discussion Method.
- Observation Method.
- Experimental Method.
After the collection of data following results were obtained including qualitative and quantitative parameters of water of the samples studied from the specific areas of Pendra and adjoining villages. Therefore our results will include parameters like turbidity, pH, total dissolved salts, suspended impurities, hardness, alkalinity temperature at different times and at different places and conductivity of the sample, apart from B.O.D. and C.O.D. values. The findings of this study show that there is a lot of variation among different parameters both qualitatively as well quantitatively from the samples analysed which might be due to extra pollutants added to different levels from different outputs which cause the quality of water to degrade and also unfit for drinking and other related purposes so immediate attention is required for keeping water fit for daily usage and other purposes and is the need of hour to save our precious resource. Consider sampling site (S1) with (S2) and see the variation graphically.
Table 1: Sampling Site (Pendra)
| Parameter | Unit | January | February | March | April | May |
| Temperature | ËšC | 21.1 | 22.2 | 20.3 | 18.9 | 19.8 |
| Ph | mol/L | 7.7 | 7.4 | 7.5 | 7.4 | 7.0 |
| Turbidity | mg/L | 50 | 55 | 50 | 35 | 40 |
| Alkalinity | mg/L | 50 | 45 | 48 | 42 | 36 |
| Hardness | mg/L | 48 | 48 | 40 | 32 | 38 |
| Chloride | mg/L | 3.0 | 3.3 | 3.8 | 5.5 | 5.0 |
| Sulphate | mg/L | 22 | 26 | 28 | 29 | 29 |
| D.O | mg/L | 7.6 | 7.5 | 7 | 7.4 | 7.2 |
| B.O.D | mg/L | 5.1 | 5 | 5.5 | 5.9 | 5.3 |
| C.O.D | mg/L | 27.2 | 20 | 22.9 | 26 | 29 |
| Total solids | mg/L | 190 | 176 | 154.5 | 156 | 173 |
| Total Dissolved Solids | mg/L | 122 | 116 | 98.5 | 110 | 103.5 |
| Total Suspended Solids | mg/L | 68 | 60 | 56 | 46 | 69.5 |
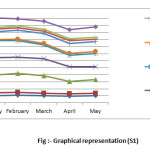 |
Figure 1: Graphical representation (S1) Click here to View figure |
Table 2: Sampling Site (Kotmi)
| Parameter | Unit | January | February | March | April | May |
| Temperature | ËšC | 21.1 | 22.2 | 20.3 | 18.9 | 19 |
| pH | mol/L | 6.2 | 6.9 | 7.1 | 7.0 | 7.1 |
| Turbidity | mg/L | 30.4 | 30.6 | 30.4 | 30.6 | 23.2 |
| Alkalinity | mg/L | 44 | 47 | 41 | 42 | 46 |
| Hardness | mg/L | 37 | 36 | 38 | 30 | 38.1 |
| Chloride | mg/L | 3.2 | 4 | 4.2 | 6.0 | 6.0 |
| Sulphate | mg/L | 18 | 21 | 18.1 | 18.1 | 19.5 |
| D.O | mg/L | 4.9 | 4.3 | 3.1 | 4.5 | 5.1 |
| B.O.D | mg/L | 7.7 | 7.2 | 8 | 8.0 | 9.5 |
| C.O.D | mg/L | 22.1 | 21.0 | 20 | 20.4 | 21 |
| C.O.D | mg/L | 161 | 153 | 123 | 145 | 148.5 |
| Total Dissolved Solids | mg/L | 110 | 105 | 93 | 109 | 108.5 |
| Total Suspended Solids | mg/L | 51 | 48 | 30 | 36 | 40 |
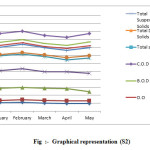 |
Figure 2: Graphical representation (S2) Click here to View figure |
References
- Abaidoo, R. C. and Obiri-Danso, K. (2008). Environmental Microbiology: Determination of Indicator microorganisms in environmental freshwaters and drinking waters. P.45; Institute of Distance Learning, New Library Building, K.N.U.S.T., Kumasi, Ghana.
- Akaninwor, J. O., Anosike, E. O. and Egwim, O. (2007). “Effect of Indomie Industrial Effluent Discharge on Microbial Properties of New Calabar Drinking water.” Scientific Research and Essay, 2(1): 001-005.
- Bruvold, W.H. and Ongerth, H. J. (1969). Taste quality of mineralized water. Journal of the American Water Works Association, 61:170.
- Fairfax Water quality Bulletin (2011). Explanation of Water Hardness; Fairfax county water Authority- 8570 Executive Park Avenuefairfax, VA-22031.
- Hopkins, J.S. (2001). Special Water Quality Survey of the Pecos and Gallinas Drinking waters below the Viveash and Manuelitas Fires; New Mexico Environment Department: Santa Fe, NM, USA; pp. 1-7.
- Julian, R. (2009). Sciences Science Fair Project Information: The Effect of Development on Water Quality in Two Creeks Flowing From the Same Snowpack and Rainfall Lim, S. and Olivieri, V. (1982).
- Sources of microorganisms in urban runoff. Johns Hopkins School of Public Health and Hygiene. Jones Falls Urban Runoff Project. Baltimore, MD 140 pp. Microsoft Encarta (2009). Encarta Dictionaries: Indicator Organism.


