Performance of Laterite Soil Grains as Adsorbent in the Removal of Chromium
Syama I J1 , Arun Kumar Thalla1 and Manu D S1 *
1
Department of Civil Engineering,
National Institute of Technology Karnataka,
Surathkal,
Karnataka
India
http://dx.doi.org/10.12944/CWE.10.1.33
Copy the following to cite this article:
Syama I J, Thalla A. K, and Manu D S. Performance of Laterite Soil Grains as Adsorbent in the Removal of Chromium. Curr World Environ 2015;10(1) DOI:http://dx.doi.org/10.12944/CWE.10.1.33
Copy the following to cite this URL:
Syama I J, Thalla A. K, and Manu D S. Performance of Laterite Soil Grains as Adsorbent in the Removal of Chromium. Available from: http://www.cwejournal.org/?p=8607
Download article (pdf)
Citation Manager
Publish History
Since last 5 decades, environmental pollution due to rapid industrialization has created more modern problems. Industries have a large prospective to cause streams, river, lake and sea pollution, thereby causing increased addition of heavy metals into the environment (Sahu et al. 2009). Environment pollution by toxic heavy metals occurs through industrial, military and agricultural processes (Ajmal, Ali Khan Rao, and Siddiqui 1996).A serious threat that posed to the environment due to the discharge of heavy metals into the streams there by causing accumulation leading to adulteration of food chain.Toxicity is caused due to the presence of heavy metals like Ni, Zn, Cu, Cd, Cr, and Hg are toxic even in trace amounts. Metal species produced due to the various activities, when released into the environment they increase persistently (Chand, Agarwal, and Kumar 1994). It is a mandate to monitor their levels within permissible limits as recommended by the World Health Organization (WHO) in drinking water, wastewater and water used for farming and recreational uses. Cr (VI) and Cr (III) are the two stable oxidation states of chromium. The Cr (VI) state is of especial interest because of its noxious. Thermodynamically stable chromate (CrO42-) and dichromate (Cr2O7 2-) anions which vary over a wide pH range are the usual hexavalent chromium wastes discharged into the surroundings. Cr (VI) compounds are noxious which causes lung cancer, as well as kidney, liver and skin damage in human beings (Kousalya, Gandhi, and Meenakshi 2010). As per Indian standards the acceptable limit of Cr (VI) that is to be discharged from industrial effluents to surface water is 0.1 mg\L. The maximum acceptable limit of the chromium content in drinking water is 0.05 mg/L. Various treatment skills have been developed for removal of organics and toxic heavy metals from both domestic and industrial wastewater (Mohan and Singh 2002). The widely used physico-chemical techniques to treat wastewater includes adsorption, ion-exchange, electrodialysis, chemical reaction, filtration, coagulation/flocculation, reverse osmosis etc. (Sahu et al. 2009) (Owlad et al. 2008). Choice of reliable treatment method depends upon effluent characteristics such as flow rate, pH, temperature, heavy metals, and trace organics. Physico-chemical processes are found to be more advantageous compared to biological processes. Physico-chemical treatment processes remain unaffected even in the presence of toxic wastes such as heavy metals, however, biological treatment processes fail to function in case of wastes such as inorganic or non-biodegradable in nature. The present study aims to examine the adsorption characteristics of LG intended to be used as an adsorbent for removal chromium size ranging from 0.6 mm to 1.18 mm in synthetic wastewater treatment. In general laterite is red colored, highly weathered acidic soil, rich in sesquioxides, iron oxide and alumina and possesses low cation exchange capacity due its weathered nature (Maji, Pal, and Pal 2008). LG was found to be a suitable low cost adsorbent for arsenic and fluoride removal by many researchers (Maiti et al. 2013), (Srinivasa Rao, Anand, and Venkateswarlu 2010)(Sanjoy Kumar Maji et al. 2007), (Sarkar et al. 2006). However, it was found that, as soil particle size decreases adsorption efficiency increases. Small size particles at the times creates operational difficulties, for e.g., (Sarkar et al. 2006) separation of finer laterite particles by filtration during batch operation, choking of laterite bed during column operation (Sarkar et al. 2006). Limited studies have been carried out on the adsorption performance of LG of particle size ranging from 0.5 mm to 10 mm.
Materials and Methods Adsorbent Preparation Raw Laterite Grain Preparation (LG)
LG were collected from the Surathkal region of Karnataka. The collected grains were washed several times with tap water to remove undesirable layers like decayed organic matter, worm, sand, dust etc. Then the sample was air dried for 2- 3 days. A part of air dried sample was crushed to get soil of particle size less than 425µ, for conducting soil characterization studies. The soil thus obtained was washed 20- 30 times to remove red color of iron and finally air dried for 2-3 days and kept in an air tight container to avoid further moisture absorption. (Sanjoy K Maji, Pal, and Pal 2007).
Acid Activated Laterite Preparation
Adsorption studies of Cr (VI) were done also on AALG soil. 50 g of raw laterite (RL) prepared with average size of particle 0.6–1.18 mm and 100 mL of 0.2 N Hcl solution were taken into 250 mL glass beaker. The acid–laterite mixtures were mechanically agitated at 300 RPM for 2.0 hours. The mixture was kept further at room temperature for 24 hours. The solid fraction was taken in a beaker and washed with distilled water. Washing was performed until the pH of the wash water reached about 6.5. Finally, AAL was sun dried and screened to get desired size fractions between 0.6 and 1.18 mm (Maiti, Basu, and De 2010)
Soil Characterisation Tests
In order to characterize the soil with respect to parameters relevant to adsorption chemical analysis of the soil sample prepared were done as per standard methods (APHA, 2005). The RL and AAL soil samples were characterized for percentage silica content, alumina content, iron oxide content, organic matter content, carbonate content and pHZPC. Table 1. gives the soil characterization methods adopted for chemical analysis of soil.
Table 1: Soil Characterization Methodology
| Sl. No | Characteristics of soil | Method | References |
| 1 | Silica (%) | Gravimetric | IS:2720(Part 25) – 1982(Soil Engineering and Rock Mechanics Sectional Committee 1982) |
| 2 | Alumina ( % ) | Gravimetric | |
| 3 | Iron oxide (%) | Thiocynate method | (Wagner, Clever, and Peters 1947) |
| 4 | Organic matter content | Titration method | IS:2720 (Part22) – 1972 section 1. (Soil Engineering Sectional Committee 1972) |
| 5 | Carbonate content | Titration method | (Rowell 1994) |
| 6 | pHZPC | Mass titration method | (Reymond and Kolenda 1999) |
Adsorbate Preparation
For the study, synthetically prepared metal solutions were used for evaluating the adsorption efficiency of the LG. For both ferric and hexavalent chromium ions, the adsorbate solution were prepared as explained in below sections.
Ferric Ion Solution
Stock ferrous ion (Fe (III)) solution of 100 mg/L was prepared from ferrous ammonium sulphate (Fe (NH4)2(SO4)2.6H2O). Initially 20 ml of concentrated sulphuric acid was transferred into 50 ml of deionized water and about 1.404g of ferrous ammonium sulphate was dissolved into it. Then it was subjected to drop wise treatment using 0.1N KMnO4 until a faint pink color persists. Addition of excess KMnO4 to the ferrous ammonium sulphate solution ensures the complete oxidation of ferrous ion to ferric ion. Since the prepared ferric ion solution is acidic in nature, ferric ion exists in dissolved form in the same. The solution was then diluted to 1000 ml for producing iron solution of 100mg/L. From the stock solution, the ferric ion solutions of required concentrations were prepared via dilution using deionized water.
Hexavalent Chromium Solution
About 282.8 mg of potassium dichromate (K2Cr2O7) was dissolved in 100 ml distilled water to give a chromium (Cr (VI)) concentration of 500 mg/L. From this, Cr (VI) ion solutions of required concentrations were prepared via dilution with deionized water.
Adsorbate Analysis
For the analysis of ferric ion, PC Spectro – Lovibond and for hexavalent chromium analysis double beam spectrophotometer was used as shown in Table 2.
Table 2: Adsorbate Analysis Methodology
| Metal Ion Analysis | Standard Method/ Procedure | Reference |
| Ferric Ion Analysis | Evaluation of Ferric Thiocyanate colorimetric method | (Wagner et al. 1947) |
| Hexavalent Chromium Analysis | Determination of Hexavalent Chromium (colorimetric method) | (United States Environment Protection Agency 2004) |
Adsorption Studies Methodology Batch Study
Adsorption batch studies were performed to study the adsorption behavior of laterite grains in batch mode. Batch studies aim to develop adsorption isotherms, and study the effect of pH, adsorbate concentration, adsorbent dosage, and contact time on adsorbate removal. For each trial 25ml of hexavalent chromium and 60 ml of ferric ion was prepared from the stock solution of known concentration and pH with a desired laterite dosage. It was taken into a 300ml BOD bottle, placed into the flash mixer and agitated at a fixed speed of 220 rpm for the required contact time. All the trials were carried out using deionized water. 0.1 N NaOH and 0.1N H2SO4 were used for adjusting the initial pH of the adsorbate solution to the desired value. After the required contact time the solution was filtered through filter paper and analyzed for adsorbate concentration. The percentage removal of the adsorbate and adsorption capacity of adsorbent was calculated using the Equ.1 as given below.

Where, Co= Initial concentration of adsorbate (mg/L) Cf = final concentration of adsorbate (mg/L)
Column Study
Fixed bed column studies were conducted to study the adsorption of Fe (III) and Cr (VI) ions on laterite soil grains during continuous flow passages. The experiments were carried on a glass column of 2.5 cm diameter and over 50 cm total height. The column was packed with the adsorbent over a height of 30 cm between two supporting layers of glass wool as shown in Figure.1
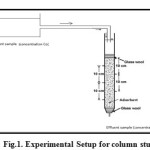 |
Figure 1: Experimental Setup for column study Click here to View figure |
The glass wool used did not take part in the adsorption process, but instead it is used to ensure proper positioning of laterite layer and afforded a uniform down the flow of the absorbate solution onto the adsorbent. For maintaining the flow rate through the sample, instead of using an inlet feed pump, the metal solution was provided in a container placed at a suitable height. The metal solution passed through the column by gravity. For all adsorption experiments the column height was maintained as 30 cm and flow rate was maintained to be 5ml/min. In order to study the effect of initial adsorbate concentration upon adsorption, column study was conducted for two different initial metal ion concentrations. For chromium studies were conducted for an initial adsorbate concentration of 5mg/l, and 10mg/l and for ferric ions column behavior at 2.5mg/l was studied. To determine the extent of adsorption, samples were taken from the adsorption column at specific time intervals, from the bottommost outlet. The samples taken were then analyzed to assess the residual amount of Cr (VI) or Fe (III) present in it. The entire column experiment was conducted over a suitable period of time until the effluent concentration for the bottommost outlet reached 80% of the influent concentration. For a particular adsorbate, all adsorption experiments were done on the same adsorbent column (without adsorbent being replaced). After each adsorption experiment, the adsorbent was suitably down, washed with copious amounts of deionized water for a suitable time period.
Results and Discussion
This section discusses the results of soil characterization tests, batch and column studies of hexavalent chromium and ferric ions on LG and AALG.
Soil Characterisation Tests Results
Results of soil characterization tests conducted on LG and AALG as shown in Table.3.
Table 3: Soil characteristics
| Sl. no | Soil characteristic | Value | |
| LG | AALG | ||
| 1 | Silica (%) | 50.7 | 56.4 |
| 2 | Iron oxide (Fe2O3) (%) | 29.34 | 24.6 |
| 3 | Alumina ( % ) | 8.1 | 6.8 |
| 4 | Organic carbon content (%) | 0.29 | 0.06 |
| 5 | Carbonate content (%) | 4.5 | 1.3 |
| 6 | pHZPC | 5.95 | 4 |
AALG resulted in the decrease of iron oxide, alumina, organic carbon, carbonate content and pHZPC of LG. All these changes can lead to the increased pore volume and specific surface area of the AALG soil particles which in-turn could increase the adsorption capacity in comparison to raw laterite grains.
Adsorption Studies on Hexavalent Chromium On Lg and Aalg Adsorption batch studies on LG and AALG
In order to increase the removal efficiency and to formulate adsorption isotherms, batch study was conducted to find out the optimum adsorbent dosage, pH, contact time, and adsorbate concentration.
Effect of dosage LG and AALG
The effect of adsorbent dosage on LG and AALG is as shown in Figure.2. Experimental studies were carried out in the room temperature with initial adsorbate concentration 10mg/L using adsorbent dosage-1 to 6g at pH 7.0 for 1h contact time. The percentage removal increased with increase in adsorbent dosage. For the optimum dosage of 6g, the removal efficiency of both the adsorbents LG and AALG was found to be 38% and 78%.
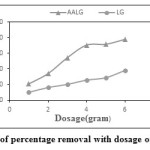 |
Figure 2: Variation of percentage removal with dosage of LG and AALG Click here to View figure |
Effect of pH for LG and AALG
The effect of pH on LG and AALG is as shown in Figure.3. Experimental studies were carried out in the room temperature with initial adsorbate concentration 10mg/L using adsorbent dosage-6g at pH- 2 to 8 for 1h contact time. The adsorption behaviour with pH is different for LG and AALG. The removal efficiency of hexavalent chromium increased with increase in pH in case of AALG in contrast to the case of LG. Maximum removal efficiency of 78% was obtained for pH- 7 for AALG and 53% at pH-2 for LG. The study attributed that AALG adsorbent is more effective than LG.
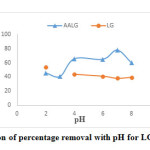 |
Figure 3: Variation of percentage removal with pH for LG and AALG Click here to View figure |
Effect of Contact Time for LG and AALG
The effect of contact time on removal efficiency LG and AALG is as shown in Figures. 4. and 5. The percentage removal increased with increase in contact time and reached equilibrium after 2 hours. Equilibrium time increased by 1 hour than that of LG. The interfaces of Cr (VI) were fast initially, but the equilibrium was reached only after an appreciable length of time. Although 80% of maximum adsorption of Cr (VI) was attained within 30 min with AALG, the equilibrium could be attained only after 120 min. Also from the graph it is evident that the equilibrium percentage removal was almost independent of initial adsorbate concentration.
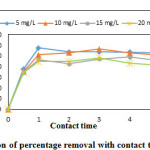 |
Figure 4: Variation of percentage removal with contact time for LG Click here to View figure |
Effect of Initial Adsorbate Concentration LG and AALG
The effect of concentration on removal efficiency of LG and AALG is as shown in Figure.6. It can be seen that the equilibrium percentage removal increased when initial chromium concentration was increased from 2.5 mg/L to 5 mg/L and thereafter the removal efficiency remained almost constant for concentrations up to 20 mg/L for AALG. The percentage removal obtained was higher than that obtained for LG for all concentrations. Almost 80% removal efficiency was obtained for adsorbate concentrations from 5 mg/L to 20 mg/L. The increase in percentage removal upon AALG was lower than LG. In case of 2.5 mg/L, the percentage removal was found to be 9.29% and at a higher initial adsorbent concentration of 20 mg/L, 34.04% removal efficiency was found with LG.
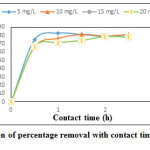 |
Figure 5: Variation of percentage removalwith contact time for AALG Click here to View figure |
Adsorption Isotherms LG and AALG
The equilibrium adsorption data obtained through batch adsorption studies were fitted into two most commonly used adsorption isotherms Frendulich and Langmuir isotherms. The linearized isotherm plots are shown in Figure.7 and Figure. 8. The isotherm coefficients and correlation coefficients (R2) are given in table 4. The correlation coefficient (R2) value for LG was obtained as 0.997 and 0.950 for Freundlich and Langmuir isotherms respectively, which indicates the usability of both isotherm models to explain the adsorption behavior of Cr (VI). The R2 value of AALG for Freundlich and Langmuir isotherm obtained was 0.95 and 0.126 indicating the inability of the isotherm model to explain the adsorption behavior. The disagreement with the Langmuir model might be due to
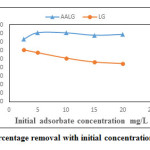 |
Figure 6: Variation of percentage removal with initial concentration for LG and AALG Click here to View figure |
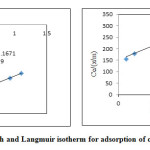 |
Figure 7: Freundlich and Langmuir isotherm for adsorption of chromium onto LG Click here to View figure |
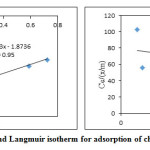 |
Figure 8: Freundlich and Langmuir isotherm for adsorption of chromium onto AALG. Click here to View figure |
Table 4: Adsorption isotherm coefficients for LG and AALG
| LG | |||||
| Freundlich | Langmuir | ||||
| Kf | 1/n | R2 | a | b | R2 |
| 0.006 | 0.723 | 0.997 | 0.08 | 0.082 | 0.950 |
| AALG | |||||
| Freundlich | Langmuir | ||||
| Kf | 1/n | R2 | a | b | R2 |
| 0.0133 | 0.895 | 0.95 | -0.00029 | -3.6*10^-6 | 0.126 |
For the column studies hexavalent chromium solution of known initial concentration 5mg/L, 10 mg/L and pH=7 was continuously fed at the top of the column bed at a fixed flow rate of 5 mL/min for both LG and AALG. A plot of the ratio of effluent adsorbate concentration (C) to the initial concentration (C0) against the time of flow (t) yielded the breakthrough curve (BTC). Figure 9, depicts the breakthrough curves obtained for adsorbate concentrations 5 ppm and 10 ppm on LG and AALG. The C/Co value is found to increase with an increase in flow time for both the adsorbate concentrations which means that the amount of Cr (VI) increased in effluent with the passage of time. The breakthrough point of the column was taken as the point when C/Co value becomes 0.8. The adsorption column achieved breakthrough at 76 min and 42 min for 5mg/l and 10 mg/l, respectively i.e. the column achieved breakthrough at a faster rate for higher concentration.
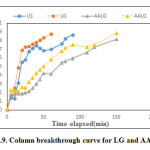 |
Figure 9: Column breakthrough curve for LG and AALG. Click here to View figure |
The break through curves obtained for AALG were flatter than that obtained for RL. No considerable increase was observed in C/C0 value for AALG for the first 20 min of flow, which indicates that there was no sudden decrease in effluent quality with the passage of time as in the case of RL. The column achieved break point at 150 min and 130 min for 5 mg/l and 10 mg/l respectively. An increase in break point time by 74 min with respect to 5 mg/l and 88 min for 10 mg/l was observed when compared to LG. Table 5.The total percentage removal and adsorption capacity obtained in column studies for LG and AALG.
Table 5: Adsorption column performance for LG and AALG
| C0(mg/L) | LG | AALG | ||||||
| qad (mg) | mtotal(mg) | R(%) | qeq (mg/g) | qad (mg) | mtotal(mg) | R (%) | qeq (mg/g) | |
| 5 | 0.82 | 2.2 | 37.2 | 0.0045 | 3.062 | 3.75 | 81.6 | 0.0170 |
| 10 | 0.95 | 2.8 | 34.0 | 0.0052 | 5.575 | 7.5 | 74.3 | 0.031 |
qad = total adsorbate adsorbed in the column; mtotal= total adsorbate passed through column; qeq= adsorbate adsorbed in 1 g of adsorbent; (R%)= overall removal It is evident that the percentage removal (R%) and adsorption capacity(qeq) increased considerably for AALG. An increase in the percentage removal of 44.39 % was obtained for 5 mg/l and that about 40.27% was obtained for 10 mg/l. The concentration difference between Cr (VI) over the adsorbent surface with that the solution is the driving force for the adsorption which explains the reason for the decrease in break through time with incremental of initial metal concentration. Higher amount of metals can adsorbed by providing bigger driving force for mass transfer process provided through high initial concentration of adsorbate ions. Increase in diffusion coefficient is due to the difference in higher concentration where in quick transport of metals from solution onto adsorbent take place.
Adsorption Studies of Ferric Ions on Lg- Batch Studies Adsorption Batch Studies on LG.
Adsorption studies of Fe (III) ions were conducted on LG. Batch studies were done at a constant pH of 3. The increase in pH beyond 3 led to the precipitation of ferric hydroxide due to reaction with NaOH used to adjust pH.
Effect of Laterite Dosage
Effect of adsorbent dosage for removal of ferric ion is shown in Figure.10 Adsorbent dosage varied from 0.5 to 3g with pH-3, initial concentration 10 mg/l, contact time 60 min. The Percentage removal increased with increase in laterite dosage. When the optimum dosage was 2g, the removal efficiency LG was found to be 58%, afterwards it remained almost constant. Therefore laterite dosage of 2 g was used up as optimum dosage and further adsorption studies were performed with the same adsorbent dosage.
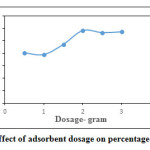 |
Figure 10: Effect of adsorbent dosage on percentage removal Click here to View figure |
Effect of Contact Time
Effect of contact time for removal of ferric ion is as shown in Figure.11. Contact time varied from 15 min-60 min, initial concentration 5 mg/L to 20 mg/L, pH-3, dosage- 2 g. Initially percentage removal increased with increase in contact time. This trend continued for a contact time of 45 min, afterwards the percentage removal remained almost constant indicating that the system attained equilibrium. The equilibrium contact time was 45 min irrespective of the initial adsorbate concentration
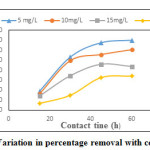 |
Figure 11: Variation in percentage removal with contact time Click here to View figure |
Effect of Initial Adsorbate Concentration
Effect of initial adsorbate concentration for removal of ferric ion is as shown in Figure.12. Initial adsorbate concentration varied from 2.5 mg/l to 20 mg/l, pH-3, dosage-2g, and contact time-45 min. Percentage removal was found to decrease with increase in initial ferric ion concentration. With an increase in adsorbate concentration of 2.5 mg/l to 20 mg/l, the percentage removal decreased by 50.43%. Maximum equilibrium percentage removal of 84.5%was obtained for ferric ion concentration of 2.5 mg/l.
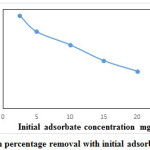 |
Figure 12: Variation in percentage removal with initial adsorbate concentration. Click here to View figure |
Adsorption Isotherms
The equilibrium adsorption data obtained from batch studies of ferric ions was fitted into Freundlich and Langmuir isotherms and the plots obtained are as shown in Figure.13. The isotherm coefficients and correlation coefficients are given in table. 6. It can be observed that the Langmuir model fits into the adsorption data while Freundlich model fails in the same. Further the correlation coefficient obtained for Freundlich isotherm is 0.453 and indicates a poor correlation between the data and isotherm model.
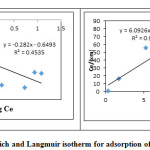 |
Figure 13: Freundlich and Langmuir isotherm for adsorption of ferric ion onto LG. Click here to View figure |
Table 6: Adsorption isotherm coefficients for ferric ion
| Frendulich isotherm constants | Langmuir isotherms constants | ||||
| Kf | 1/n | R2 | a | b | R2 |
| 0.22 | -0.282 | 0.453 | 0.1658 | 0.922 | 0.901 |
Adsorption Studies of Ferric Ions on Laterite Soil Grains- Column Studies
In column studies ferric ion solutions of known initial concentration 2.5 mg/l, and pH-3 was continuously fed at the top of the column bed at a fixed flow rate of 5 ml/min. The breakthrough curve obtained for adsorbate concentration of 2.5 mg/l is as shown in Figure.14. The C/C0 value was around 0.1, at the start of the experiment then it gradually reduced up to 0.002. After 90 min C/C0 began to increase, indicating the increasing quantity of ferric ion in the effluent. The column breakthrough was obtained after a flow period of 420 min. The reason may be the decrease in adsorption efficiency with increased adsorbate concentration or maybe no availability of adsorption sites in the column due to complete saturation. Table.7. gives the total percentage removal and adsorption capacity for 2.5mg/l concentration.
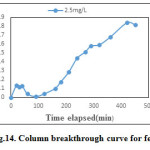 |
Figure 14: Column breakthrough curve for ferric ion Click here to View figure |
Table 7: Adsorption column performance for ferric ions
| Co(ppm) | ||||
| qad(mg) | mtotal(mg) | R (%) | qeq (mg/g) | |
| 2.5 | 3.42 | 5.5 | 62.27 | 0.019 |
The total percentage removal obtained for 2.5 mg/l was 62.27 %, which is lesser than that obtained in batch studies, similar to the case of Cr (VI). In the case of Fe (III), adsorption in batch mode was found to be more efficient than that in column mode.
Conclusion
In the present study removal of Cr (VI) and Fe (III) from aqueous solutions was achieved using LG and AALG as an adsorbent. In batch study the maximum removal efficiency of LG and AALG for removal of Cr (VI) were found to be 48% and 78% with initial adsorbent dose 2g/l, pH-7 and contact time 60 min, respectively. The adsorption of Cr (VI) and Fe (III) was evaluated by the Langmuir, Freundlich isotherm models. The adsorption of Cr (VI) on LG followed both Freundlich and Langmuir isotherm models, while adsorption on AALG followed only the Freundlich model. The adsorption behavior of ferric ion showed deviation from Freundlich model, while it was found to agree with Langmuir model. The Cr (VI) removal efficiency obtained from laterite column was lesser than the efficiency obtained in batch mode .The removal efficiency of laterite column decreased with increase in adsorbate concentration. The LG column achieved breakpoint faster than AALG, indicating than AALG can accomplish removal for a larger time period than that of LG column. The column removal efficiency of chromium and ferric ion was found lesser than that of removal obtained by batch mode. From the whole work it can be concluded that laterite grains of size in between 0.6 mm and 1.18 mm are less efficient in removal of Cr (VI) from aqueous solutions but are efficient adsorbents of Fe (III) for low adsorbate concentrations. AALG can considerably increase the removal efficiency and can act as an efficient adsorbent in both batch and column mode.
Refrences
- Ajmal, Mohammad, Rafaqat Ali Khan Rao, and Bilquees Ara Siddiqui. 1996. “Studies on Removal and Recovery of Cr(VI) from Electroplating Wastes.” Water Research 30:1478–82.
- Chand, SHRI, V. K. Agarwal, and PAVAN Kumar. 1994. “Removal of Hexavalent Chromium from Wastewater by Adsorption.” Indian Journal of Environmental Health 36:151–58. Retrieved (http://cat.inist.fr/?aModele=afficheN&cpsidt=3658428).
- Kousalya, G. N., Muniyappan Rajiv Gandhi, and S. Meenakshi. 2010. “Preparation of Modified Chitin for the Removal of Chromium(VI).” Bioremediation Journal 14:208–18.
- Maiti, Abhijit, Jayanta Kumar Basu, and Sirshendu De. 2010. “Removal of Arsenic from Synthetic and Natural Groundwater Using Acid-Activated Laterite.” Environmental Progress and Sustainable Energy 29:457–70.
- Maiti, Abhijit, Barun Kumar Thakur, Jayanta Kumar Basu, and Sirshendu De. 2013. “Comparison of Treated Laterite as Arsenic Adsorbent from Different Locations and Performance of Best Filter under Field Conditions.” Journal of Hazardous Materials 262:1176–86.
- Maji, Sanjoy K., Anjali Pal, and Tarasankar Pal. 2007. “Arsenic Removal from Aqueous Solutions by Adsorption on Laterite Soil.” Journal of environmental science and health. Part A, Toxic/hazardous substances & environmental engineering 42:453–62.
- Maji, Sanjoy Kumar, Anjali Pal, and Tarasankar Pal. 2008. “Arsenic Removal from Real-Life Groundwater by Adsorption on Laterite Soil.” Journal of Hazardous Materials 151:811–20.
- Maji, Sanjoy Kumar, Anjali Pal, Tarasankar Pal, and Asok Adak. 2007. “Modeling and Fixed Bed Column Adsorption of As(III) on Laterite Soil.” Separation and Purification Technology 56:284–90.
- Mohan, Dinesh and Kunwar P. Singh. 2002. “Single- and Multi-Component Adsorption of Cadmium and Zinc Using Activated Carbon Derived from Bagasse--an Agricultural Waste.” Water research 36:2304–18.
- Owlad, Mojdeh, Mohamed Kheireddine Aroua, Wan Ashri Wan Daud, and Saeid Baroutian. 2008. “Removal of Hexavalent Chromium-Contaminated Water and Wastewater: A Review.” Water, Air, and Soil Pollution 200(1-4):59–77. Retrieved November 11, 2014 (http://link.springer.com/10.1007/s11270-008-9893-7).
- Reymond, J. P. and F. Kolenda. 1999. “Estimation of the Point of Zero Charge of Simple and Mixed Oxides by Mass Titration.” Pp. 30–36 in Powder Technology, vol. 103.
- Rowell, D. L. 1994. Soil Science: Methods & Applications. Longman Scientific and Technical.
- Sahu, J. N., S. Agarwal, B. C. Meikap, and M. N. Biswas. 2009. “Performance of a Modified Multi-Stage Bubble Column Reactor for lead(II) and Biological Oxygen Demand Removal from Wastewater Using Activated Rice Husk.” Journal of Hazardous Materials 161:317–24.
- Sarkar, Mitali, Aparna Banerjee, Partha Pratim Pramanick, and Asit R. Sarkar. 2006. “Use of Laterite for the Removal of Fluoride from Contaminated Drinking Water.” Journal of Colloid and Interface Science 302:432–41.
- Soil Engineering and Rock Mechanics Sectional Committee, BDC 23. 1982. Indian Standard METHODS OF TEST FOR SOILS (IS : 2720 ( Part XXV ) - 1982). Retrieved (https://law.resource.org/pub/in/bis/S03/is.2720.25.1982.pdf).
- Soil Engineering Sectional Committee, BOC 23. 1972. Indian Standard METHODS OF TEST FOR SOILS (IS : 2720 (Part XXII ) - 1972 (Reaffirmed 2010)). Retrieved (https://law.resource.org/pub/in/bis/S03/is.2720.22.1972.pdf).
- Srinivasa Rao, Karanam, Shashi Anand, and Paladugu Venkateswarlu. 2010. “Adsorption of cadmium(II) Ions from Aqueous Solution by Tectona Grandis L.F. (teak Leaves Powder).” BioResources 5:438–54.
- United States Environment Protection Agency. 2004. “SW-846 On-Line.” P. 3500 in Test Methods for Evaluating Solid Waste, Physical/Chemical Methods. Retrieved (http://www.epa.gov/osw/hazard/testmethods/sw846/pdfs/9045d.pdf).
- Wagner, C. D., H. L. Clever, and E. D. Peters. 1947. “Evaluation of Ferrous Thiocyanate Colorimetric Method.” Analytical Chemistry 19(12):980–82. Retrieved January 15, 2015 (http://pubs.acs.org/doi/abs/10.1021/ac60012a011).


