Phytoplanktonic Diversity and Its Relation to Physicochemical Parameters of Water at Dogarwadaghat of River Narmada
Jyoti Sharma1 , Alka Parashar1 , Pratibha Bagare1 and Imtiyaz Qayoom2 *
1
Faculty of Fisheries,
Sher e Kashmir University of Agricultural Sciences and Technology of Kashmir,
Rangil,
Jammu and kashmir
India
http://dx.doi.org/10.12944/CWE.10.1.24
Copy the following to cite this article:
Sharma J, Parashar A, Bagare P, Qayoom I. Phytoplanktonic Diversity and Its Relation to Physicochemical Parameters of Water at Dogarwadaghat of River Narmada. Curr World Environ 2015;10(1) DOI:http://dx.doi.org/10.12944/CWE.10.1.24
Copy the following to cite this URL:
Sharma J, Parashar A, Bagare P, Qayoom I. Phytoplanktonic Diversity and Its Relation to Physicochemical Parameters of Water at Dogarwadaghat of River Narmada. Curr World Environ 2015;10(1). Available from: http://www.cwejournal.org/?p=8544
Download article (pdf) Citation Manager Publish History
Plankton occupies the first link in the food chain and hence forms an important source of food for large aquatic animals. The primary producers are known to contribute significantly to the biological productivity of a water body besides mitigating the carbon cycle by photosynthesis and help to regulate temperature of the area of their prevalence. These are very sensitive to environment they live in and any alteration in the water system leads to the change in their communities in terms of tolerance, abundance, diversity and dominance in the habitat (Amarsinghe and Viverberg, 2002). Phytoplankton are possibly the most important group of organisms on earth generating most of the oxygen and also produce vegetative matter required at various links in a food chain. Wu (1984) has described a relation between aquatic organisms to the degree of pollution and introduced the concept of bio-indicators of pollution in their saprobic system. However, excessive growth and accumulation of phytoplankton as blooms lead to destruction of any water body resulting in dire consequences. Over the last few decades, there has been much interest in the processes influencing the diversity, distribution and development of phytoplankton communities (Bhosale, et al., 2010; Achary, et al., 2010; Negi and Rajput, 2011) primarily in relation to physico-chemical factors (Akbayet al., 1999 and Achary, et al., 2010). Study of physico-chemical parameters is basic tool that contributes in making up of the ecosystems and determine the tropic dynamics of the water body. The change in water quality tends to change the living conditions especially in the number, diversity and distribution of the biota of the ecosystem (Sharma and Singh, 2013). Phytoplankton are the productive base of the food chain in freshwater ecosystems and healthy aquatic ecosystem is dependent on its physical, chemical and biological characteristics (Venkatesharaju et al., 2010). Therefore, the present study was undertaken to assess the spatial diversity of phytoplankton community of river Narmada at Dongarwada and its correlation with the physiochemical parameters of the water body.
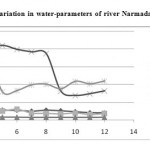 |
Figure 1: Showing monthly variation in water-parameters of river Narmada at Hoshangabad (March 2010-February 2011) Click here to View figure |
Material and Methods Study Area
Narmada originates from Amarkantak hill in shahdol district of Madhya Pradesh is known for crystal clear water. Biological production in any aquatic body gives a direct correlation with its physico-chemical status. Hoshangabad town earlier called Narmadapur falls within the geographical coordinates of +220 44’40’17” and +770 40’52.66” and famous for its beautiful ghats and is situated about 100 km away from capital city, Bhopal. Water samples were collected at Dongarwada site in Hoshangabad from March 2010 to February 2011. The investigation period was divided into four seasons i.e. summer, monsoon, post-monsoon and winters.
Physico-Chemical Analysis
Water samples were collected in the morning hours between 9 to 11 AM, in polythene bottle. The samples were immediately brought to laboratory for the estimation of various physico-chemical parameters. Water temperature, pH and turbidity were recorded on spot at the time of sample collection, by using thermometer, pocket digital pH meter and turbidity meter. The samples were stored in 4oC. Total hardness (TH) and alkalinity was analysed using standard procedures in the laboratory by using methods as prescribed by APHA (2002) and Trivedy and Goel (1986).
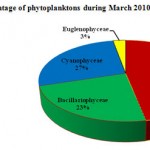 |
Figure 2: Percentage of phytoplanktons during March 2010-February 2011 Click here to View figure |
Biological Analysis of Phytoplanktons
Samples for plankton analysis were collected once in a month from for a period of one year from March 2010 to February 2011. The samples were collected following Welch (1952), Wetzel (1975) and Adoni (1985) as close to the water surface as possible. 100 l of water filtered through plankton net having mesh size of 60 microns and allowed to settle down for 24-48 hours. The samples were preserved in Lugol’s Iodine solution and further concentrated to approximately 30 ml with 4% formalin. The phytoplankton were identified with the help of keys given by Prescott (1982), Agarkar (1975) and Desikachary (1959) .Counting of the individual plankton was done by “Lac Keys” dropping method (1935) using the formula:-

N –No. of plankton counted in 0.1ml concentrate C- Total volume of concentrate in ml. Y-Total volume of water filtered for sample in litres. The data generated in present study was subjected to quantitative analysis of parameters using Microsoft past software version 3.0.2.
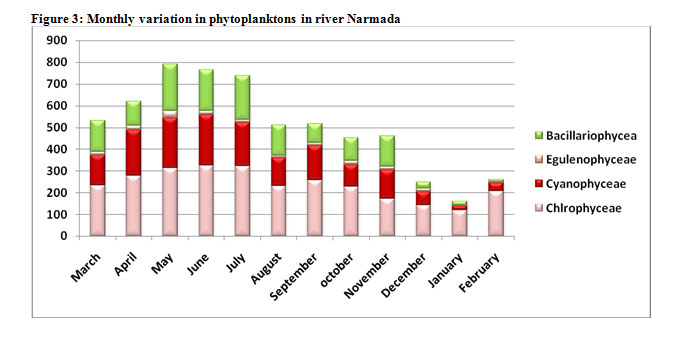 |
Figure 3: Monthly variation in phytoplanktons in river Narmada Click here to View figure |
Results and Discussion Physico-Chemical Parameters
In present investigation, the mean temperature of the water body ranged from 26.183 ± 3.720. Water temperature is of enormous significance as it regulates various abiotic characteristics and biotic activities of an aquatic ecosystem (Ishaq et al., 2013). The lowest water temperature was recorded in the month of February (20.1ËšC) and highest in May (31.2ËšC). pH marked a fluctuation from 7.3 in January to 8.9 in June with lower value of pH was observed during winters because of low temperature and photosynthetic activities. Change in pH concentrations have a definite impact on aquatic life by altering other aspects of water chemistry e.g. low pH levels can increase the solubility of certain heavy metals. This allows the metals to be more easily absorbed by aquatic organisms. The mean pH values ranged from 7.831 ± 0.490. Turbidity concentration was highest in monsoon with 30.2 NTU in August and lowest 15.2 NTU in January. Turbidity was highest in monsoon and low in winters with mean values ranging from 19.617 ± 4.113. It is attributed to the addition of sand particles in river waters due to monsoon rains. Similar findings were also recorded by Tali et al., 2012 who also observed fluctuations of turbidity in river Narmada at Maheshwar dam. Alkalinity of water is its capacity to neutralize a strong acid and is characterized by presence of all hydroxyl ions capable of combining with hydrogen ions (Koshy and Nayar, 2000).Alkalinity ranged between 69 –210 mg/l with maximum value in July (210 mg/l) and minimum in December (69 mg/l).Alkalinity was highest in monsoon and low in winters but no regular trend was observed with mean values of 136.667 ± 55.849. This might be due to the photosynthetic activities of the algae.Tali et al. (2012) observed the value of alkalinity varied from 80 mg/l to 240 mg/l from April to September in river Narmada. Total hardness varied from 79 – 196 mg/l highest peak being observed in the month of May (196 mg/l) and lowest in July (79 mg/l). Total hardness was highest during summer months and lower in monsoon that can be attributed to due to higher temperature level which includes concentration of salts by excessive evaporation. The mean value of total hardness was recorded 125.750 ± 44.785 (Fig. 1) showing variation in water parameters of river Narmada at Hoshangabad, Madhya Pradesh.
Phytoplankton
Plankton population largely depends on the physico-chemical characteristic of a water body. Phytoplankton showed variations in their abundance during different months of the year. In river Narmada four groups of phytoplankton Chlorophyceae, Bacillariohyceae, Cyanophyceae, Euglenophyceae were recorded throughout the year. Seasonally maximum number of phytoplankton was observed during summer and lowest in winters with mean significant values of 235.583 ± 67.721, 116.667 ± 68.901, 138.167 ± 72.902 and 14.083 ± 8.490 for Chlorphyceae, Bacillariophyceae, Cyanophyceae and Euglenophyceae respectively. This variation may be due to progressively increasing water temperature and nutrients in water that are responsible for high amount of phytoplanktons growth during the summer season. Tyor and Deepti, 2012 also reported that phytoplankton grow and multiply best during summer months when the temperature is high and having longer photoperiod. The temporal succession of phytoplankton groups were noticed as Chlorophyceae>Cyanophyceae>Bacillariophyceae>Euglenophyceae. 27 species were identified of which Chlorophyceae were found most dominating having 2,827(47 %) taxa followed by Bacillariophyceae with 1400 (23 %) taxa, Cyanophyceae having 1658 (27 %) taxa and Euglenophyceae with 169 (3 %). (Fig. 2) shows percentage compositions of phytoplankton in river Narmada. The result indicated that phytoplankton was more during summers and low in winters and rainy seasons but no regular trend was observed. Our findings are in agreement to Dhimdhime et al., 2012; Suresh et al., 2013 and Chergui et al., 2013 who observed the highest phytoplankton concentration during summer months. The dominant group in each family are listed in (Table 1) and (Fig. 3) showing monthly variation in phytoplankton in river Narmada. Sharma et al., 2011 concluded the same results seasonal fluctuation in abundance of phytoplankton in river Narmada.Jafari and Alavi, 2010 observed similar result from Talar River Iran and concluded that phytoplankton appears and disappears without regularity.Murugesan and Sivasubramanian, 2008 observed enhanced growth of Chlorophytes during summer months. Rise in temperature during summers increase the rate of decomposition and also due to evaporation water becomes nutrient rich resulting in higher concentration of phytoplankton while low density during monsoon season can be attributed to heavy floods.
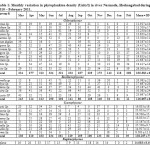 |
Table1: Monthly variation in phytoplankton density (Units/l) in river Narmada, Hoshangabad during March 2010 – February 2011. Click here to View table |
Biotic Indices
Quantifying biodiversity is one of the most complicated aspects of biodiversity (Gaston and Spicer, 1998). The goal of using multiple indices is an attempt to describe the diversity of an ecosystem as accurately as possible. These indices attempt to define biodiversity in many different ways though most indices use a combination of number of species and the degree of difference between those species (Gaston and Spicer, 1998).
In the present study, four diversity indices were applied including Shannon index, Simpson index, Margalef index and Evenness index. (Table 2) showing season wise numeric data of phytoplankton in river Narmada. Simpson's diversity is one of a number of diversity indices, used to measure diversity. It takes into account the number of species present as well as the relative abundance of each species. In present study, Simpson index varied from 0.6622 for Chlorophyceae and 0.6202 for Euglenophyceae. Value of Simpson was highest in summer season. Shannon index ranged from 1.092 in summer for Chlorophyceae to 0.37 for Euglenophyceae in winters.
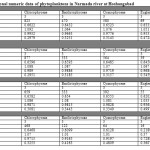 |
Table 2: Seasonal numeric data of phytoplanktons in Narmada river at Hoshangabad Click here to View table |
Species evenness refers to how close in numbers each species in an environment. Mathematically it is defined as a diversity index, a measure of biodiversity which quantifies how equal the community is numerically. The value of evenness diversity index was between 0.9932 for Chlorophyceae in summer to 0.7288 for Euglenophyceae in winters. In present study for Margelef index highest values was present for Euglenophyceae (0.5459) in monsoon and lowest values for Chlorophyceae (0.2951) in monsoon respectively. It indicates that highest diversity was found for Chlorophyceae as compared to others.
The various diversity index used in present study gives species diversity of area studied. Diversity indices used in study provide important information about rarity and commonness of species in the area studied. The Shannon index gives information on statistic index, which means it assumes that all species are represented in a sample and that they are randomly sampled whereas Simpson index is a dominance index that are used mainly to quantify the biodiversity of habitat and gives more weight to common or dominant species. Margalef index is used to estimate the number of species to calculate diversity. The ability to quantify diversity in this way is an important tool to understand diversity of studied area.
The Relationships Between Phytoplankton and Physico-Chemical Parameters
Abiotic factors exert a considerable influence on phytoplankton abundance and diversity (Das et al., 1996). The study of correlation between water parameters and phytoplankton is useful in gaining basic knowledge of trophic status of a water body. In present study,the correlation between the phytoplankton and the physico-chemical variables in the surface water at the station was explored. The factors correlating with the composition of phytoplankton were water temperature, pH, turbidity, alkalinity and total hardness. Our result showed that there exist a positive correlation between phytoplankton and different water parameters thus indicating that the density of phyto-plankton is dependent on different abiotic factors either directly or indirectly. (Table 3) showing co-relation matrix of physico-chemical parameters and phytoplanktons of river Narmada at Hoshangabad from March 2010 to February 2012.
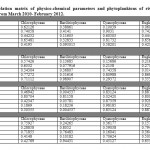 |
Table 3: Co-relation matrix of physico-chemical parameters and phytoplanktons of river Narmada at Hoshangabad from March 2010- February 2012. Click here to View table |
There are many detailed descriptions of phytoplankton succession being correlated with changes in environmental parameters particularly temperature, light, nutrients availability and mortality factors such as grazing and parasitism (Roelke and Buyukates, 2002).
According to Cabecadas and Brogueira, 1987 the growth and photosynthesis of algae are influenced by the pH and alkalinity of water. Pandey et al., 1995 observed a positive correlation between pH, dissolved oxygen, bicarbonate, phosphate and transparency. They reported a positive correlation between pH, dissolved oxygen, transparency and Chlorophyceae. Bhat and Pandit, 2005 found a close relationship between physico-chemical characters of water with growth and abundance of phytoplanktons. Senapati et al., 2001 also observed positive correlation between certain water parameters and phytoplankton from a semi-lentic water body at Burdwan West Bengal. Sharma and Singh, 2013 observed positive correlation of phytoplankton with water parameters. Suresh et al., 2013 studied a co-relation between physico-chemical parameters with phytoplankton and observed significant results.The diversity index used in present study for phytoplankton analysis would be an important step towards study of stress on biological data due to water parameters of the selected area of study.
Acknowledgment
The authors are thankful to M.P. Council of Science and Technology, Nehru Nagar, Bhopal for providing necessary funding to carry out the work. We also extend our gratitude to the Department of Zoology, Sarojini Naidu Government Girls P.G. (Auto.) College, Bhopal for providing all the necessary facilities for conducting this research work.
References
- A.P.H.A. 2002. Standard method for examination of water and waste water, American Public Health Association Inc. New York 22nd Ed.
- Achary, S., Sahu, M., Mohanty, G., Samatara, A. K., Panigrahy, M. K., Selvanayagam, S. N., Satpathy, K. K., Prasad, M. V. R., and Panigrahy, R. C. 2010. Phytoplankton abundance and diversity in the Coastal waters of Kalpakkam, east coast of India in relation to the environmental variables. The Bioscan. 2: 553-568.
- Adoni, A. D. 1985. Work Book on Limnology. Pritibha Publication, Sagar (MP) India.
- Agarkar, M. S. 1975. Ecology of Algae of Bhopal. Ph.D. Thesis of A.P.S. University, Rewa, India.
- Akbay, N., Anul, N., Yerti, S., Soyupak, S. and Yurteri, C. 1999. Seasonal distribution of large phytoplankton in Keban dam reservoir. Plankton Research. 21(4): 771-787.
- Amarsinghe, B. P. and Viverberg, J. (2002). Primary production in a tropical reservoir in Sri-Lanka. Hydrobiologia. 487: 85-93.
- Bhat, Samin, A. and Pandit, A. K. 2005. Phytoplankton Dynamics in Anchar Lake, Kashmir. In: Ecology of Planktons. Ed. Arvind Kumar Daya Publishing House, Delhi pp.190-208.
- Bhosale, J. L., Dhumal, S. N. and Sabale, A. B. 2010. Phytoplankton diversity of in four lakes of Satara District, Maharashtra state. The Bioscan. 5(3): 449-454.
- Cabecadas, G. and Brogueira, M. J. 1987. Primary production and pigments in three low alkalinity connected reservoirs receiving mine wastes. Hydrobiology. 144:173-182.
- Chergui, F. H., Errahmani, M. B., Benouaklil, F. and Hamaidi, M. S. 2013. Preliminary study on physico-chemical parameters and phytoplanktons of Chiffa river (Blida,Algeria). .Journal of Ecosystems:1-9.
- Das, P. K., Michael, R. G. and Gupta, A. 1996. Zooplankton community structure in Lake Tasek, a tectonic lake in Garo Hills, India. Tropical Ecology. 37: 257–263.
- Desikachary, T. V. 1959. Cyanophyta, I.C.A.R., New Delhi.
- Dhimdhime, S. D., Waghmare, N. V., Shinde, V. D. and Ambore, N. E. 2012. Plankton study of Siddheswar Dam of Hingoli district, (M.S.) India. International Multidisciplinary Research Journal. 2(5):15-18.
- Gaston, K. J., and Spicer, J. I. 1998. Biodiversity: An Introduction. Oxford: Blackwell Science Ltd. House, Delhi, 57-65.
- Ishaq, Fouzia, Khanna, D. R. and Khan, Amir. 2013. Physico-chemical and phytoplanktonic characteristics of river Tons at Dehradun (Uttarakhand), India. Journal of Applied and Natural Science. 5(2): 465-474
- Jafari, N. and Alavi, S. S. 2010. Phytoplankton community in relation to physico-chemical characteristics of the Talar River, Iran. Journal of Applied Sciences and Environmental Management. 14(2):51-56.
- Koshy, M. and Nayar, T. V. (1999). Water quality aspects of River pamba. Polluion Research. 18(4): 501– 510.
- Murugesan, S. and Sivasubramanian, V. 2008. Fresh water green algae from Porurlake,Chennai. Indian Hydrobiology. 11(1):133-140.
- Negi, R. K. And Rajput, A. 2011. Diversity of phytoplankton in the freshwater streams of Kumaon Himalaya of Uttarakhand state. The Bioscan. 5(1&2): 15-19.
- Pandey, B. N., Mishra, A. K., Das, P. K. L. and Jha, A. K. 1995. Studies on hydrological conditions of river Saura in relation to its impact on Biological health. In: Recent Research in aquatic environment. Ed. V.B. AshutoshGoutam and N.K.Aggarwal. Daya Publishing house.
- Prescott, G. W. 1982. Algae of the Western Great lakes Areas. Otto Koeltz Science Publishers. Germany, 662-962.
- Roelke, D. and Buyukates, Y. 2002. Dynamics phytoplankton succession coupled to species diversity as a system level tool for study of Microcystis population dynamics in eutrophic lakes. Limnology and Oceanography.47(4): 1109-1118.
- Senapati, T., Ghosh, S. and Mandal, T. 2011. Variation in phytoplankton diversity and its relation with physico chemical parameters of a semi lentic water body of Golapbag, West Bengal, India. International Journal of current research. 3(7) 53-55.
- Sharma , S., Solanki, C. M., Sharma, D and Tali, I. 2013. Population dynamics of Planktons in river Narmada at Omkareshwar.International Journal of Advanced Research. 1(1):11-15.
- Sharma, D. K. and Singh, R. P. 2013. Correlation between physico-chemical parameters and phytoplanktons of Tighra reservoir, Gwalior, Madhya Pradesh. International Journal of Security and Networks.4(1): 90-95.
- Sharma, S., Vishwakarma, R., Dixit, S. and Jain, P. 2011. Evaluation of water quality of Narmada river with reference to physico-chemical parameters at Hoshangabad city, MP, India. Research .Journal of Chemical Sciences. 1(3):40-48.
- Suresh, B., Manjappa, S. and Puttaiah, E. T. 2013. Dynamics of phytoplankton succession in Tungabhadra River near Harihar, Karnataka (India). Journal of Microbiology and Antimicrobials. 5(7):65-71.
- Tali, I.; Pir, Z., Sharma, S.; Mudgal, L. K., Siddique, Anis. 2012. Evaluation of water quality: Physico chemical characteristics of River Narmada at Madhya Pradesh, India. Researcher. 4(5).
- Trivedy, R.K. and Goel, P.K. 1986. Chemical and biological methods for water pollution studies, Environmental Publication, Karad, India.
- Tyor, A. K. and Deepti, C. 2012. Survey and study of phytoplankton ecology in Sukhna Lake, Chandigarh, (India). International Journal of Applied Biology and Pharmaceutical Technology. 3(2):229–238.
- Venkatesharaju, K., Ravikumar, P., Somashekar, R. K. and Prakash, K. L. 2010. Physico-chemical and Bacteriological Investigation on the river Cauvery of Kollegal Stretch in Karnataka. Journal of Science Engineering and Technology. 6(1):50-59.
- Welch, P. S. 1952. Limnological Methods. Blakiston Co; Philadelphia. Pa.
- Wetzel RG 1975. Limnology Sainders college Publ. Philedelphia. 743.
- Wu, J. T. 1984. Phytoplankton as a bioindicator of water quality in Taipei. Botanical Bulletin of Academia Sinica. 25-214.


