Site Suitability Analysis for Willow Tree Plantation in Uttarakhand Using Gis
Puranik Harsh Vardhan1 * , Nain A. S1 and Murty N S1
http://dx.doi.org/10.12944/CWE.10.1.36
Copy the following to cite this article:
Vardhan P. H, Nain A. S, Murty N S. Site Suitability Analysis for Willow Tree Plantation in Uttarakhand Using Gis. Curr World Environ 2015;10(1) DOI:http://dx.doi.org/10.12944/CWE.10.1.36
Copy the following to cite this URL:
Vardhan P. H, Nain A. S, Murty N S. Site Suitability Analysis for Willow Tree Plantation in Uttarakhand Using Gis. Curr World Environ 2015;10(1). Available from: http://www.cwejournal.org/?p=8390
Download article (pdf) Citation Manager Publish History
Most of the plant species in India are exploited for their commercial values with least or no consideration for their sustainable exploitation. Willow is one such species on which several local level livelihoods are dependent. As a plant, willow is used for in the manufacture of boxes, broom, cricket bats, cradle broads, chairs and other furniture, dolls, flutes, poles, sweat lodges, toys, turnery, tool handles, veneer, wands and whistles. In addition, tannin, fibre, paper, rope and string can be produced from the wood. The leaves and barks of the willow tree have been mentioned in ancient texts from Assyria, Sumer and Egypt as a remedy for aches and fever, willows contains salicin a substance that chemically resembles aspirin (Breasted, 2007). Willow is also used for bio-filtration, ecological wastewater treatment systems, hedges, landscaping, phytoremediation stream bank stabilization (bioengineering), slope stabilization, soil erosion control, shelter belt and windbreak, soil reclamation tree and wildlife habitat. Willow is grown for biomass or bio fuel, in energy forestry systems, as a consequence of its high energy in-energy out ratio, large carbon mitigation potential and fast growth (Matthew, 2008). In particular, GIS has been used extensively for spatial analysis and land suitability as GIS functions could be employed for several forms of information including point, line and area. The geospatial technology can be very efficiently used in analyzing the suitability of agricultural crops, which will not only save the huge cost of experimentation but also save precious time (Harasheh, 1994). Keeping this in view present study aimed to use GIS to classify the suitability of land with integrated information for Willow plantation. The spatial information resulted from this study could be utilized the wastelands for plantation which will not only help to increased income of villages but also minimize environmental problems.
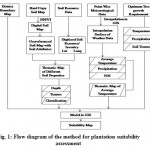 |
Figure 1: Flow diagram of the method for plantation suitability assessment Click here to View figure |
Materials and Methods Study Area
The area of present study has been considered the state of Uttarakhand which is surrounded by Himachal Pradesh in the north-west and Uttar Pradesh in the south and shares its international borders with Nepal and China. This area is located between latitude 28º43'N and 31º27'N and longitude 77º34'E and 81º02'E.
Soil
The soil information and maps of the region were acquired from NBSSLUP, Nagpur. Entire state of Uttarakhand is covered in two maps at a scale of 1:500000. The maps were scanned using roller scanner and were mosaicked (combined) using the pixel base algorithm embedded in ENVI image processing software after rotating, resizing and contrast enhancement. The mosaicked map were georeferenced with existing georeferenced district boundary map using map to map registration option available in ENVI image processing software after collection of ample Ground Control Points (GCPs). The registered raster soil map was exported in imagine image (.img) compatible format so that it could be directly viewed in GIS software (Arc View 3.2a). The map was imported in Arc View software and soil polygons were digitized on line. The soil unit boundaries of the map were digitized very carefully using the polygon feature. Then the soil attribute data were added to the project. The soil attribute table comprised of different columns of fields like surface form, parent material, soil depth, mineralogy, particle size, calcareous, soil temperature, soil reaction, drainage, surface texture, slope class, erosion class, salinity, surface stone, flooding etc.
Climatic Data
The data of all weather stations falling within the geographical boundaries of Uttarakhand were collected. Additionally, the data of meteorological observatories of adjoining states of Uttarakhand were also used in the present study. Data collected from different weather stations which located in Uttarakhand like VPKAS Almora, ARIES Nainital, DEBER Haldwani, CRC Pantnagar, College of Forestry and Hill Agriculture, Ranichauri, FRI Dehradun and data of some stations covered in UPROBE project of IIT, Roorkee were also considered, while some other stations, data were taken from published IMD periodicals. The complete list of stations of Uttarakhand with number of years, mean and CV% of available parameters has been appended in the Table.1, while the climate normal’s of other stations computed by IMD on the basis of thirty years weather data and published in IMD periodicals have been presented in Table 2. The geocordinates of all the weather stations were collected recorded with the help of GPS or were collected from literature / published maps. Weather data with geocordiantes were stored in table and saved as a txt file. Text file was added in GIS environment and thereafter was added to GIS view using “add event theme” option. The “spatial extension” was loaded in order to use the interpolation functions available in GIS environment. Inverse Distance Weightage (IDW) interpolation technique was used to construct the thematic layers of the different weather parameters. Interpolated weather data provides values of weather parameters on flat surface, however the topography of Uttarakhand is highly variables. Therefore weather surface was corrected using Digital Elevation Model (DEM) of Uttarakhand. DEM provides a digital representation of a portion of the earth’s surface terrain over a two dimensional surface. The DEM was used for constructing temperature surfaces keeping in view the environmental lapse rate.
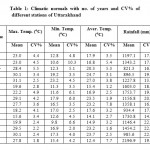 |
Table 1: Climatic normals with no. of years and CV% of different stations of Uttarakhand Click here to View table |
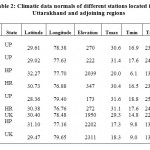 |
Table 2: Climatic data normals of different stations located in Uttarakhand and adjoining regions Click here to View table |
The environmental lapse rate which describes that with increasing elevation by 1 km the temperature will decrease by 6.5ºC was used to correct the interpolated temperature surface using following equation.
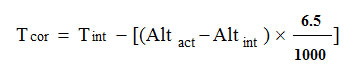
where, Tcor = Temperature corrected in °C Tint = Temperature interpolated in °C. Altact= Actual altitude in m Altint = Interpolated altitude in m
Soil and Climatic Requirement of Willow
The optimum climatic requirement (i.e. maximum, minimum and optimum temperature, rainfall) and soil type for fast growing tree species are essential in order to check the spatial suitability of plant in a given region. This information was collected from the published literatures and is presented in Table 3.
Table 3: Soil and climatic requirement for Willow growth
|
Tree Species |
Max. Temp. (ºC) |
Min. Temp. (ºC) |
Optimum Temp. (ºC) |
RF (mm) |
Soil Type |
|
Willow |
30-40 |
5-10 |
15 to 26 |
600-1000 |
Loamy Clay |
Computation of PDI
We used the Precipitation Distribution Index developed by Nain et al. (2010). The precipitation distribution index (PDI) was calculated with the help of following formula:
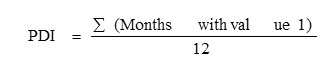
Where, PDI = Precipitation Distribution Index 1 = the value of a particular month when the ration between P/PET is >0.3, the value of month is 0 when the ratio between P/PET is < 0 P = Precipitation (mm) PET= Potential Evapotranspiration (mm) PET was calculated using Thornthwaite method. The formula was found suitable for calculation of PET by different researchers (Michael, 2008) in the various parts of the world.
Thornthwaite proposed the following formula for monthly potential evapotranspiration:
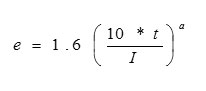
where, e= unadjusted potential evapo-transpiration (cm/month) (month of 30 days each and 12 hours day time). t= mean air temperature (ºC) I= annual or seasonal heat index, the summation of 12 values of monthly heat indices (i) when,
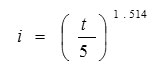
a= an empirical exponent computed by the equation,
a = 0.0000006751*(I3)-0.0000771*(I2) +0.01792*I+0.49239
The unadjusted values of “e” are corrected for actual day light hours and days in a month. For daily computation, the formula is modified as:
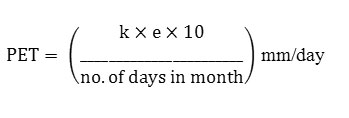
Where, k = adjustment factor for which table values are given by Michael (1978). The PDI was computed on point data and later the spatial surface covering entire state of Uttarakhand was generated by developing a relationship between point precipitation and point PDI and later applying the model on the precipitation surface (Fig. 4). PDI surface was divided in 3 classes, which are more suitable, moderate suitable and less suitable (Table. 4). If PDI value is high then it suitable for planting and if it is low then it is less suitable.
Table 4: Table of PDI with suitability classes
|
S.No. |
PDI range (>0.3) |
Suitability class |
|
1 |
0.33-0.55 |
Less Suitable |
|
2 |
0.55-0.75 |
Moderately suitable |
|
3 |
0.75-0.98 |
More suitable |
Model for Suitability Analysis
The methodology of Suitability analysis included the digitization of the map. The soil unit boundaries of the map were digitized very carefully using the polygon feature. Then the soil attribute data were added to the project. The layers of different meteorological parameters were generated using the spatial analyst Extension of ARC-view. Ssuitability model was developed using model builder module available in Arc-View 3.2a GIS. The interpolated data related to climate and soil were= converted in raster format. The reclass function was added and reclasses of data was done. Then all these reclass data were combined to the weighted overlay function and a weighted overlay model was developed. After model was run and suitability map was generated. Weightes given to the different parameters are shown in Table 5 on the basis of their effect on growth of tree. A value has been assigned to the different ranges of parameters on the basis of optimum, minimum and maximum range of parameter as mentioned in the Table 3. The area with value of parameter less than minimum value required by plant and higher value of the parameter than the maximum required by the plant were restricted as no growth of willow is possible in those regions. The optimum range has been assigned value of three (3), while suboptimum range has been assign value of two (2) and sub-suboptimum range has been assigned value of one (1). A suitability map with 5 classes: most suitable, suitable, moderately suitable, less suitable and not suitable was generated and most suitable class was found when all parameters weight age values are highest and other classes, classified on basis of descending values.
Table 5: Weightage percentage given to the parameters
|
S. No. |
Input Theme |
% Info |
|
1 |
Average Temperature |
40 |
|
2 |
Minimum Temperature |
5 |
|
3 |
Precipitation |
20 |
|
4 |
PDI |
25 |
|
5 |
Soil Texture |
10 |
Result and Discussions Thematic Map of Soil
Loamy soils are found in most of the regions of Uttarakhand. However, sandy soils are limited to small pockets of Pithoragarh, Chamoli, Uttarkashi, Rudraprayag, Pauri, Tehri, Haridwar, Dehradun, Udham Singh Nagar, and Champawat and Bageshwar districts. A considerable region of Upper hills of Uttarakhand is snow bound and primarily has frigid soils. The spatial distribution of soil in Uttarakhand has been given in Fig. 2.
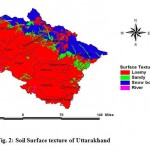 |
Figure 2:Soil Surface texture of Uttarakhand |
Thematic Map of Climatic Parameter
Maximum temperature occurs in the month of June. However, a large area of the state has average maximum temperature of 16.4 oC. The low altitudinal areas of the state including Udham Singh Nagar, Haridwar and parts of Pauri and Nainital record maximum temperature in the range of 33.6 to 39.3ºC during June. Minimum temperature over the state prevails during January. During this month, upper hilly regions of the state experience minimum temperature of -31.5 to -6.7 oC. The low lying areas of the state including, Udham Singh Nagar, Haridwar and parts of Pauri, Dehradun and Nainital recorded a minimum temperature of 8.2 to 13.2oC during January. The upper hilly region records average temperature of -12.6 to 3.8 ºC. The upper part of Uttarkashi, Chamoli, Pithoragarh and a small portion of Tehri-Garhwal, Bageshwar and Rudraprayag constitute this region. However, a large area of the state has an average temperature range of 19.9 to 25.3 ºC. In districts like Udham Singh Nagar, Haridwar and some parts of Nainital, Pauri-Garhwal and Tehri-Garhwal, situated in low altitudinal areas, average temperature ranges between 25.3 to 30.7 ºC (Fig. 3). The maximum amount of rainfall occurs during June to September over Uttarakhand due to southwest monsoon. The precipitation reached its peak in the month of August. In some part of Dehradun precipitation is received in the range of 922 to1035 mm during August. In this month the upper hilly region receives rainfall of 312 to 612 mm. In the state, the lowest precipitation occurs in the month of November.
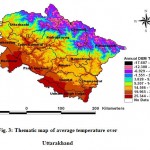 |
Figure 3:Thematic map of average temperature over Uttarakhand Click here to View figure |
Thematic Map of Precipitation Distribution Index (PDI)
The values of PDI for each station were calculated and three distinct regions were identified from the map (Fig. 4) having different PDI ranges. Three classes of PDI values are delineated as high PDI values (0.76-0.97), moderately high PDI values (0.55-0.76) and low PDI values (0.33-0.55). The districts like Nainital, Pithoragarh, Dehradun and Pithoragarh has high PDI values. The moderate PDI values cover most part of the state except upper hilly region. The district like U.S. Nagar, Nainital, Champawat, Pauri Garhwal, Tehri Garhwal, Dehradun, Rudraprayag, Uttarkashi, Chamoli, Bageshwar, Pithoragarh and Haridwar has moderately high PDI values, while upper hilly parts of Uttarakashi, Chamoli, Bageshwar, Pithoragarh, Tehri Garhwal, Haridwar and very minute part of Rudraprayag districs have lowest PDI values.
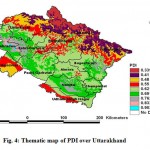 |
Figure 4:Thematic map of PDI over Uttarakhand Click here to View figure |
According to the PDI surface almost entire region of Uttarakhand has the capability to support the growth of fast growing tree species because most part of the state comes under the high and moderately high PDI values except upper hilly regions which has low PDI values and Skelton and frozen soil surface. High and medium water demanding tree species can be grown in high and moderately high PDI values region, while low water demanding tree species in low PDI region.
Suitability Classes of Willow
By using the all parametric information (precipitation, PDI, soil types, average, minimum and maximum temperature) crop suitability model was developed. The model was used to produce the suitability map of willow (Fig. 5) for Uttarakhand.
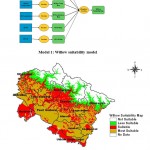 |
Figure 5: Suitability map of Willow Click here to View figure |
Most Suitable and Suitable Zones
Suitable area covers 15654 km2, which has 29.3% of total geographical area of the state. The zone includes parts of U. S. Nagar, Haridwar, Tehri Garhwal, Almora, Champawat, Chamoli, Pithoragarh, Uttarkashi and some part of Dehradun, Bageshwar, Nainital and Pauri Garhwal. Most suitable areas for willow have estimated at 20343 km2 (38%), which includes most portions of Dehradun, Bageshwar, Almora, Pauri Garhwal, Tehri Garhwal, Champawat, Udham Singh Nagar, Pithoragarh and Some part of Uttarkashi and very small portion of Haridwar.
Less Suitable Zones
There was a very weak relation between climatic conditions and requirements of Willow in these areas compared to the first zone. In all climatic requirements was not favourable, so these zones are less suitable for Willow. The area under the zone has 7035 km2 or 13.2%, which includes central and some upper parts of Chamoli, Pithoragarh, Tehri Garhwal, Uttarkashi, Bageshwar, Rudraprayag and some parts of Dehradun districts.
Not Suitable Zones
This zone has considered as areas that are not suitable for Willow because of non-compatibility of climatic and soil conditions in respect to requirement of Willow. The most important factors that limits planting of Willow in these areas have minimum temperature (5-10 0C) and soil type (Skelton surface). The zone includes upper most hilly region of Uttarkashi, Rudraprayag, Chamoli, Pithoragarh, Bageshwar and Tehri Garhwal. This zone has 10453 km2 (19.5%) area. Willow suitability map shows that most of the central parts are most suitable, lower part suitable and less suitable area falls in middle and lower Himalayan hilly region of the state. More weight to temperature has been assign on the basis of literature. This map indicate that some region of temperate areas fall under the suitable and moderate suitable zone. It has possible that some area shows suitability where willow currently not found but it can florish because the climatic conditions have favorable for its growth. Willow has 400 species and climatic requirements (like precipitation, elevation maximum, minimum and optimum temperature) are difference, hence suitable species can be selected for a particular place. However due to adverse climatic conditions in less suitable areas, willow plantations can be avoided. Fischer et al. (2005) used GIS database of climate, soil, terrain and vegetation cover to assess the potential productivity for miscanthus, willow and poplars in countries of Eastern Europe and Northern and Central Asia. The result shows that, the potential for bio-energy production (miscanthus, willow and poplar), both absolute and percentage areas suitable for poplar and willow alone and by poplar, willow and miscanthus combined. In a few countries such as Lithuania, Latvia, Romania, Georgia, Belarus and Azerbaijan, the potential for producing energy from these species amounts to more than one-third of current commercial energy use even when current forests and land potentially highly suitable for cereals are excluded from the assessment.
Conclusion
The present study demonstrates use the available geo-spatial information for the identification of suitable areas for Willow plantations in Uttarakhand. According to the results of the study, it can be concluded that the area classified as most suitability, suitability, less suitability and not suitability occupied 38%, 26.4%, 13.2% and 19.5% of the total geographical area respectively. Uttarakhand has wastelands on considerable geographical area, which is 26% of the total geographical area of state. Thus, it can be recommended that on the basis of the suitability map; the wastelands can be used for Willow plantation. It will not only be beneficial for socio-economic point of view but also enhance the carbon sequestration potential of the land.
Reference
- Matthew, A. J., Casella, E., Tubby, I., Street, N.R., Smith, P., Taylor, G., Yield and spatial supply of bioenergy poplar and willow short-rotation coppice in the UK. New Phytologist 178(2):358–370 (2008).
- Harasheh, E.H., Agricultural Applications of Remote Sensing and Geographic Information System in Landuse and Land Suitability Mapping. AARS, ACRS, Agriculture/Soil, GIS development.net. Pp 1-4 (1994).
- Nain, A.S., Hedge,S., Srivastava, R.K., Puranik, H.V. and Badola, J.C., Suitability analysis for Energy Plantation in Uttarakhand: An Approach based on Remote Sensing and GIS. In: Dissemination Seminor on Enhanced Biomass Production and Energy Conversion for use in Water Scarce Areas of India and Bio-energy: Technology and Business Solutions for the UK and India. IIT, Delhi. p-52 (2010).
- Michael, A.M., Irrigation theory and practice. 2ndEdn.Vikash Publication House. Pp. 768 (2008).
- Fisher, G., Prieler, S. and Velthuizen, H.V., Biomass potential of miscanthus, willow and poplar; results and policy implications for Eastern Europe, Northern and Central Asia. Biomass and Bioenergy. 28: 119-132 (2005).


