Statistical Analysis of Temperature and Rainfall Trend in Raipur District of Chhattisgarh
R. Khavse1 * , R. Deshmukh1 , N. Manikandan1 , J. L Chaudhary1 and D. Khaushik1
1
Department of Agrometeorology,
Indira Gandhi Krishi Viswadhylaya,
Raipur,
492012
Chattisgarh
India
http://dx.doi.org/10.12944/CWE.10.1.38
Copy the following to cite this article:
Khavse R, Deshmukh R, Manikandan N, Chaudhary J. L, Kaushik D. Statistical Analysis of Temperature and Rain fall Trend in Raipur District of Chhattisgarh. Curr World Environ 2015;10(1) DOI:http://dx.doi.org/10.12944/CWE.10.1.38
Copy the following to cite this URL:
Khavse R, Deshmukh R, Manikandan N, Chaudhary J. L, Khaushik D. Statistical Analysis of Temperature and Rain fall Trend in Raipur District of Chhattisgarh. Curr World Environ 2015;10(1). Available from: http://www.cwejournal.org/?p=8437
Download article (pdf) Citation Manager Publish History
The rainfall and temperatures are the most important fundamental physical parameters among the climate as these parameters determine the environmental condition of the particular region which affects the agricultural productivity. Global warming/climate change is one of the most important worldwide issue talked among the scientists and researchers. One of the consequences of climate change is the alteration of rainfall patterns and increase in temperature. According to Intergovernmental Panel on Climate Change (IPCC), 2007 report, the surface temperature of the earth has risen by 0.6 ± 0.2ËšC over the 20th century. Also in the last 50 years, the rise in temperature has been about 0.13 ± 0.07ËšC per decade. As the warming depends on emissions of GHGs in the atmosphere, the IPCC has projected a warming of about 0.2ËšC per decade. Further, surface air temperature could rise between 1.1ËšC to 6.4ËšC over 21th century. In India, the climate change is expected to adversely cause changes in precipitation, temperature, monsoon timing and extreme events (Fulekar and Kale 2010). Due to global warming, precipitation amount, type and timing are changing or are expected to change because of increased evaporation, especially in the tropics (Ritter, 2006). The pattern and amount of the rainfall are among the most important factors that affect agriculture production. Agriculture is vital to India’s economy and livelihood of its people. Agriculture is contributing 21% to the country’s GDP, employing 56.4% of the total workforce and supporting 600 million people directly and indirectly (Beena Shah 2010). In India despite recent progress in industrlization, the soundness of economy is significantly dependant upon the gross production of agricultural commodities and agriculture is the mainstay of millions of teeming population with crops pre-dominantly dependant upon natural rainfall. Excepting the south-eastern part of the peninsula and Jammu and Kashmir, the south west monsoon (June – Sept.) is the principle source of rain in the entire country. During monsoonal period more than 75% of annual rainfall is received over a major portion of the country. India’s economy has traditionally been agricultural in nature and excess climate anomalies, deficient and flooded rainfall years have a dramatic impact on the economy as well as on the living conditions of the inhabitants of the affected regions (Parthasarthy et al. 1988). The green revolution on technology has increased the rice and other foodgrain production and productivity substantially. The trend analysis of rainfall recorded for long term periods provides information about rainfall patterns and variability. The main objective of this paper is to analyse the variability and trend of rainfall and temperature records of Labandi observatory (IGKV, Raipur).
Data and Methodology
The monthly rainfall, mean monthly maximum temperature data during 1971-2013 for (43 years) have been collected for the Labhandi observatory from Dept of Agrometeorology, Indira Gandhi Krishi Vishwavidyalaya, Raipur. The yearly averages were calculated from the monthly readings which are analyzed. Trend is defined as the general movement of a series over an extended period of time or it is the long term change in the dependent variable over a long period of time (Webber and Hawkins, 1980). Trend is determined by the relationship between the two variables as temperature and time, rainfall and time. The statistical method such as regression analysis and coefficient of determination R2 are used for the significance of trend of temperature and rainfall. The trend were derived and tested by Mann-kendall 1945 trend test and slope of the regression line using the least squares method. The mean, standard deviation (SD) and coefficient of variation (CV) of rainfall and temperatures have been calculated to analyse.
The Mann-Kendall Test for Trend
The Mann-Kendall test is a non-parametric test for identifying trends in time series data. The test was suggested by Mann (1945) and has been extensively used with environmental time series (Hipel and McLeod, 2005). The test compares the relative magnitudes of sample data rather than the data values them. One benefit of this test is that the data need not confirm to any particular distribution. Let X1, X2………. Xn represents n data points where Xj represents the data point at time j. Then the Mann-Kendall statistic (S) is given by S=Σ Σ sign (Xj- Xk), j=2,3….n; k=1,2…..j-1 Where: sign (Xj-Xk) = 1 if Xj-Xk >0 = 0 if Xj-Xk =0 = -1 if Xj-Xk <0 A very high positive value of S is an indicator of an increasing trend, and a very low negative value indicates a decreasing trend. However, it is necessary to compute the probability associated with S and the sample size, n, to statistically quantify the significance of the trend. For a sample size >10, a normal approximations to the Mann-Kendall test may be used. For this, variance of S is obtained as, V(S) = [n (n-1) (2n+5) - Σtp(tp-1)(2tp+5)] /18, p=1,2…..q Where tp is the number of ties for the pth value and q is the number of tied values. Then standardized statistical test is computed by: Z=S-1/√V(S) if S>0, =0 if S=0, =S+1/√V(S) if S<0 The presence of a statistically significant trend is evaluated using Z value.
Study Area
Raipur is situated in East Central part of Chhattisgarh at latitude of 21016’ N, longitude 81036’ E and altitude 289.5 m above mean sea level. The climate of Raipur is falling under sub-humid with mean annual rainfall of about 1489 mm out of which 90 per cent (1348 mm) is received during monsoon (June to September). During rabi, (December to February) only 8 mm of rainfall is being received on an average. The maximum temperature ranged from 24.4 to 42.6 0C and minimum temperature ranged between 10.0 to 27.50C respectively.
Trend Analysis of Monthly Mean of Maximum Temperature (MMAX)
The trends of monthly mean maximum temperature over different years were obtained using linear regression best fit lines. The linear regression trends with their linear regression equations and coefficient of determination for all the months from January to December are represented in Figure-1 and summarized in Table-2. It is evident from figures that monthly mean temperature have increased significantly for all the months except the months of April and October for which a very weak decrease in mean maximum temperature is observed. This implies that at Labandi Raipur station district the highest increase in temperature occured in December (0.02560C) and has increased by 1.1008 0C during 1971-2013 period.
Trend Analysis of Annual Mean of Monthly Maximum Temperature (MMAX)
The annual mean of monthly maximum Temperatures (MMAX) observed an increasing trend having an annual increasing of 0.010 0C per year, as represented in figure 2. This implies that at Labandi Raipur station annual mean maximum temperature has increased by 0.4558 0C during 1971-2013. The statistical summary of maximum temperature for all months is finalized in Table-1. coefficient of variation for mean temperature for Raipur is highest in the month of November and it is observed as 6.09% whereas it is lowest in the month of September and it is 2.18%. This means that mean temperature is most stable in the month of September and least stable in the month of November for the Raipur district. The coefficient of variation for TMRF observed highest in the month of December and it is 299 % whereas coefficient of variation is minimum for the month of August and it is 37 % for the Raipur district. This shows that rainfall is more stable in the month of August and is more variable in the month of December.
Table 1: Statistical summary of monthly mean temperatures.
|
Month |
Mean |
SD |
CV % |
|
Jan |
19.4 |
1.07 |
5.49 |
|
Feb |
22.1 |
0.96 |
4.34 |
|
Mar |
26.5 |
0.97 |
3.64 |
|
Apr |
31.2 |
0.94 |
3.02 |
|
May |
34.2 |
1.29 |
3.77 |
|
Jun |
31.6 |
1.65 |
5.20 |
|
Jul |
27.7 |
0.74 |
2.67 |
|
Aug |
27.1 |
0.61 |
2.25 |
|
Sep |
27.5 |
0.60 |
2.18 |
|
Oct |
26.0 |
0.73 |
2.82 |
|
Nov |
22.2 |
1.36 |
6.09 |
|
Dec |
19.3 |
1.09 |
5.62 |
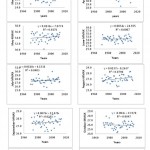 |
Figure 1: Linear regression trends of monthly mean of maximum temperatures. Click here to View figure |
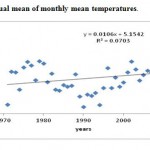 |
Figure 2: Trend of annual mean of monthly mean temperatures. Click here to View figure |
Table 2: Linear Regression Equations of Monthly Mean Temperatures for all the Months.
|
Month |
Regression line |
R² |
|
Jan |
y = 0.0076x + 4.2394 |
R² = 0.008 |
|
Feb |
y = 0.0165x - 10.745 |
R² = 0.0465 |
|
Mar |
y = 0.0123x + 1.926 |
R² = 0.0258 |
|
Apr |
y = -0.0064x + 43.965 |
R² = 0.0073 |
|
May |
y = 0.0136x + 7.0774 |
R² = 0.0176 |
|
Jun |
y = 0.0034x + 24.935 |
R² = 0.0007 |
|
Jul |
y = 0.0118x + 4.1331 |
R² = 0.0403 |
|
Aug |
y = 0.0137x - 0.2637 |
R² = 0.0798* |
|
Sep |
y = 0.0076x + 12.471 |
R² = 0.0251 |
|
Oct |
y = -0.004x + 33.978 |
R² = 0.0047 |
|
Nov |
y = 0.0253x - 28.172 |
R² = 0.055** |
|
Dec |
y = 0.0256x - 31.694 |
R² = 0.0876* |
* Significant at 10% level ** Significant at 5% level *** Significant at 1% level
Table 3: Statistical Summary of Monthly Total Mean Rainfall (TMRF)
|
MONTH |
MEAN (mms) |
SD |
CV% |
|
Jan |
13.7 |
20.25 |
148 |
|
Feb |
14.6 |
14.71 |
101 |
|
Mar |
11.8 |
14.85 |
126 |
|
Apr |
15.8 |
21.41 |
136 |
|
May |
29.9 |
49.19 |
164 |
|
Jun |
186.6 |
133.98 |
72 |
|
Jul |
336.1 |
126.48 |
38 |
|
Aug |
328.5 |
119.86 |
37 |
|
Sep |
195.7 |
134.42 |
69 |
|
Oct |
49.3 |
47.22 |
96 |
|
Nov |
19.1 |
44.76 |
235 |
|
Dec |
4.0 |
12.00 |
299 |
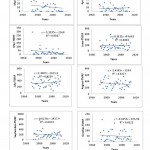 |
Figure 3: Linear regression trends of monthly meanof total mean rainfall. Click here to View figure |
Trend Analysis of Total monthly rainfall (TMRF)
The trends of total mean rainfall over different years were obtained using linear regression best fit lines. The linear regression trends with their linear regression equations and coefficient of determinations for all the months from January to December are represented in Figure 3 and summarized in Table 4. It is evident from figure-3 that TMRF have increased for the months January, April, June, July and December whereas it shows decreasing trend in Feb, March, May, August, September, October and November. This implies that at Labandi Raipur station the highest increase in TMRF occurs in July and has increased by 64.1 mms during the last 1971-2013. The highest decrease in TMRF occurs in August and decreased by 61.8 mm during the same period.
Table 4: Linear Regression Equations of TMRF for all the Months
|
Month |
Regression line |
R² |
|
Jan |
y = 0.0654x - 116.56 |
R² = 0.0016 |
|
Feb |
y = -0.2582x + 528.97 |
R² = 0.0486 |
|
Mar |
y = -0.1899x + 389.99 |
R² = 0.0258 |
|
Apr |
y = 0.0918x - 167.03 |
R² = 0.0029 |
|
May |
y = -1.1195x + 2260 |
R² = 0.0817 |
|
Jun |
y = 0.1111x - 34.661 |
R² = 0.0001 |
|
Jul |
y = 1.4907x - 2633.4 |
R² = 0.0219 |
|
Aug |
y = -1.4385x + 3194 |
R² = 0.0227 |
|
Sep |
y = -0.6236x + 1437.9 |
R² = 0.0034 |
|
Oct |
y = -0.4155x + 876.98 |
R² = 0.0122 |
|
Nov |
y = -0.0144x + 47.682 |
R² = 2E-05 |
|
Dec |
y = 0.041x - 77.653 |
R² = 0.0018 |
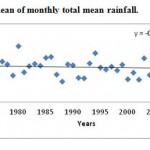 |
Figure 4: Trend of annual mean of monthly total mean rainfall. Click here to View figure |
Trend Analysis of Annual Mean of Total Monthly Rainfall (TMRF)
From the figure 4, the annual mean of total monthly rainfall observed an decreasing trend having an decrease of 0.188 mm per year. This indicates at Labandi station annual TMRF has decreased by 8.08 mms during the last 43 years.
Conclusion
It is observed that monthly mean maximum temperature has increased significantly for August, November and December months at Labandi station. The highest increase in monthly mean temperature has occured in December by 0.0256 °C and has risen by 1.1008 0C during 1971-2013 period. Also TMRF have shown non-significant trends for Labandi station. The highest increase in TMRF occurs in July and has increased by 64.1001 mm whereas highest decrease in TMRF occurs in August and decreased by 61.855 mm (during the last 43 years, 1971-2013 time period). Annual TMRF shows increasing trend which is statistically insignificant at 5% level of significance.
References
- Fulekar, M.H. and Kale, R.K., (2010). “Impact of Climate Change: Indian Scenario,” University News, Vol.48 No.24, June 14-20, 15-23.
- Hipel, K.W. and Mcleod, A.I. (1994) “Time Series Modeling of Water Resources and Environmental Systems,” Electronic reprint of our book originally published http://www.stats.uwo.ca/faculty/aim/1994Book/.
- IPCC “Climate Change-A Synthesis Report, Inter-governmental Panel on Climate Change 2007.
- Mann, H.B. (1945) “Nonparametric tests against trend,’’ Econometrica, 13, pp.245-249.
- Ritter, M.E. 2006, ”The physics environment: an introduction to physical Geography ,”available online at: http://www.stats.uwo.ca/faculty/ritter/geog101/textbook/titel_page .html .
- Parthasarthy, B. A.A. Munot and D.R. Kothawale. 1988. Regression model for estimation of India’s foodgrain production from summer monsoon rainfall. Agricultural and Forest Meteorology 42: 167-182.
- Shah Beena (2010) “Global and National Concerns on Climate Change,” University News,Vol.4. pp.15-23
- Webber, J. and Hawkins, C. 1980. “Statistical Analysis Application to Business and Economics,” Harper and Row, New York.


