Variation in Groundwater Quality with Seasonal Fluctuation in Jharia Coal Mine Region, Jharkhand, India
Binay Prakash Panigrahy1 * , Prasoon Kumar Singh1 , Ashwani Kumar Tiwari1 and Bijendra Kumar1
http://dx.doi.org/10.12944/CWE.10.1.19
Copy the following to cite this article:
Panigrahy B. P, Singh P. K, Tiwari A. K, Kumar B. Variation in Groundwater Quality with Seasonal Fluctuation in Jharia Coal Mine Region, Jharkhand, India. Curr World Environ 2015;10(1) DOI:http://dx.doi.org/10.12944/CWE.10.1.19
Copy the following to cite this URL:
Panigrahy B. P, Singh P. K, Tiwari A. K, Kumar B. Variation in Groundwater Quality with Seasonal Fluctuation in Jharia Coal Mine Region, Jharkhand, India. Curr World Environ 2015;10(1). Available from: http://www.cwejournal.org/?p=8515
Download article (pdf) Citation Manager Publish History
Water is an essential and vital component for our life-support system. Rapidly deleting of groundwater supplies as a consequence of continued population growth and industrialization threaten the quality of many aquifers in India. For evaluating the suitability of groundwater for different purpose, understanding the chemical composition of groundwater is necessary. Further, it is possible to understand the change in quality due to rock-water interaction (weathering) or any type of anthropogenic influence (Todd 1980, Kelly 1940). The definition of water quality is much depending on the desired use of water. Therefore different uses require different criteria of water quality as well as standard method for reporting and comparing result of water analysis (Babiker 2007). Access to safe drinking water remains an urgent necessity, as 30 % of urban and 90 % of the rural Indian population still depends completely on untreated surface or groundwater resources (Kumar et al. 2005). Scarcity of clean and potable drinking water has emerged in recent years as one of the most serious developmental issues in many parts of West Bengal, Jharkhand, Orissa, Western Uttar Pradesh, Andhra Pradesh, Rajasthan and Punjab (Tiwari & Singh 2014). The rate of depletion of groundwater level and deterioration of groundwater quality is of immediate concern in major cities and towns of country (Meenkumari and Hosmani 2003, Dhindsa et al. 2004, Ramakrishnaiah et al. 2009: Jain et al. 2010; Singh et al. 2011; Singh et al. 2012; Singh et al. 2013; Tiwari and Singh 2014, Singh et al. 2014, Tiwari et al. 2014). The objective of this study is to assess groundwater quality with reference to seasonal fluctuation and primarily investigation; an attempt has been made to assess its suitability for drinking and domestic uses and also evaluate of availability of groundwater resources of the area.
Materials and Methods Study Area
Jharia coal mining areas is one of the most important Coal mining areas in India. It is roughly elliptical or sickles – shaped, located in Dhanbad district of Jharkhand lies between latitude 23o39/ N and 23o48/ N and longitudes 86o11/ E and 86o27/ E. It stretches from Chandanpura on the west to Sindri on the east. The main component of the natural drainage in Jharia coalfield (JCF) is the Damodar River. There are eight major streams, a few perennials and the rest intermittent, which drains the JCF from north to south to join the Damodar River. They are Tisra, Chatkari, Katri, Khudia, Jamuniya, Kumari and Bansjora etc. The climate in the Jharia coal mining area is very pleasant during cold weather months starting from November to February. The occasional rain during the hot weather from March to June makes the climate, but from June to October the conditions are not on the whole very unpleasant during October to November. The general climate may broadly be described as the of the tropical monsoon belt. The annual rainfall in Jharia and adjacent region varies from 1197 mm to 1382 mm. This is the most exploited coal mining area because of available metallurgical grade coal reserves. The temperature range in coal filed area varies between 5ºC and 48ºC.
Sample Collection and Preservation
A systematic sampling was carried for the assessment of groundwater quality of Jharia coal mining area. Representative 29 groundwater samples were collected from different mines of Lodna, Bastacolla, Sijua, Western Jharia, Block-II, Barora etc of the study area (Fig 1). The groundwater samples were collected in one litre narrow-mouth pre-washed polyethylene bottles. Prior to each field work polyethylene bottles were washed in the laboratory with dilute hydrochloric acid and then rinsed twice with double distilled water. Suspended sediments were separated from the water samples in the laboratory by using 0.45 µm Millipore membrane filters. The water samples were analyzed for various- Physico-chemical parameters. The sampling and analysis was made following standard method (APHA, 1998).
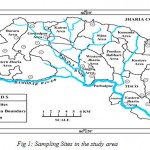 |
Figure 1: Sampling Sites in the study area Click here to View figure |
Result and Discussion Rainfall and Water Table Characteristics
Study area receives more rainfall due to coal dust, which attracts clouds and brings rainfall to the area. Rainfall is the principal method of recharge to groundwater. South west monsoon brings rainfall to this area during the months of June to October mainly. The annual average rainfall pattern from the year 2000 to 2013 has been assessed (Fig 2). The maximum rainfall 2311mm and the minimum rainfall is 921mm.
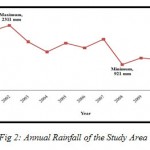 |
Figure 2: Annual Rainfall of the Study Area Click here to View figure |
Comparative Analysis of WLF Using GIS
In comparative analysis, depth to water level data of 29 monitoring wells located in the study area for pre and post-monsoon in the year 2013. Pre-monsoon data of depth to water level had been collected in the month of June and the post monsoon data of depth to water level had been collected in the month of December (Table 1). Data is plotted on thematic contour map it can observed the trend of depth to water level in unconfined aquifers. From the contour map it can be observed that the maximum depth to water level shown by wells in the pre-monsoon is 3.05 to 11.10 mbgl (Fig 3) and minimum in post-monsoon it shows 1.4 to 7.5 mbgl (Fig. 4) in year 2013. The water level fluctuation shows in the year 2013 is 1.29 to 6.9 mbgl (Fig 5). There are six blocks in the Jharia coal field such as Londna, Bastacolla, Kuskunda.BlockII, Barora and western Jharia. The maximum water level fluctuation shows in Bastocalla area and Londna area due to some lithological features which affect groundwater fluctuation. The good recharge of groundwater shows in the eastern Jharia area, which shows less groundwater fluctuation. The Damodar River is the main sources of recharge of the groundwater in the study area. The groundwater is recharged through by cracks, fissure and planes discontinuity. Thus, from above studies, we found that west and some part of the northern part are facing extreme scarcity due to lower availability of groundwater and eastern region of the study area has sufficiently available of groundwater resources.
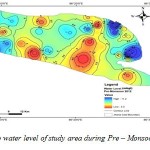 |
Figure 3: Depth to water level of study area |
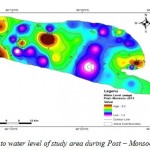 |
Figure 4: Depth to water level of study |
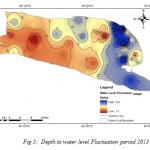 |
Figure 5: Depth to water level Fluctuation period 2013 Click here to View figure |
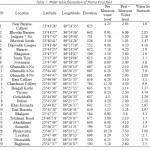 |
Table 1: Water table fluctuation of Jharia Coal field Click here to View table |
Major Ion Chemistry
Among major cations for pre-monsoon, calcium was the dominant ions representing on average 46% of total cations. Magnesium and sodium ions were of secondary importance, representing on average 26% and 23% of total cations, respectively. Potassium was least dominant cation and representing 5% of the total cations (Figure 6). The order of cation for post-monsoon abundance was Ca2+> Mg2+> Na+>K+. However, in pre- monsoon season calcium was the dominant ions representing on average 39% of total cations. Sodium and magnesium ions were of secondary importance, representing on average 29% and 26% of total cations, respectively. Potassium was least dominant cation and representing 6% of the total cations (Figure 7). The order of cation abundance for post monsoon was Ca2+> Na+>Mg2+>K+ in pre-monsoon season. Among the major anions, bicarbonate was generally dominant and representing on average 43% of the total anions. Sulphate is the second dominant anion, representing on an average 39% of the total anions. Chlorides were less dominant ions and contributing 17% to the total anions respectively (Figure 8). Nitrate and fluoride are the least dominant anion of the total anions. The order of anions for post-monsoon abundance in the surface was found as HCO3-> SO42-> Cl->NO3->F-. However, in pre-monsoon season bicarbonate is the dominant anion, representing on an average 43% of the total anions. Sulphate is the second dominant anion, representing on an average 37% of the total anions. Chlorides were less dominant ions and contributing 18% to the total anions respectively. Nitrate and fluoride is the least dominant anion of the total anions. The order of anions abundance in the surface was found as HCO3-> SO42-> Cl->NO3->F- (Figure 9).
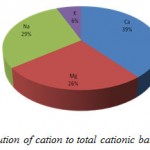 |
Figure 7: Percentage contribution of cation to |
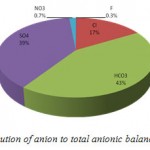 |
Figure 8: Percentage contribution of anionto total anionic balance (TZ-) for post-monsoon Click here to View figure |
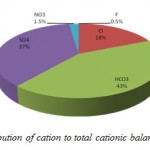 |
Figure 9: Percentage contribution of cation to total cationic balance (TZ-) for pre-monsoon Click here to View figure |
Suitability of Groundwater for Drinking and Domestic Purposes
The physico-chemical parameters of the analytical results of groundwater were compared with the standard guideline values recommended by the World Health Organization (WHO, 1997) and Bureau of Indian Standards (BIS, 2003) for drinking and public health standards (Table 2). The pH of the groundwater samples were found to be ranging from 6.5 to 8.2 and with mean of 7.2 for post-monsoon season, while the pre-monsoon season water samples range 6.5 to 8.3 and mean 7.3. The water samples indicate is slightly acidic to alkaline in nature. The overall conductivity ranges from 480 µS/cm to 1300 µS/cm and mean 862.3 for post –monsoon season, while the pre-monsoon season water samples range 630 µS/cm to 1590 µS/cm in groundwater of study area. The TDS were varied from 350 mg/L to 1150 mg/L for post – monsoon season while the pre- monsoon season water samples 532 mg/L to 1377 mg/L. The values of TDS exceed the desirable limit of 500 mg L-1 in96 % samples of groundwater in post-monsoon, while 100% in pre-monsoon season. The total hardness (TH) of the analyzed water samples of the study area varies between 210 mg/L to 752 mg/L and (Avg. 444 mg/L) in post-monsoon. However, pre-monsoon season water samples it varied 294 mg/L to 917 mg/L and (Avg. 546 mg/L) respectively indicating hard to very hard types of water. The chloride content in the study area varied from 39 mg/L to 198 mg/L in the groundwater in post –monsoon season. However, the pre-monsoon season water samples it varied 54 mg/L to 254 mg/L. Chloride presents in a lower concentration in common rock types as compared to other constituents of natural water. It is assumed that bulk of the chloride in water is primarily either from atmospheric source or from seawater. Nitrate content in groundwater samples varied from 1.1 mg/L to 30 mg/L in post-monsoon. However, the pre-monsoon season water samples it varied from 2.1 mg/L to 46 mg/L. Concentration of NO3- exceeding the desirable limits of 45 mg L-1 in 3 % of the groundwater samples in pre-monsoon season. Sulphate in the water samples ranged from 47 mg/L to 369 mg/L in post-monsoon. While, the pre-monsoon season water samples it varies from 90 mg/L to 397 mg/L. The values of SO42- exceed the desirable limit of 200 mg L-1 in 45 % samples of groundwater in post-monsoon, while 51% in pre-monsoon season. Higher concentration of sulphate may be attributed to rock weathering or anthropogenic sources like industrial and agricultural effluents (Berner and Berner 1987). Higher F- concentration causes dental and skeletal fluorosis such as mottling of teeth, deformation of ligaments and bending of spinal cord (Tiwari and Singh 2014). Concentration of F- is within recommended limit of 1.5 mg L-1 in groundwater samples in post-monsoon season. However, in pre-monsoon season, values of F- exceed the permissible limit of 1.5 mg L-1 in 21% samples of groundwater. The range of calcium ions was 28 mg/L to 192 mg/L for post monsoon and while, the pre-monsoon season water samples it varies 35 mg/L to 205 mg/L. The magnesium ranged from 38 mg/L to 129 mg/L for post-monsoon water samples of the study area. While, the pre-monsoon season water samples it varies 38 mg/L to 138 mg/L. The sodium concentration in the water samples was found between 14 mg/L to 143 mg/L for post-monsoon and while, the pre-monsoon season water samples it varies 28 mg/L to 189 mg/L. The permissible limit for sodium is given as 200 mg/L according to WHO guidelines. Concentration of Na+ is within recommended limit of 1.5 mg L-1 in groundwater sample. A higher sodium intake may cause hypertension, congenial heart diseases and kidney problems (Singh et al. 2008, Tiwari et al. 2013).
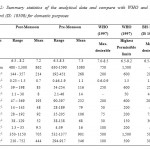 |
Table 2: Summary statistics of the analytical data and compare with WHO and Indian Standard (IS: 10500) for domestic purposes Click here to View table |
Conclusion
The good recharge of groundwater shows in the eastern Jharia area, which shows less groundwater fluctuation. The groundwater is recharged through by cracks, fissure and planes discontinuity. The water level fluctuation shows in the year 2013 is 1.29 to 6.9 mbgl. West and some part of the northern part are facing extreme scarcity due to lower availability of ground water and eastern region of the study area has sufficiently available of ground water resources. The groundwater of Jharia coalfield is slightly acidic to alkaline in nature. In majority of the samples, the analyzed parameters are well within the desirable limits and water is potable for drinking purposes. However, concentrations of EC, TDS, TH, SO42-, Na+,Ca2+ and Mg2+exceed the desirable limit at few sites and needs treatment before its utilization. The groundwater of this area is very much affected by various natural sources and mining activity.
Acknowledgement
The authors are thankful to University Grants Commission (UGC) New Delhi, also grateful to Prof. D.C. Panigrahi, Director, Indian School Mines, Dhanbad for his valuable support during the study.
Reference
- APHA, Standard methods for the examination of water and waste water, 20th edn. American Public Health Association, Washington, DC. (1998).
- Babiker I. S., Mohamed M. A. A., Hiyama T., Assessing groundwater quality using GIS, Water Resour Manage, 21: 699-715.(2007).
- Berner E. K. and Berner R. A., The global water cycle: geochemistry and environment, Prentice-Hall, Englewood Cliffs, (1987).
- BIS., Indian standard drinking water specifications IS10500:1991, edition 2.2 (2003–2009), Bureau of Indian Standards, New Delhi, (2003).
- Dhindsa S. S., Bheel P. and Musturia Y., Hydrochemical study of ground water quality variation in Tonk District, Rajasthan, Indian Journal of Environment and Ecoplanning, 8(1): 129–136, (2004).
- Jain C. K et al., Assessment of ground water quality for drinking purpose, District Nainital, Uttarakhand, India, Environmental monitoring and assessment, 166(1-4): 663-676, (2010).
- Kelley., WP Permissible composition and concentration of irrigation waters. In: Proceeding American Society of Civil Engineering, (1946).
- Kumar, R. et al. Water resources of India, Curr Sci., 89: 794–81.
- Meenakumari H. R. and Hosmani, S. P., Physicochemical and biological quality of ground water in Mysore City, Karnataka, Indian Journal of Environment and Ecoplanning, 7(1): 79–82, (2003).
- Ramakrishnaiah, C. R. et al. Assessment of water quality index for the groundwater in Tumkur Taluk, Karnataka State, India, Journal of Chemistry, 6(2): 523-530 (2009).
- Salve, P. R. et al. Assessment of groundwater quality with respect to fluoride, Bulletin of environmental contamination and toxicology, 81(3): 289-293 (2008).
- Singh A. K., Raj Beenu., Tiwari A. K. and Mahato M. K., Evaluation of hydrogeochemical processes and groundwater quality in the Jhansi district of Bundelkhand region, India, Environmental Earth Science, 70(3): 1225-1247, (2013).
- Singh P., Tiwari A. K. and Singh P. K., Hydrochemical characteristic and Quality Assessment of Groundwater of Ranchi Township Area, Jharkhand, India, Current World Environment, 9(3): 804-813, (2014) http://dx.doi.org/10.12944/CWE.9.3.30.
- Singh, A. K. et al., Hydro geochemical processes and quality assessment of groundwater in Dumka and Jamtara districts, Jharkhand, India, Environmental Earth Sciences, 67(8): 2175-2191 (2012).
- Singh,A. K. et al., Major ion chemistry, weathering processes and water quality assessment in upper catchment of Damodar River basin, India, Environ. Geol., 54: 745–758 (2011).
- Tiwari A. K. and Singh A. K., Hydrogeochemical investigation and groundwater quality assessment of Pratapgarh district, Uttar Pradesh, Journal of the Geological Society of India, 83(3): 329-343, (2014).
- Tiwari A. K., Singh P. K. and Mahato M. K., Chemistry of Groundwater and Their Adverse Effects on Human Health: A Review, Indian Journal of Health and Wellbeing, 4(4): 923-927, (2013) http://dx.doi.org/10.12944/CWE.9.3.35.
- Tiwari A. K., Singh P. K. and Mahato M. K., GIS-Based Evaluation of Water Quality Index of Groundwater Resources in west Bokaro Coalfield, India, Current World Environment, 9(3): 843-850, (2014).
- TODD, D., Ground water hydrology (2nd edn). Wiley, New York. pp 535, (1980).
- WHO., Guidelines for drinking-water quality. vol 1, Recommendations. World Health Organisation, Geneva, pp 1–4, 1997.


