Ambient Air Quality Assessment With Particular Reference to Particulates in Western Part of Jharia Coalfield, India
Gurdeep Singh1, 2 and Amarjeet Singh2,3 *
1
Vinoba Bhave University Hazaribag Jharkhand,
825301
Jharkhand
India
2
Department of Environmental Science and Engineering,
Indian School of Mines,
Dhanbad,
826004
India
3
Central Mine planning and Design Institute Limited, RI-II, Koyla Bhawan,
Dhanbad,
826005
Jharkhand
India
http://dx.doi.org/10.12944/CWE.10.2.18
India is in the list of fastest growing countries of the world. India's energy needs are also increasing due to population and industrial growth for improving quality of living style. In India, coal is major input infrastructure industries for example Power plants, Steel plants and Cement industries. India’s 52% of primary energy is coal dependent1. 66% of India's power generation depends upon coal production1.
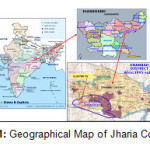
Jharia Coalfield (JCF) is falling in the Lower Gondwana Coalfields of India. The area of the JCF is about 450 km2. It is important for the major supply of precious coking coal required for steel plants in India. It is located in Dhanbad district of Jharkhand state of India, The latitude is 23° 39' to 23° 48' N and longitude is 86° 11' to 86° 27' E for the Jharia coalfield. Based on environmental parameters, all the 103 mines of BCCL have been grouped under 17 Clusters. A cluster consists of a group of mines with mine lease boundary lying in close vicinity and includes-Operating mines, Abandoned/ closed mines and proposed projects.The focused study area is in the western part of the Jharia coalfield is named as Cluster XV group of mines of BCCL consists of four mines, Kharkharee Colliery (UG), Dharmaband Colliery (UG), Madhuband Colliery (UG) and Phularitand Colliery (UG) .The present study was carried out with the objective to measure the ambient air quality of the study area with reference to particulate matter (SPM, PM10 & PM2.5).
Ambient air monitoring results have shown that the observe air quality were found within the limit prescribed by MoEF / CPCB. It may due to Underground mines as there are pollution causing lesser activities involved in the UG mining process compared to opencast mining. Implementation of Master plan for Jharia coalfields for environmental management has also improve the air quality in the area10,11.
Copy the following to cite this article:
Singh G, Singh A. Ambient Air Quality Assessment With Particular Reference to Particulates in Western Part of Jharia Coalfield, India. Curr World Environ 2015;10(2) DOI:http://dx.doi.org/10.12944/CWE.10.2.18
Copy the following to cite this URL:
Singh G, Singh A. Ambient Air Quality Assessment With Particular Reference to Particulates in Western Part of Jharia Coalfield, India. Curr World Environ 2015;10(2). Available from: http://www.cwejournal.org/?p=12538
Download article (pdf) Citation Manager Publish History
Introduction
India is in the list of fastest growing countries of the world. India's energy needs are also increasing due to population and industrial growth for improving quality of living style. In India, coal is major input infrastructure industries for example Power plants, Steel plants and Cement industries. India’s 52% of primary energy is coal dependent1. 66% of India's power generation depends upon coal production1.
 |
|
Major coalfields in India are Coal India Limited (CIL), Singareni Colliery Co. Limited and Neyveli Lignite Corporation. CIL has its subsidiaries ECL, BCCL, CCL, NCL, WCL, SECL, MCL, and NCL. Bharat Coking Coal Limited (BCCL) is the only producer of prime coking coal in India1. BCCL meets almost 50% of the total prime coking coal requirement of the integrated steel sector2. The Jharia Coalfield (JCF) is one of the Lower Gondwana Coalfields of India, covering an area of about 450 km2. It is one of the most important coalfields in India, located in Dhanbad district, between latitude 23° 39' to 23° 48' N and longitude 86° 11' to 86° 27' E. Based on environmental parameters, all the 103 mines of BCCL have been grouped under 17 Clusters2. A cluster consists of a group of mines with mine lease boundary lying in close vicinity and includes-Operating mines, Abandoned/ closed mines and proposed projects. The Central Pollution Control Board (CPCB) in consultation with State Pollution Control Boards has identified 43 out of 88 studied areas in the country as critically polluted areas. Dhanbad district was identified as one of them, though it has been excluded from the list by improving the environmental condition at present. Coal mining activities are mainly responsible for air pollution particularly due to subsidence and mine fires in Dhanbad4, 5, 14, 15. The Coal handling plant, railway siding, transportation activities and domestic cooking are the source of air pollution. Emission of particulate matter (PM10 & PM2.5) is major cause of air pollution in Jharia Coalfield. PM10 & PM2.5 are fine enough to be inhaled and cause health effects6. Thus, the particulate Matter has significant effect on the air quality and requires impact assessment. The present study was carried out with the objective to measure the ambient air quality of the study area with reference to particulate matter.
Location of the Study Area
The focused study area is in the western part of the Jharia coalfield is named as Cluster XV group of mines of BCCL consists of four mines, Kharkharee Colliery (UG), Dharmaband Colliery (UG), Madhuband Colliery (UG) and Phularitand Colliery (UG) which falls between Latitude 23o 45’ to 23o 47’ N and Longitude 86o 12’ to 86o17’ .The area has four underground mines. A map of the study area has been shown in fig. 2.
The monitoring stations were fixed by considering the up and down wind direction to reflect the cross sectional scenario of the Cluster. The climatological norms of predominant wind direction and wind speed of the study region were taken in to consideration at the time of the monitoring station fixation.
A total six numbers of monitoring stations were fixed namely A-1 to A-6.
Air quality monitoring stations have been located on the up and downwind direction to reflect the cross sectional scenario of the cluster. As per G.S.R. 742(E) dt. 25th September, 2000 – Ambient Air Quality for Coal mines and Ministry of Environment and Forests Notifications, National Ambient Air Quality Standards Dtd. 16th November, 2009 the parameters considered for assessment of Ambient air quality were SPM, PM10, PM2.57, 8.
The sampling location A-1 and A-2 was in the core zone of mining activities. It has been selected to assess baseline environmental status due to mining activities to access the pollution level due to mining activities in the cluster. The sampling location A-3 was about 2.5 Km North direction of the cluster to measure the pollutant level due to the mining and allied activities. Sampling location A-4 was about 3 Km towards Northwest direction of the cluster to measure the effects of pollutants with respect to the cluster activities. Sampling location A-5 was about 3.5 Km towards Northeast direction of the cluster to measure the effects of pollutants with respect to the cluster activities. The sampling location A-6 was about 5 Km towards Southeast direction of the cluster to measure the effects of pollutants.
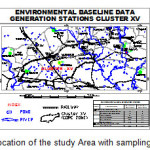 |
Figure 2: Location of the study Area with sampling stations Click here to View figure |
Experimental Methodology
A meteorology station was fixed near the core zone on the roof of a house at Gaslitand Village, which represents the micrometeorological status of the cluster. In the study period, hourly reading of temperature, humidity, cloud cover, atmospheric pressure, wind velocity, wind direction, and rainfall data were noted.Ambient air samples were collected for pre monsoon period from February 2012 to April 2012. For sampling of PM10 & PM2.5 Respirable Dust Samplers / Fine Particulate Samplers (Make: Envirotech RDS 460 /APM 550) were used. SO2 and NOx were collected with proper flow controller. The above parameters were monitored on 24 hourly basis in a day for 2 days in a week for 12 weeks. Thus 24 samples were collected from each sampling stations. The Methods used for monitoring was taken from the standards sited in NAAQS (National Ambient Air Quality Standards), IS 5182 (part II) – 1969, for SO2, IS 5182 (part IV) – 1973, IS 5182 (part VI) – 1975 for Nitrogen Oxides and for Suspended Matter, IS 5182 (part V) – 1975, for Gaseous Pollutants sampling.
Suspended Particulate Matter (SPM)
Sampling for estimation of SPM concentration was performed with the help of Respirable Dust Sampler (RDS). The coarse particles were collected and weighted. The SPM concentrations were calculated from the mass of Suspended particulate Matter (SPM) and total air sample volume.
Respirable Particulate Matter (PM10)
The RDS sampler consisting of cyclone separator was used for measuring particles larger than 10 micro meter diameter in the ambient air of the cluster. Air sample passing through the separator were drawn at a known rate through pre-weighed glass fibre sheets of dimension 20 cm x 25 cm. The RPM concentrations were measured from the average air flow rate, sampling time period and mass of particulate matter collected over the filter paper.
Particulate Matter (PM2.5)
PM2.5 is determined as per USEPA (United State Environment Protection Agency) guidelines with the help of Fine Dust Sampler. Ambient air is allowed to pass through assembly having a fresh 37 mm diameter filter paper. Particulate matter of size <2.5 microns is deposited on 46.2 mm dia. PTFE filter. The difference of final weight and initial weight of filter paper gives the weight of particulate matter of size <2.5 microns. The concentration of PM2.5 is computed as the weight of dust deposited on the filter divided by volume of the air sample passed.
Sulphur Dioxide (SO2)
Sampling of ambient air for measuring the gaseous pollutants were done with a Multi gas Sampler, by the use of the vacuum created by the Respirable Dust Sampler (RDS) for taking the air sample passing through the impingers. For Sulphur dioxide (SO2), air was drawn at a measured rate of 400 to 500 ml/min through the solution of potassium tetra chloro mercuratke. After the sampling completed, the absorbing reagent used was treated with dilute solutions of sulfamic acid, para-rosaniline hydrochloride and formaldehyde. The absorbance of the para-rosaniline methyl sulphonic acid was noted down at the wavelength of light 560 nm with the help of spectrophotometer and the amount of SO2 in the sample was calculated. The ambient SO2 concentrations were calculated from the total SO2 absorbed, overall efficiency and the volume of air sampled.
Oxides of Nitrogen (NOx)
Air sample was taken at a known rate of about 200 ml/minute through an orifice-tipped impinger consisting of solutions of sodium hydroxide and sodium arsenite. When sampling was completed the aliquot of the used absorbing solution was treated with solutions of Hydrogen para oxide (H2O2), NEDA and sulphanilamide. The nitrite ion present was calculated by measuring the absorbance of the solution at wavelength of light 540 nm with the help of spectrophotometer. The concentrations of NOx were calculated from the total nitrite ion present, overall efficiency and the volume of air sample taken.
Respirable dust sampler is operated at an average flow rate of 1.1-1.2 m3/min as per IS: 5182- part II for sampling/ collection of particles.
They are computed as per standard methods after determining the weights of Whatman GF/A filter paper before after sampling in electronic balance. First initial weight of filter paper is taken and then installed in the sampler. The timer in the instrument was set on; sampling date, elapsed time meter reading, and initial flow rate were recorded. Final weight of filter paper was taken and ambient concentration of particulate matter was taken.
After the completion of the collection of Air samples as the weight of PM10 & PM2.5 collected on filter paper (PTFE membrane filter) were calculated by using Gravimetric method.
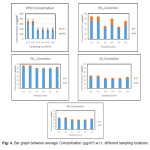 |
Figure 3: Bar graph between average Concentration (µg/m3) w.r.t. different sampling locations. Click here to View figure |
Results and Discussions
Suspended Particulate Matter (SPM)
The SPM concentration was ranging from minimum 158 µg/m3 at A-3 to maximum 370 µg/m3 at A-1. The average concentration was ranging from 175 to 312 µg/m3 on A-3 and A-1 respectively (Fig: 3). With comparison to the standards for coal mines (MoEF) environment (protection) amendment rules – 2000 for Jharia Coal field (700 µg/m3 for 24 hrs. samplings) the SPM concentration was within the limit9. It may due to Underground mines as there are lesser activities involved in the UG mining process compared to opencast mining and implementation of Master plan for Jharia coalfields for environmental management10.
Respirable Particulate Matter (PM10)
The PM10 concentration was ranging from minimum 81 µg/m3 at A-3 to maximum 100 µg/m3 at A-1. The average concentration was ranging from 85 to 93 µg/m3 on A-3 and A-1 respectively (Fig: 3). With comparison to the National Ambient Quality Standards (NAAQS) for India (As per CPCB, 2009) (100 µg/m3 for 24 hrs. weighted average samplings) the PM10 concentration was within the limit15. It may due to Underground mines as there are lesser activities involved in the UG mining process compared to opencast mining and implementation of Master plan for Jharia coalfields for environmental management10, 11.
Particulate Matter (PM2.5)
The PM2.5 concentration was ranging from minimum 46 µg/m3 at A-3 to maximum 59 µg/m3 at A-1. The average concentration was ranging from 48 to 53 µg/m3 on A-3 and A-1 respectively (Fig: 3). With comparison to the National Ambient Quality Standards (NAAQS) for India (As per CPCB, 2009) (60 µg/m3 for 24 hrs. weighted average samplings) the PM2.5 concentration was within the limit. It may due to Underground mines as there are lesser activities involved in the UG mining process compared to opencast mining and implementation of Master plan for Jharia coalfields for environmental management.
Sulphur Dioxide (SO2)
The SO2 concentration was ranging from minimum 15 µg/m3 at A-3 to maximum 34 µg/m3 at A-1. The average concentration was ranging from 21 to 27 µg/m3 on A-3 and A-1 respectively (Fig: 3). With comparison to the National Ambient Quality Standards (NAAQS) for India (As per CPCB, 2009) (80 µg/m3 for 24 hrs. weighted average samplings) the SO2 concentration was within the limit.
Oxides of Nitrogen (NOx)
The NOX concentration was ranging from minimum 21 µg/m3 at A-3 to maximum 40 µg/m3 at A-1. The average concentration was ranging from 27 to 34 µg/m3 on A-5 and A-2 respectively (Fig: 3). With comparison to the National Ambient Quality Standards (NAAQS) for India (As per CPCB, 2009) (80 µg/m3 for 24 hrs. weighted average samplings) the NOX concentration was within the limit.
Conclusion
The pollution in coal mining areas are considered due to the fugitive emission of particulate matters and gases like methane (CH4), sulfur dioxide (SO2) and oxides of nitrogen (NOx). Mining and its allied activities are the mainly important sources of above emissions. For mitigation measures of air pollution, some of the measures employed are continuous water spraying and sprinkling on the transportation and haul roads to control the dust generation and tree plantation around the mining areas.
Ambient air monitoring results have shown that the observe air quality were found within the limit prescribed by MoEF / CPCB. . It may due to Underground mines as there are pollution causing lesser activities involved in the UG mining process compared to opencast mining. Implementation of Master plan for Jharia coalfields for environmental management has also improve the air quality in the area10, 13. The coal mining and power plants (coal fired) are known to be pollution causing industry. However, with adequate pollution control and eco-restoration measures, sustainable coal mining is possible11, 12, 13.
Dhanbad district was identified as one of the critically polluted areas in India, but now it has been excluded from the list by improvement in the environmental condition at present.
Acknowledgment
The Authors are grateful to CMPDI, RI-II, Dhanbad to permit for presenting the data for the publication and the support and encouragement.
References
- https://www.coalindia.in/enus/compay/aboutus.aspx
- http://www.bccl.gov.in/
- Gurdeep Singh and Parveen Kumar Sharma , Study of spatial distribution of air Pollutants in some coal mining areas of Raniganj coalfield, India, Environmental International,18,191-200(1992).
- R. Sinha et al. Mine Fires in Indian Coalfields, Energy, 11, No. 11/12, 1147-1154(1986).
- Tugrul Unlu et al. An integrated approach for the prediction of subsidence for coal mining basins, Engineering Geology, 166, 186–203. (2013).
- BIAN Zhengfu et al. Environmental issues from coal mining and their solutions. Mining Science and Technology 20, 0215–0223 (2010).
- IS 5182, Methods for Measurement of Air Pollution, Guidelines for Planning the Sampling of Atmosphere (Second Revision) (2000).
- CPCB, National Ambient Air Quality Standards (2009), (CPCB) Notification, New Delhi, 18th November, (2009).
- Air Quality Standards for Coal Mines 2(1) of the Environment (Protection) Amendment Rules, 2000 of MoEF Govt. of India notified vide notification G.S.R. 742(E), dated 25.9.2000.
- BCCL, Master Plan for Dealing with Fire, Subsidence and Rehabilitation in the Leasehold of BCCL, 2-7, March, 2008.
- BCCL ,Problems of Fire & Subsidence In Jharia Coalfield And Actions Being Taken By The Government Through Jharia Master Plan,1-5, 2010
- Norwest Mine services Limited, A report of Jharia Coalfield Environmental Management Plan prepared 2-8, September 1996.
- Fabiano et al., Coal dust emissions: From environmental control to risk minimization by Underground transport: An applicative case-study, Process Safety and Environmental Protection 9 (2), 150–159 (2014).
- Kumar, G. Chakrabarty, Impact of Coal Fires on the Environment, Mine Tech, 32, (4), 30-39, 2011.
- B. Dubey, A.K. Pal &G. Singh, Variation of PM10 Concentrations in Jharia coalfield, Dhanbad, Mine Tech,32,(4),55-60,2011.


