Assessment of Groundwater Quality Using GIS: A Case Study of Walayar Watershed, Parambikulam-Aliyar-Palar Basin, Tamilnadu, India
K. Balathandayutham1 * , C. Mayilswami2 and D.Tamilmani 3
1
Department of Soil and Water Conservation Engineering,
AEC and RI,
India
2
Water Technology Centre,
India
3
(SWCE),
Tamil Nadu Agricultural University,
AEC and RI,
Kumulur,
Coimbatore
India
http://dx.doi.org/10.12944/CWE.10.2.25
Good groundwater quality is essential for crop yield, soil productivity and environmental protection. Suitability of groundwater for irrigation purposes is determined by its geochemistry. Groundwater geochemistry explains links between chemical composition of groundwater and subsurface geological and non-geological pollutants. Subsurface rock formations control the composition of soil and hence that of water and vegetation. The ground water samples were analyzed for physico-chemical parameters like Electrical Conductivity (EC), Hydrogen ion concentration (pH), Bicarbonate (HCO3-), Calcium (Ca2+), Magnesium (Mg2+), Sodium (Na+), Potassium (K+), Sulphate (SO42-), Nitrate (NO3-), and Chloride (Cl-). Inverse distance weighted method of the Geographical Information Systems is used to prepare the distribution map of physio-chemical parameters of groundwater while overlay method is used to assess spatial, temporal changes and prepare groundwater quality zones of Walayar watershed in Parambikulam-Aliyar-Palar basin situated in Coimbatore district, Tamil Nadu, India. The results of study show that the quality of groundwater varies both spatially and temporally in Walayar watershed. The groundwater samples in some of the wells showed deviation from water quality standards indicating groundwater contamination. Hence, proper care must be taken to avoid any contamination of groundwater and its quality be monitored periodically.
Copy the following to cite this article:
Balathandayutham K, Mayilswami C, Tamilmani D. Assessment of Groundwater Quality Using GIS: A Case Study of Walayar Watershed, Parambikulam-Aliyar-Palar Basin, Tamilnadu, India. Curr World Environ 2015;10(2) DOI:http://dx.doi.org/10.12944/CWE.10.2.25
Copy the following to cite this URL:
Balathandayutham K, Mayilswami C, Tamilmani D. Assessment of Groundwater Quality Using GIS: A Case Study of Walayar Watershed, Parambikulam-Aliyar-Palar Basin, Tamilnadu, India. Curr World Environ 2015;10(2). Available from: http://www.cwejournal.org/?p=1
Download article (pdf) Citation Manager Publish History
Introduction
Groundwater resources are highly essential to the survival of human beings, particularly in areas where other sources of potable water are lacking. However, many sources of contamination contribute to the impairment of this precious resource. The major sources of spot and dispersive contaminants arising from human activities on the ground and penetration of these contaminants into the ground tend to reduce the quality of the ground water. Therefore, preventing the ground water from contamination is essential to the management of ground water resources (Melloul & Collin, 1994).
Groundwater, being a fragile and important source of drinking water, must therefore be carefully managed to maintain its purity within standard limits. Groundwater degradation occurs when its quality parameters are changed beyond their natural variations by the introduction or removal of certain substances (Ramesh, 2001). In regions of intense agricultural activities, the degradation results from the addition of salts by dissolution during the irrigation process, from salts added as fertilizers or soil amendments and from the concentration of salts by evapotranspiration. Because irrigation is the primary use of water in arid and semi-arid regions, irrigation return flow can be the major cause of groundwater pollution in such regions. Groundwater can become contaminated naturally or because of numerous types of human activities; residential, municipal, commercial, industrial, and agricultural activities can all affect groundwater quality (Jalali, 2005).
In a drinking water quality assessment, the decision-making based on water quality data is a crucial issue because number of parameters compromises its quality. Traditionally, water resource professionals communicated drinking water quality status by comparing the individual parameters with guideline values. While this technical language is too technical and it is not a decision to provide a whole picture of drinking water quality (Cude, 2001). Quality of groundwater is equally important to its quantity owing to the suitability of water for various purposes. Variation of groundwater quality in an area is a function of physical and chemical parameters that are generally influenced by geological formations and anthropogenic activities (Subramani et al., 2005). Advancement of Geographical Information System (GIS) and Spatial Analysis help to integrate the laboratory analysis data with the geographic data and to model the spatial distributions of water quality parameters, most robustly and accurately. Now GIS is increasingly being integrated with groundwater and surface water quality assessment models. GIS can be used as tool for spatial surveillance of epidemiological diseases and also as a spatial decision support system for public health management. The spatial patterns of chemical constituents are useful in deciding the water use strategies for various purposes (Shankar et al., 2010). Assessing and monitoring the quality of groundwater is therefore, important to ensure sustainable safe use of these resources for the various purposes. The objective of the study is to assess and map the groundwater quality of Walayar watershed of Parambikulam-Aliyar-Palar basin.
Study Area
Walayar watershed is one of the three sub-basins in Parambikulam-Aliyar-Palar basin situated in Coimbatore district, Tamil Nadu, India and lies between 10°40’00” to 10°20’00” N latitude and 76°50’00” to 77 °20’00” E longitude. It spread over an area of 877.49 km2. In Walayar sub-basin, there are two streams originating one at the north eastern part of plain is Koduvadi Aru, starts at an elevation of 445 m above MSL and Walayar river at the northern part of the basin area ie. in the Balampatti Block Reserved Forest and hilly area at an altitude of 1135 m above MSL. Walayar and Koduvadi Aru are flowing in south and southwest directions. The major crop grown in this sub- basin area is coconut, sugarcane, banana, mango, fodder, paddy, groundnut, cotton, vegetables, pulses, tomato and maize.
Table1: Statistical analyses of physical and chemical parameters
|
Parameter |
Unit |
Min |
Max |
Average |
Std. Deviation |
Std. Error |
|
EC |
μs/cm |
510 |
4130 |
1679.55 |
838.83 |
197.71 |
|
pH |
- |
7.25 |
7.96 |
7.6 |
0.23 |
0.05 |
|
HCO3 |
mg/L |
109.8 |
555.1 |
301.95 |
129.40 |
30.50 |
|
Cl |
mg/L |
40.12 |
498.07 |
241.88 |
135.79 |
32.01 |
|
SO4 |
mg/L |
12.96 |
189.6 |
44 |
49.43 |
11.65 |
|
Ca |
mg/L |
15 |
81 |
40.34 |
20.04 |
4.72 |
|
K |
mg/L |
2.34 |
59.28 |
17.04 |
15.16 |
3.57 |
|
Mg |
mg/L |
15.84 |
127.92 |
62.25 |
26.42 |
6.23 |
|
Na |
mg/L |
30.59 |
298.08 |
131.58 |
70.56 |
16.63 |
Methodology
As part of the study, the groundwater samples from open and bore wells of various locations (18 sites) which are extensively used for drinking and also irrigation purposes in the Walayar watershed area were collected during the year of 2011 to 2014.The locations of groundwater sampling stations are shown in the Fig.1. The locations of groundwater sampling stations are shown in the Fig. 1. pH and Electrical Conductance (EC) were measured on-site using portable meters (Kusam-Meco Company, 6011, 6021). Collected samples were brought to the laboratory, Ca and Mg were determined titrimetrically using standard EDTA, Na and K by Elico flame photometer (CL 378), and chloride was determined by silver nitrate titration. Sulphate was determined gravimetrically by precipitating BaSO4 from BaCl2. (APHA, 2012) and compared with standard values recommended by WHO-World Health Organization (2011). SPSS 11.5 using to calculate statistical analysis of Physical and chemical parameters of the study area is shown in Table 1.
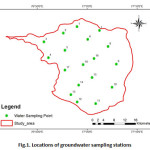 |
Figure 1: Locations of groundwater sampling stations Click here to View figure |
GIS can be a powerful tool for developing solutions for water resources problems for assessing water quality, determining water availability, preventing flooding, understanding the natural environment, and managing water resources on a local or regional scale (Collet 1996). Spatial analysis module in Arc GIS (version 9.2) software has been used for the present study. The base map was prepared using toposheet on 1:50,000 scale. Spatial analysis of drinking water quality was carried out by interpolation of sampling points by the algorithmic method ‘Inverse Distance Weighted’ (IDW). The locations of the sampling stations were imported into GIS software as point layer. Each sample point was assigned by a number and stored in the point attribute table. The attribute data file contains values of all physico-chemical parameters in separate columns for each sampling station. The geodatabase was used to generate the spatial distribution maps of the analyzed water quality parameters like pH, Electrical Conductivity, Total Dissolved Solids (TDS), Chloride, Sulphate, Calcium, Magnesium, Fluoride, Bicarbonate, Total Hardness, Nitrate and the results were given.
Results and Discussion
pH
The pH of a solution is the negative logarithm of hydrogen ion concentration in moles per liter. In general, pH is the measure of acidity or alkalinity of water. It is one of the most important operational water quality parameters with the optimum pH required often being in the range of 7.0-8.5 (Tikle et al., 2012). pH is important parameter, which determines the suitability of water for various purposes. In the study area pH level of water varies from 7.25 to 7.96 (Fig. 2). This shows that the groundwater in the study area is slightly alkaline in nature and is between the maximum permissible limits of WHO standards. The slight alkalinity may be due to the presence of bicarbonate ions, which are produced by the free combination of CO2 with water to form carbonic acid, which affects the pH of the water (Azeez et al, 2000).
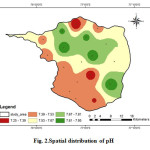 |
Figure 2: Spatial distribution of pH Click here to View figure |
Electrical Conductivity (EC)
The Electrical conductivity is its measure of importance to salinity; which greatly affects the taste. Thus Electrical conductivity has a significant impact on determining the portability of water. The Electrical conductivity of water at 25°C is due to the presence of various dissolved salts (Thangavelu, 2013). It is directly related to concentration of ionized substances in water and may also be related to problems of excessive hardness. The EC values in the study area vary widely from 510 μS/cm to 4130 μS/cm with an average value of 1679.55 μS/cm (Fig.3). The higher EC may cause a gastrointestinal irritation in human beings. Although the large variation in EC is mainly attributed to geochemical process like ion exchange, reverse exchange, evaporation, silicate weathering, rock water interaction, sulphate reduction and oxidation processes (Ramesh 2008), in the study area the enrichment of salt in groundwater may possibly be due to evaporation effect and anthropogenic including agricultural activities. The higher values of EC may be due to long residence time and existing lithology of the region (Ballukraya and Ravi, 1999).
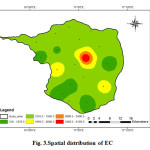 |
Figure 3: Spatial distribution of EC Click here to View figure |
Calcium
Calcium is one of the most abundant substances in the water. Dissolve calcium and Magnesium in water are the two most common minerals that make water hard. Calcium the analysed samples various from 15 to 81 mg/l (Fig.4). In the study area, majority of the samples fall within the permissible limit (75 mg/L). Insufficiency of calcium causes severe rickets; excess causes concretions in the body such as kidney or bladder stones and irritation in urinary passages (CPCB 2008).
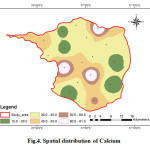 |
Figure 4: Spatial distribution of Calcium Click here to View figure |
Magnesium
Magnesium is present in the groundwater from natural sources like granitic terrain which contain large concentration of these elements. The Magnesium values of the analysed samples ranges from 15.84 to 127.92 mg/L with an average value of 62.25 mg/L (Fig.5). The geochemistry of the rock types may have an influence in the concentration of Mg in groundwater. High concentration of magnesium may cause laxative effect (CPCB 2008).
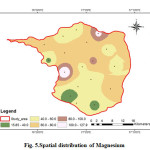 |
Figure 5: Spatial distribution of Magnesium Click here to View figure |
Sodium
Sodium is the most important minerals occurring naturally. The major source of sodium is weathering of rocks besides the sewage and industrial effluents discharge onto the ground. Higher values of sodium are found in the groundwater in the areas of saline water intrusion. In general, sodium salts are not actually toxic substances to humans because of the efficiency with which mature kidneys excrete sodium (Swarna Latha and Nageswara Rao, 2010). Na is one of the important naturally occurring cations and its concentration in fresh waters is generally lower than that of Ca and Mg. But in the present investigation, the average concentration of Na is comparatively higher than that of Ca and Mg. The sodium concentration various from 30.59 to 298.08 mg/L with an average value of 131.58 mg/L (fig .6). For aesthetic reason, the guideline value given by WHO are 200 mg/L. Excess of sodium in drinking water may be harmful to persons suffering from cardiac, renal, and circulatory diseases (CPCB 2008). Excess sodium causes hypertension,congenial diseases, kidney disorders and nervous disorders in human body (Ramesh and Elango, 2011). According to Hem (1985), high values of sodium in groundwater may either be due to chemical weathering of feldspars or over exploitation of groundwater resources.
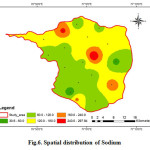 |
Figure 6: Spatial distribution of Sodium Click here to View figure |
Potassium
Potassium is slightly less common than sodium in igneous rocks, but more abundant in all the sedimentary rocks. Potassium is an essential element for plants and animals. The elements present in plant material and are lost from agricultural soil by crop harvesting and removal as well as leaching and runoff on organic residues (Swarna Latha and Nageswara Rao, 2010). Potassium the analysed samples various from 2.34 to 59.28 with an average value of 17.04 mg/L (Fig.7). Potassium contamination in groundwater can result from the application of inorganic fertilizer at greater than agronomic rates. Loss of nutrients, including K, from agricultural land have been identified as one of the main causative factors in reducing water quality in many parts of arid and semi-arid regions (Jalali, 2005).
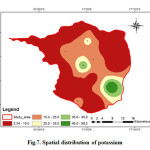 |
Figure 7: Spatial distribution of potassium Click here to View figure |
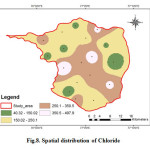
Chloride
Chloride is one of the most important parameter in assessing the water quality and higher concentration of chloride indicates higher degree of organic pollution (Yogendra and Puttaiah, 2008). According to WHO the permissible limit of chloride in drinking water is 200 (Fig.8). The chloride concentration varies from 40.12 mg/L to 498.07 mg/L. The average value is 241.88 mg/L. Eight samples exceeded the maximum allowable limit of 250 mg/L. In natural waters, the probable sources of chloride comprise the leaching of chloride-containing minerals (like apatite) and rocks with which the water comes in contact, inland salinity and the discharge of agricultural, industrial and domestic wastewaters (Abbasi, 1998).
 |
|
Sulphate
Sulphate is found in small quantities in ground water. Sulphate may come into groundwater by industrial or anthropogenic additions in the form of Sulphate fertilizers. Sulphates occur in natural waters at concentration up 50 mg/L and concentration of 1000 mg/L can find in the water having contact with certain geological formations such as pyrite, lignite and coal (Sridhar et al., 2014), whereas the maximum permissible limit of 250 mg/l (WHO, 2011). Spatial distribution of sulphate in the groundwater of the study area shows that Sulphate is varying in between 12.96 to 189.60 mg/L. The average value is 44.00 mg/L (Fig.9). High sulphate concentration in drinking water causes gastrointestinal irritation with Mg or Na can have a cathartic effect on consumers. Concentrations of more than 750 mg/l, along with Mg, may have laxative effect (CPCB 2008). Samples with higher concentration of sulphate in drinking water are associated with respiratory problems (Subramani et al., 2010).
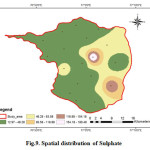 |
Figure 9: Spatial distribution of Sulphate Click here to View figure |
Bicarbonate
The bicarbonate (HCO3) concentration in the groundwater varies from 109.80 to 555.10 mg/l with an average value of 301.95 mg/L (Fig.10). The primary source of carbonate and bicarbonate ions in groundwater is the dissolution of carbonate minerals in the study area. The decay of organic matter present in the soil releases CO2. Water charged with CO2 dissolves carbonate minerals, as it passes through soils and rocks to give bicarbonates. Bicarbonates also show high positive correlation with alkalinity (Flood, 1996).
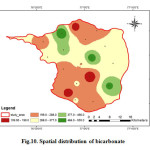 |
Figure 10: Spatial distribution of bicarbonate Click here to View figure |
Conclusion
Water is an indispensable natural resource on earth. Groundwater is the major source of drinking water in both urban and rural areas. Increasing population and its necessities have lead to the deterioration of surface and subsurface water. Groundwater quality depends on the quality of recharged water, atmospheric precipitation and inland surface water. The groundwater quality is equally important as that of quantity. Assessing and monitoring the quality of groundwater is therefore, important to ensure sustainable safe use of these resources for the various purposes. The present study has been undertaken to analyze the spatial variation of major groundwater quality parameters such as pH, Electrical Conductivity (EC), Total Dissolved Solids, Total hardness, Sulphates, Fluorides and Calcium using GIS. GIS can provide appropriate platform for convergent analysis of large volume of multi-disciplinary data and decision making for groundwater based studies can be done effectively. This study demonstrates that the use of GIS could pro-vide useful information for groundwater quality assessment. The results obtained gave the necessity of making the public, local administrator and the government to be aware on the crisis of poor groundwater quality prevailing in the area. The study helps us to understand the quality of the water as well as to develop suitable management practices to protect the groundwater resources.
References
- Abbasi, S.A.,“Water Quality Sampling and Analysis.” Discovery Publishing House, New Delhi. 51p (1998)
- APHA (American Public Health Association). “Standard methods for the Examination of water and wastewater”, 22nd Public Health Association, Washington, DC (2012).
- Azeez,P.A., Nadarajan,N.R., Mittal,D.D.,“The impact of monsoonal wetland on groundwater chemistry”. Pollut Res 19(2):249–255 (2000).
- Ballukraya, P.N. and Ravi,R., “Characterization of groundwater in the unconfined aquifers of Chennai city.” Geological Society of India, 54, 1-11 (1999).
- Collet, C., Consuegra, D., Joerin, F., “GIS Needs and GIS Software”, Kluwer Academic Publishers, 115-142 (1996).
- CPCB “Guidelines for water quality management.” Central Pollution Control Board, PariveshBhawan, East Arjun Nagar, Delhi (2008).
- Cude, C., “Oregon Department of Environmental Quality”, Laboratory Division Oregon EA (Online). http://www.deq.state.or.us/lab/wqm/wqi/wqindex.htm. (2003)
- Flood, D., “Irrigation Water Quality for BC Greenhouses” Floriculture Fact sheet, Ministry of Agriculture, Fisheries and Food, British Columbia (1996).
- Hem, “Study and Interpretation of the Chemical Characteristics of Natural water”, 3rd edition, 2254: 100-104 (1985).
- Jalali, M., “Nitrates leaching from agricultural land in Hamadan, western Iran”, Agricultural Ecosystem. Environmental, 110:210-218 (2005)
- Melloul, A., Collin, M., “Water quality factor identification by the principal component Ù s statistical method”. J. water Sci. technol., 34 :41 – 50 (1994).
- Ramesh, K., “Hydrochemical studies and effect of irrigation on groundwater quality Tondiar basin Tamilnadu” Unpublished Ph.D thesis, Anna University, Chennai, Tamilnadu (2008).
- Ramesh, K., Elango, L., “Groundwater quality and its suitability for domestic and agricultural use in Tondiar river basin, Tamil Nadu, India”, Environ Monit Assess., DOI 10.1007/s10661-011-2231-3 (2011).
- Ramesh, R., “Point and Non-point sources of Groundwater Pollution: Case Studies along the East Coast of India.” In: Subramanian,V and Ramanathan, A.L. (Eds.), Proceedings of the International Workshop on ECOHYDROLOGY. Capital Publishing Company, New Delhi, India, 107p (2001).
- Shankar, K., Aravindan, S., Rajendran, S., “GIS based Groundwater Quality Mapping in Paravanar River Sub- Basin, Tamil Nadu, India”, International Journal of Geomatics and Geosciences, 1(3) : 282-296 (2010).
- Sridhar, N., Poongothai, S., Ravisankar, N., “Spatial analysis of groundwater quality for Tarangabadi taluk, Nagappatinam district, Tamilnadu using GIS”, International Journal of Emerging Technology and Advanced Engineering, 4(9): 251-258 (2014).
- Subramani T., Elango L., Damodarasamy S.R., “Groundwater quality and its suitability for drinking and agricultural use in Chithar River Basin, Tamil Nadu”,Indian Journal of Environmental Geology, 47 : 1099-1110 (2005).
- Subramani, T., Rajmohan, N., Elango, L., “Groundwater geochemistry and identification of hydro geochemical processes in a hard rock region, Southern India”. Environmental Monitoring and Assessment, 162: 123–137, (2010).
- Swarna Latha, P., Nageswara Rao,K., “Assessment and Spatial distribution of quality of groundwater in Zone II and III, Greater Visakhapatnam, India Using Water Quality Index (WQI) and GIS”, International Journal of Environmental Sciences, 1(2): 198-212 (2010).
- Thangavelu, A., “Mapping the groundwater quality in Coimbatore city, India based on physico-chemical parameters”, IOSR Journal of Environmental Science, Toxicology and Food Technology, 3(4): 32-40 (2013).
- WHO, “Guidelines for drinking water quality”, World Health Organization Geneva, 4th ed., Recommendations, 1-4, (2011).
- Yogendra, K., and Puttaiah, E.T., “Determination of water Quality Index and Suitability of urban water body in Shimoga Town, Karnataka.” The 12th world lake conference, 342-346, (2008).


