Detecting land use changes affected by human activities using remote sensing (Case study: Karkheh River Basin)
Saeid Maddah1 , Saeed Karimi2 , Hadi Rezai2 and Jabbar Khaledi2
1
Faculty of Engineering,
University of Malaya,
Kuala Lumpur,
UM
Malaysia
2
Faculty of Environment,
University of Tehran,
Tehran,
Iran
http://dx.doi.org/10.12944/CWE.10.2.11
Population growth and abundant activities in order to achieve maximum well-being has forced human to make a lot of changes in the nature. These changes will be cost-effective when they have the minimum damage on the landscape. One of the activities that human did for obtaining the water and preventing flood was making the dam in the track of running water. Since the dam is established until its impoundment and after impoundment, the condition of ecosystem and the appearance of the upstream and downstream of the dam will undergo changes. In this study, using satellite data and remote sensing, these changes have been studied and the landuse changes in vegetation, arid land, water level and residential and non-residential lands is measured in 1998 and 2014 using Maximum Likelihood method and support vector machine.
Copy the following to cite this article:
Maddah S, Karimi S, Rezai H, Khaledi J. Detecting land use changes affected by human activities using remote sensing (Case study: Karkheh River Basin). Curr World Environ 2015;10(2) DOI:http://dx.doi.org/10.12944/CWE.10.2.11
Copy the following to cite this URL:
Maddah S, Karimi S, Rezai H, Khaledi J. Detecting land use changes affected by human activities using remote sensing (Case study: Karkheh River Basin). Curr World Environ 2015;10(2). Available from: http://www.cwejournal.org/?p=11415
Download article (pdf) Citation Manager Publish History
Introduction
Changes in the surface of land are primarily result of natural ecological processes and human activities. Studying about these changes requires an interdisciplinary approach that is conducted in the field of tension between social and natural sciences (Keken et al, 2015). Among the factors which are caused significant changes on the earths land surface the land use changes are very important and they are probably the main cause of changes in global environment. Nowadays in many region of the world, most of land use changes occur by human activities (Geri et al, 2010).
Claimed that land use changes occurred by human can entail drastic impacts on structure and composition of regional landscape, which also have serious impact on biodiversity and quality of the local environment (Ouyang et al, 2009). Human increasingly control or semi-control the land (Wan et al, 2015). Human bings are quickly and deeply altering landscapes. By dominant economic development and ongoing population growth, human consumption of water, food, building materials, fiber, and other goods is growing exponentially. The most dominant changes that occur to the landscape include urbanization, construction of dams, deforestation, irrigation, road building, animal husbandry and agriculture augmentation (Myers, 2011). As human activities develop and expand there is an increasing pressure on natural environments, which ultimately leads to the loss of biodiversity and ecosystem services (Navarro et al, 2015). Inordinate human activities such as expansion of the road network, construction of dam, industrial development and reclamation of agriculture land have significant role in transformation of hydrology and landscape change (Zhao et al, 2012). Over time humans have influenced the environment and have been affected by it. This feature, especially in the plateau of Iran, which has a long history of human settlement and several thousand years of old civilization in context of its ecological characteristics is more noticeable. The long history of the relationship between human and the environment in the plateau of Iran, have not simplified the natural systems, but rather has added to its complexity. Thus human and environment are so intertwined that their separation is not possible (Frozandeh, 2005). Humans have a uniquely dominant influence over land use worldwide. Changes in surface of land and landscape undoubtedly change the function and structure of ecosystems and influence regional and global climate, hydrology, vegetation, biogeochemical cycles and biodiversity (Wan et al, 2015).
Dams are constructed for many different purpose, such as for hydroelectric power generation, navigation and, control of seasonal flood. Claimed that construction of dams had the most important impact on rivers, segmenting watersheds, effect on hydrological processes, interrupting the rivers connectivity, and erosion of downstream channel river (Hu et al, 2008). Because primary civilization made in the Mesopotamian region upon riverbanks, they start to change the landscape by water supply techniques and management of flood such as constructions of dams, channels, bypass corridors, dikes. These changes transformed the sedimentary processes and basic hydrology that control fluvial systems (Vanessa et al, 2012). Over time course and morphology of alluvial river systems change because of hydraulic forces that acting on the banks and river bed. Human activities or natural processes are cause of these changes. These changes could interrupt and transform any point or section of a river in downstream and upstream conditions. Many changes such as degradation, streambed mobilization, aggradation and hydrologic regime changes are induced by human through effect on ecological, physical and environmental processes (Isik et al, 2088).
Identifying contrast between present and past changes and activities on the surface of land show plain approach for determining changes on landscape and for measuring connections among forest, agricultural and anthropogenic systems. To identify these changes and make plans for reasonable management of natural resources a lots of data is required. Remote sensing data and information show useful source for monitoring changes of environment and quantifying characteristics of habitat (Geri et al, 2010).
Classifications of these changes with GIS technologies and remote sensing are able to reinforce studies of landscape patterns in different scales (Lautenbach et al, 2011). Nowadays, integration of GIS and remote sensing has been provided precise information to monitoring land use changes (Abdullah et al, 2013). Using satellite data is a useful way to provide to land cover mapping and monitoring especially in large geographic areas (Yuan et al, 2005). The use of information systems and remote sensing data can be effectively used in situations in which the landscape over time as a result of processes such as erosion, deforestation, urban growth and others that Immediately changed and in Finding a variety of spatial patterns, analysis of variance, assessment and prediction the effects of these changes and their modeling function (Arkhy et al, 2009).
Many studies have been carried out in Iran and other countries about land use change using remote sensing. Uchida (1997) in India By analyzing the causes of variation of agricultural lands in the arid regions of India identified prone land for agricultural purposes. Li & Yeh (2004) conducted a study using GIS and remote sensing in a fast growing region. They worked on analyzing spatial patterns of land use in the urban area and stated that the main causes of land use change are the expanding metropolis, planned development of transport and settlement. Kim & Daigle (2011) using multi-temporal remote sensing datasets determined the changes of vegetation on the summit of Cadillac Mountain. They studied images of the years of 1979, 2001 and 2007 then they detected changes in vegetation. Mohammadi and Seif (2014) IN Iran studied Mighan Basin to detection and classification of Geomorphic Units Using Multi-Temporal Satellite Data. Mighan Basin known as a geomorphological unit in the South-East Isfahan province.differences in surface and type of ground cover created smaller geomorphologic units. This units at over time are affected by Natural and human factors such as changes in land use, increasing urbanization and climate change factors.
In this study changes and disturbance that occurred by human on Karkheh river basin using satellite data and remote sensing are investigated. Many of human activities such as settlement and agriculture are located in the arid plain in lower region of the basin and in the valleys of the upper part of the basin (Masih et al, 2010).
Materials and Methods
Study Area
The study area is Karkheh river basin that located in west of Iran, with latitude from 30° to 35° north, and longitude from 46° to 49° east. Agricultural activities by modern and traditional systems done in huge areas of the basin. The total area of Karkheh river basin is 50800 km2. Runoff the basin generate from the Zagros Mountain which includes 80% area of the basin. The basin hydrologically divided into five catchments include Saymareh, Gamasiab, Kashkan, Qarasou and South Karkheh. Plains in south (lower part) of the basin is arid and those that are in the north (upper part) is semi-arid. Amount of precipitation in upper and lower part of the basin is different, the annual precipitation in lower part is about 150 mm and in upper part is about 750 mm but average of it in basin is 450 mm. About 65% of the precipitation falls during winter and in summer there is no downfall. The Karkheh Dam is built on the Karkheh River that is located in Khuzestan province (Masih et al, 2011).
Since Parthian times, vast agriculture and the lower plains of Khuzestan since Parthian times was the central of settlement activities, vast agriculture, technical innovations and great investment (Vanessa et al, 2012). The basin of Karkheh River known as a touchstone basin for the challenge program on food and water. Most part of the agricultural area in the upper of basin is rainfed. Improvement of water productivity is an upside preference in agricultural strategies of Iran (Asmala, 2012). To increase in amount of water productivity and crop in the upper plains of the basin supplemental irrigation has been recommended (Hessari et al, 2012).
Karkheh Dam Using Remote Measurement
To assess changes induced by human in the Karkheh river basin two sets Landsat satellite with following characteristics were used:
1) Landsat-5 TM measurement block 38 – 164, in 14/4/1998
2) Landsat-8 OLI measurement block 38 – 164, in 30/3/2014
Softwares used in this study include: ENVI 4.7 software to process images, Arc GIS software to measure area, and extracted layers of the environment and Microstationj.
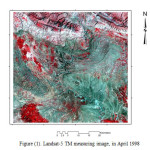
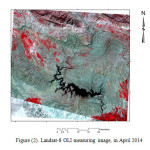
The changes on the surface of land in Figures (1) and (2) are illustrated. The Figure (1) is the Landsat TM measuring images during April 1998, and Figure (2) is the Landsat OLI measuring images during the end of March 2014. These images indicate the basin surface and plant covering changes during these years.
 |
|
 |
|
Result and Discussion
Recently, use of accurate classification technics as useful tools for generation of maps of wide area have increased. Development of monitoring system to detect changes on the lands surface. These effective techniques and remote sensing images developed practical systems to monitoring and detecting change on the land surface. The abilities of these techniques aimed to map producing and classifying of the land cove for any specific geographical area. Classifying images with this techniques need to proper training set and accurate ground information. But, gathering of accurate ground information is usually costly labor in economic charge and term of time. Efficient monitoring ensure by reliable training data, however in some cases, rely on training data is not possible. Therefore there are many serious difficulties that restrict the abilities of these monitoring systems (Bruzzone et al, 2001). In this study the ML and SVM classification methods have been used to detect the changes.
Maximum Likelihood (ML) is one of the classification method. ML is a most widely used methods of statistical estimation that obtained from the Bayes principle. In ML method each pixel classified in specific class with highest likelihood on probability values under threshold that designated by the user. ML method followed by: 1- In the study area all type of land cover is specified. 2- In each class the training pixels are determined using information about land cover for the case study. 3- For each class mean vector and covariance matrix estimate using the training pixels. 4- Eventually, each pixel classified within one type of desired land cover in the image (Asmala, 2012).
Another classification method is the Support Vector Machines. V. Vapnik and co-workers developed the SVM method in the framework of the Statistical Learning Theory. In this method, training a classifier as one decision function can be choose by implement varying the classifier’s parameters from the set of decision functions. By many pattern recognition applications, such as hand-written digit recognition and image recognition the SVM technique has been tested with good result. SVM method is a binary classification technique handle many tasks such as obtained information about land cover from satellite image in different situations of real world. Recently among remote sensing researcher using of SVM have increased (Anthony et al, 2007). Change detection is a process that provides us to see and recognize the differences of series of phenomena, features and patterns of land surface (Lu et al, 2004). Change detection is one of the most affective and important uses of the satellites (Jensen, 2005).
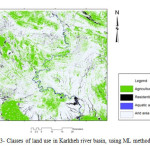
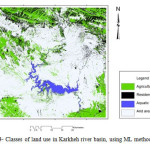
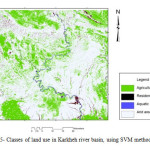
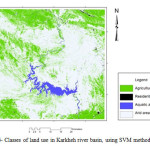
In the process of preparing plans and land use assessment, the diagnosis and having an accurate understanding of land cover changes is necessary. Surveying land use changes is a way by which we can find our interferences in the nature. Image classification in 1998 and 2014 is necessary to detect changes which occurred in the studied area. Generally, the detection can be considered as a classification with two classes. Classes with or without a specific target. Targets have been shown by pixels in the images. In this study ML and SVM algorithms are used for classification. According to the purpose of the study, Regardless of the type and location of agricultural land, all agricultural lands (harvested or not), trees and shrubs, considered as a vegetation class. Also three different features including watery, arid and residential lands are considered as three different classes. Then there are four classes (Figure 3, 4, 5, 6) for TM and OLI measuring images which are classified with LM and SVM method.
 |
|
 |
|
 |
|
 |
|
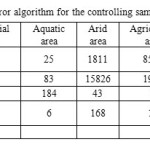
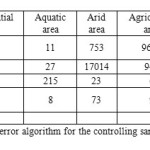
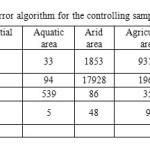
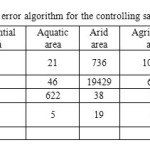
After the conversion of derived land use maps, from raster to vector, results were saved in the Text and Shape files. Then in the next stage using Arc GIS 9/3 the ground database was formed (Table’s 1, 2, 3, 4,). After applying classification methods to obtain the accuracy, error matrix was formed. Classification accuracy of a method which often is used to express the degree of accuracy of a classification is the creation of an error matrix with K*k dimension. i row of the matrix represents the number of pixels that the operator has determined and as a member of the class i from the i row (i diagonal element) that indicates the number of the pixels determined by the operator which belong to class i. In other words, this amount represents the number of pixels that are properly labeled. Other elements in i class represent the number of the elements which are incorrectly labeled. Label of each row is given by the operator using the reference data and label of each column is created by classification method. In other words i is the area of pixels for specific class in Georeference data and ii which is shown in percentage is classification accuracy that is calculated.
To calculate the classification accuracy of each classification method, a control range with %100 accuracy in the study area was designated. In fact, this area was designated in regions with specific land use. In the next stage, the control range was placed on the classification method and the area of pixels that were placed correctly and pixels that were placed incorrectly placed in the class was calculated. Finally, the following tables have been prepared and accuracy of each classification method was calculated.
 |
|
 |
|
 |
|
 |
|
According to these tables, ML method accuracy of classification in 1998, was 85/2 and the accuracy of it in 2014 was 86/5. Also the SVM method accuracy of classification in 1998 was 93/4 and 95/1 in 2014. It is clear that the classification of SVM method is more accurate than the ML method in both periods. This is due to the nature and quality of the SVM method that it is better than the ML method. After the images are classified into 4 different classes, for each class of each data set separately the area and percentage values were calculated. Results has been shown in following tables (tables 5, 6, 7, 8).
Table 5: Area of land use with ML method in 1998
|
Percent |
Area (acres) |
Land use |
|
74 |
251601/7 |
Arid |
|
25 |
83385/5 |
Vegetation |
|
0/6 |
2151/2 |
Residential |
|
0/4 |
1407/3 |
Aquatic |
|
100 |
338545/7 |
Total |
Table 6: Area of land use with SVM method in 1998
|
Percent |
Area (acres) |
Land use |
|
73 |
249471 |
Arid |
|
26 |
86319/1 |
Vegetation |
|
0/2 |
649/2 |
Residential |
|
0/6 |
2106/4 |
Aquatic |
|
100 |
338545/7 |
total |
Table 7: Area of land use with ML method in 2014
|
Percent |
Area (acres) |
Land use |
|
77 |
259828/1 |
Arid |
|
20 |
68437/1 |
Vegetation |
|
0/7 |
2304/3 |
Residential |
|
2/3 |
7976/2 |
Aquatic |
|
100 |
338545/7 |
Total |
Table 8: Area of land use with SVM method in 2014
|
Percent |
Area (acres) |
Land use |
|
79 |
267828/4 |
Arid |
|
18 |
61065/8 |
Vegetation |
|
0/25 |
859/3 |
Residential |
|
2/75 |
8792/2 |
Aquatic |
|
100 |
338545/7 |
total |
As can be seen from the values given in the tables, the area of land with various applications is different. Specifically area of the arid land has increased during 1998 to 2014 and the area of vegetation has decreased. Also the residential area has increased during this period, which may be due to population growth and increasing communication. In fact, different classification methods on different picture show that vegetation and arid land are more easily identified. The reason of lower accuracy in identifying residential area is the small size of this area and the materials and rocks which are used in this area may cause misclassification to place this area in arid class. The increase of aquatic area is noticeable which is due to construction of Karkheh dam.
As shown in the table of 5 to 8, in 1998 (before the construction of Karkheh dam) until 2014 (after making Karkheh Dam), many changes have occurred in this area. According the SVM classification method which is more accurate, the extent of vegetation in the area is decreased almost 5% (about 150,000 acres) and due to the construction of Karkheh dam the extent of arid areas and aquatic increased almost 5%. In ML method which is less accurate, the extent of vegetation in the area is decreased about 5% (about 250000 acres), instead the extent of arid area and aquatic area increased about %8.
References
- Abdullah F., Alqurashi L. K. Investigating the use of remote sensing and GIS techniques to detect land use and land cover change: A review. Advances in Remote Sensing. 2013;2(2):193-204.
- Anthony G., Greg H., Tshilidzi M. Classification of Images Using Support Vector Machines, Department of Electrical and Information Engineering, University of the Witwatersrand, Johannesburg, Private Bag X3, Wits, 2050, South Africa. 2007.
- Arkhy S., Niazi Y. Assessment of remote sensing methods for detecting land use change a case study in Dareh shahr- Elam province. Journal of Research of grassland and desert. 2009;17(1):74-95.
- Asmala A. Analysis of Maximum Likelihood Classification on Multispectral Data Applied Mathematical Sciences. 2012;6(129):6425 – 6436.
- Bruzzone L., Prieto D. F. Unsupervised Retraining of a Maximum Likelihood Classifierfor the Analysis of Multitemporal Remote Sensing Images. ieee transactions on geosciences and remote sensing. 2001;39(2).
- Frozandeh k. Human ecology, Esfahan, iran. Farhang pazhohan danesh. 2005;102.
- Geri F., Amici A., Rocchini D. Human activity impact on the heterogeneity of a Mediterranean landscape. Applied Geography. 2010;30:370–379.
- Hessari B., Bruggeman A., Akhoond-Ali A., Oweis T., Abbasi F. Supplemental irrigation potential and impact on downstream flow of Karkheh River Basin of Iran. HESSD9-13519-2012.
- Hu W.W., Wang G. X., Deng W., Li S. N. The influence of dams on ecohydrological conditions in the Huaihe River basin, China. Ecol. Eng. 2008;33:233–241.
- Isik S., Dogan E., Kalin L.,Sasal M., Agiralioglu N. Effects of anthropogenic activities on the Lower Sakarya River, Catena. 2008;75:172–181.
- Jensen J. R. Introductory Digital Image Processing: A Remote Sensing Perspective, Upper Saddle River, Prentice & Hall Pub., USA. 2005.
- Keken Z., Panagiotidis D., Skaloš J. The influence of damming on landscape structure change in the vicinity of flooded areas: Case studies in Greece and the Czech Republic. Ecological Engineering. 2015;74:448–457.
- Kim M. K., Daigle J. J. Detecting vegetation cover change on the summit of Cadillac Mountain using multi-temporal remote sensing datasets: 1979, 2001, and 2007. Environmental Monitoring and Assessment. 2011;180(1-4):63-75.
- Lautenbach S., Kugel C., Lausch A., Seppelt R. Analysis of historic changes in regional ecosystem service provisioning using land use data. Ecol. Indic. 2011;11(2):676–687.
- Li X Yeh., AG-O. Analyzing spatial restructuring of land use patterns in a fast growing region using remote sensing and GIS. Landscape and Urban Planning. 2004;69(4):335-354.
- Lu D., P Mausel., E Brondizo., E. Moran. Change Detection Techniques. Intel. J. Remote Sense. 2004;25(12):2365-2407.
- Wan L., Zhang Y., Zhang X., Shaoqun Qi., Xiaodong N. Comparison of land use/ land cover change and landscape patterns in Honghe National Nature Reserve and the surrounding Jiansanjiang Region, China. Ecological Indicators. 2015;51:205–214.
- Masih I., Uhlenbrook S., Maskey S., Ahmad M.D. Regionalization of a conceptual rainfall–runoff model based on similarity of the flow duration curve: A case study from the semi-arid Karkheh basin, Iran. Journal of Hydrology. 2010;391:188–201.
- Masih I., Maskey S., Uhlenbrook S., Smakhtin V. Impact of upstream changes in rain-fed agriculture on downstream flow in a semi-arid basin. Agricultural Water Management. 2011;100:36– 45.
- Mohammadi M., Seif A. Change Detection of Geomorphic Units of Mighan Basin Using Multi-Temporal Satellite Data. Journal of Applied Environmental and Biological Sciences. 2014;4(2):89-97.
- Navarro J., Coll M., Cardador L., Fernández A. M., Bellido J. M. The relative roles of the environment, human activities and spatial factors in the spatial distribution of marine biodiversity in the Western Mediterranean Sea. Progress in Oceanography. 2015;131:126– 137.
- Ouyang W., Skidmore A. K., Hao F., Toxopeus A.G., Abkar A. Accumulated effects on landscape pattern by hydroelectric cascade exploitation in the Yellow River basin from 1977 to 2006. Landscape and Urban Planning, 2009;93:163–171.
- S. S Myers. Harvard Medical School, Mount Auburn Hospital, Cambridge, MA, USA J Patz, Nelson Institute for Environmental Studies, University of Wisconsin (at Madison), Madison, WI, USA 2011 Elsevier B.V. All rights reserved. 2011.
- Uchida S. Temporal Analysis of Agricultural Land Use in the semi-arid Tropics of India Using IRS Data, Environmental Resources Division, Japan International Research Center for agricultural Sciences (JIRCAS). 1997
- Vanessa M. A. Heyvaert., Walstra J., Maddah et al., Curr. World Environ., Vol. 10(2), 473-481 (2015) 481 Verkinderen, P., Henk J.T. Weerts. and Ooghe, B., The role of human interference on the channel shifting of the Karkheh River in the Lower Khuzestan plain (Mesopotamia, SW Iran). Quaternary International. 2012;251:52-63.
- Yuan F., Bauer M. E., Heinert N. J., Holden G.R. Multi-level land cover mapping of the twin cities (Minnesota) Metropolitan area with multiseasonal land sat TM/ETM+ Data. Geocarto International Journal of Remote Sensing. 2005;29(4):1169-1184.
- Zhao Q., Liu Sh., Deng L., Dong Sh., Wang C., Yang Zh., Yang J. Landscape change and hydrologic alteration associated with dam construction International Journal of Applied Earth Observation and Geoinformation. 2012;16:17–26.


