Discourse and Review of Environmental Quality of River Bodies in India: An Appraisal of Physico-chemical and Biological Parameters as Indicators of Water Quality
Kumar Manoj1 and Pratap Kumar Padhy1
http://dx.doi.org/10.12944/CWE.10.2.20
The present manuscript is an account of the studies conducted on some well known surface water bodies in India, with special emphasis on the river systems, to evaluate their quality status. The review covers the water quality estimation and identification of sources contributing to water quality deterioration. Commonly employed physicochemical and biological parameters as indicators of water quality have been thoroughly discussed. Some possible measures to prevent and control pollution of water bodies have also been provided. The review also covers assessment of bed sediment environment of the surface water bodies. Many studies are available on quality assessment of surface waters and their bed sediments. However, currently, there is no literature available which compiles the works on some recent assessment of water bodies, commonly applied water quality indicators in research programmes, sources of pollution and possible pollution mitigation measures. This review is the first such attempt in this direction.
Copy the following to cite this article:
Manoj K, Padhy P. K. Discourse and Review of Environmental Quality of River Bodies in India: An Appraisal of Physico-chemical and Biological Parameters as Indicators of Water Quality. Curr World Environ 2015;10(2) DOI:http://dx.doi.org/10.12944/CWE.10.2.20
Copy the following to cite this URL:
Manoj K, Padhy P. K. Discourse and Review of Environmental Quality of River Bodies in India: An Appraisal of Physico-chemical and Biological Parameters as Indicators of Water Quality. Curr World Environ 2015;10(2). Available from: http://www.cwejournal.org?p=802/
Download article (pdf)
Citation Manager
Publish History
Introduction
Background
The ecosystem comprises both biotic and abiotic components and the interactions between them. A well functioning ecosystem is integral to the existence of the living organisms. The ‘five basic elements’ central to the ecology is well stated in the Prasna Upanishad as “kshiti, jal, pawak, gagan, sameera; panch tatwa yah adham sharira”. This means soil, water, fire (energy), sky (space) and air, respectively, are integral part of our existence and the living world surrounding us.1,2 One of the ‘basic elements’ essential for our survival is the water. Water, the most wonderful of all natural resources, is rightly called the elixir of life, as life cannot exist without it. The hymn IX of Book 10 of the Rig Veda recognizes the ability of water to give life both in physical and spiritual senses. It is responsible for nourishment, health and well being of the living organisms. The prayer emphasizes that bountiful supply of water, the most delicious sap, should always be available in pure form.3 Proper knowledge of conservation and management of water resources is necessary to maintain their purity. The Isha Upanishad says: “the nature gives resources to the mankind for their living and it is absolutely necessary to have the knowledge of using these resources”.4,5,6
Objectives
Out of many freshwater sources, rivers are the lifelines of our culture and economy; and severe water pollution is increasingly making them dead. The interlinked concepts of water pollution abatement and resource management are increasingly becoming the top priority of water conservation programmes. The availability of water does not mean only quantity; in fact, it includes the quality component as well. The river freshwater resources are increasingly under threat due to rise in pollution level, which is severely affecting the river ecology.7,8,9,10,11 Compounding this is the fact that most of the Indian rivers are rain-fed and, therefore, seasonal; and only a few rivers are perennial.
Environmental research of rivers in India is essential because rivers are the lifeline of the country. They sustain population by providing freshwater not only to produce food but also for drinking purposes. In India, regular examination of rivers is also required for the impending river linkage projects. Recently, in the 2014 budget, the Finance Minister strongly pitched for the inter-linking of rivers, which comprises 30 river-linking projects.12 The linking of rivers will also make flow of pollutants from one river to another. Thus, for conservation and management of these precious resources, research on rivers becomes all important. However, the examination of water environment is not possible without tools, and in this respect application of some physicochemical and biological indicators is central. With respect to human consumption, the water quality is use-specific. This means, for example, the quality that is required for drinking purpose varies significantly from the agricultural purpose. The water quality is need based and its suitability for a specific purpose depends on characteristics of the water supply. These characteristics are determined in terms of certain physical, chemical and biological parameters which are evaluated to find out how the water quality fits the intended use. To determine the extent of acceptable quality, there is a need to investigate the cause of a water constituent and its relationship with the observed problem. These cause-and-effect relationships help in generating suitable indicators of quality-related problem and their guideline values with respect to the suitability for the intended use. However, to identify suitable environmental indicators sufficient report on water quality constituents and the observed problems is required.7 Apart from the work of Subramanian,13 which dealt with some major South Asian Rivers, any recent review on surface water environment in India, with special emphasis on river systems, is unavailable. In addition to major rivers, assessment and monitoring of minor rivers is equally essential to protect a river system from pollution.
This communication provides the status of water and bed quality of some surface water resources in India, with special emphasis on river environment, and discusses 29 commonly applied water and sediment quality indicators and their sources. The work has been divided as general water chemistry and trace element chemistry. The trace element chemistry is further discussed as hydrochemistry and geochemistry. Although index analysis approach has also been advocated as indicators of water quality status, this aspect, along with the sediment quality guidelines, will be taken in the next review work by the authors. The present review work also highlights some future research strategies on river environment studies and possible pollution mitigation measures.
Water Resources
Water Resources Scenario, with Special Emphasis to River Basins, in India
It is crucial to acquaint about the scenarios of water resources and knowledge of river basins in India. The following two paragraphs give a brief description of the water resources and river basins in India (excerpts taken from our previous work; for details see Manoj and Padhy).14
As per estimates, in India, the total water availability, including surface and ground water, is around 1869 Billion Cubic Metres (BCM). Out of this total content, about 60% (which also includes 690 BCM from surface water) is in usable form. Various geological and topographical considerations make the remaining 40% available water, in current scenario, not accessible for consumption. Precipitation, as rain and snow, provide about 4000 BCM of available fresh waters. However, most of this water is lost to the seas through rivers.15,16,14 Agricultural sector consumes about 89% of the surface water, while industrial and domestic sectors consume 2% and 9% respectively.16,14
Based on the catchment area, the river basins have been categorized into three groups, designated as, major, medium and minor. The major river basins, thirteen in number, hold 82.4% of the total drainage basin areas, and account for 85% of the total surface flow. Moreover, these basins house 80% of the India’s population. Furthermore, the country also has some desert rivers.17,14 The classification system of river basins is given in Table 1. A short description of the major river basins is provided in Table 2. Although the country is rich in networks of river basins and is productively blessed by the South-West Monsoon (which accounts for 75% of the annual rainfall), the availability of water is increasingly emerging as a huge challenge for its socio-economic and sustainable development.17,14
Table 1: Classification System of River Basins in India
|
River Basins
|
Catchment Area in Km2 and % |
No. of Basins |
|
Major |
>20,000 (82.4) |
13 |
|
Medium |
2000–20,000 (8) |
48 |
|
Minor |
<2000 (9.6) |
52
|
(Sources14,17)
Table 2: Description of Major River Basins in India
|
Direction of Rivers |
|
(Km2) |
(BCM)
|
|
West flowing rivers |
Indus (to the border of Pakistan) Mahi Narmada Sabarmati Tapi
|
321,000
35,000 99,000 22,000 65,000 |
73.30
11.00 45.60 3.80 14.90 |
|
East flowing rivers |
Brahmani and Baitarani Cauvery Ganga Godavari Krishna Mahanadi Pennar
|
52,000 81,000 861,000 313,000 259,000 142,000 55,000 |
28.50 21.40 525.00 110.00 78.10 66.90 6.30 |
|
Eastern India |
Brahmaputra |
194,000 |
585.00
|
(Sources14,18)
Water as a Natural Resource and its Present State of Affairs
The natural surface water, which includes sea water, rivers, lakes, polar ice and glaciers, contains numerous life forms such as phytoplankton, zooplankton, fish and many other organisms. The presence of dissolved gases like oxygen and carbon dioxide is essential for the aquatic biota. The pure water, on the other hand, means water free from living organisms, especially microbial life, all types of toxic materials, and having salts within tolerable limits. The occurrence of pure water is absolutely indispensable for drinking and cooking; and is also required for industrial, agricultural and various other purposes. Although about three-fourths part of the earth is made up of water sphere, very little quantity of it is in usable form. Moreover, in search of better life quality, human beings have introduced loads of toxic materials and other contaminants into the water, from urbanization, industrialization, change in land use pattern, making water unsafe for many purposes, including drinking. Presently, water has become a precious commodity because of human-induced developmental activities, and its quality is threatened due to pollution.19
Water quality deterioration and problems incurred due to it were acknowledged by the United Nations Conference on Environment and Development, Rio de Janeiro, Brazil, 1992. The chapter 18 of the “Agenda 21” document on ‘protection of the quality and supply of freshwater resources’ lays down principles and guidelines for effective management of water resources.20 Freshwater is in essence a finite and vulnerable natural resource, essential to sustain life, development and the environment.21 The modern society and lifestyles have extensively contributed to the rise of manufacture of chemicals and use; and with this has come concerns regarding the presence of environmental chemicals in water resources. Although the terms ‘contamination’ and ‘pollution’ are used in similar sense in everyday speech and journalism, the scientific community has different meanings for them. The term ‘contamination’ is used for a chemical when it is present in a given sample without any evidence of harm, and ‘pollution’ is used in situations when the presence of the chemical is causing harm. Thus, pollutants are the chemicals which can cause environmental harms.22 Polluted surface waters critically alter the balanced ecosystem which is essential for the beneficial interactions of the living things and the environment.23 In other words, pollution leads to disturbance of harmony in the nature.
It is not that only developing countries are suffering from the acute problems of water pollution, developed countries still continue to struggle with the menace of aquatic pollution. For example, in a recent national report released in the United States on water quality, 45% of the total assessed stream miles, 32% of the total assessed estuarine and bay square miles, and 47% of the total assessed lake acres were classified as polluted.21 The water pollution affects productivity due to heavy costs associated with providing safe water. This in turn puts constraints on economic activity.22 Statistically, India holds around 17.5% of the global population and approximately only 4% of the globally available freshwater resources. In terms of available water, per capita water availability which was 1820 m3/person/year in 2001 is estimated to fall down to quantities 1341 and 1140 m3/person/year by 2025 and 2050 respectively.24,14 These projections show that by the year 2020 India would develop into a water stressed country; with per capita water availability plummeting below the benchmark quantity 1667 m3/person/year. Some factors responsible for this water stressed state are rising population and escalating demand pressure from various sectors ranging from industry to agriculture.25,14 Pollution renders freshwater undrinkable and unsuitable for consumptions in industrial and agricultural activities. Most of the substances that are regarded as pollutants are actually naturally occurring constituents of the environment, although at levels which are generally non-injurious and harmless. The problem arises when the concentration of these natural constituents increase, usually by human-influenced activities, to levels at which they may produce harmful effects.26 Water is characteristically referred to as polluted when anthropogenic contaminants impair its properties, which either makes it unsuitable for human use, such as, drinking, and/or causes a marked deviation in its capability to support its biotic components, such as, communities of fishes. Water is called a unique substance due to its inherent renewing and cleansing properties, by causing breakdown of pollutants and allowing them to settle out, or by diluting the harmful concentrations of the pollutants to tolerable levels. However, the natural purification process is time consuming, and becomes difficult when human interference adds excessive amounts of harmful contaminants in water bodies.21
Water is a vital resource, indispensable for all aspects of human civilization and ecosystem survival and health. However, in recent years, alarming situations of increasing water contamination (and consequently pollution) and scarcities have cropped up27; which demands a vast understanding of water science and associated processes. To understand water science it is essential to gain knowledge about its multi-dimensional aspects which involve the sources, composition, reactions and transport of water. The knowledge of aquatic environmental processes forms the basis of understanding water pollution and its control.
Water Body-Bed Sediment Interaction
Both surface water and its bed sediments are used by the aquatic organisms as their habitats. Alterations in the properties of water and sediments can affect the wellbeing of the habitants. This can result in sequential actions affecting all life forms including human beings. The harmful substances released into water bodies become bound to the suspended particulate matters. These particulate matters settle down at the bottom of water bodies and become part of their bed sediments. The substances, such as toxic elements, adsorbed to the bed sediments can remobilize under changed environmental circumstances, such as, change in aquatic pH and content of organic matter. Thus, bed sediments which are the regular sinks of the toxic substances can become immediate source of the same substances in the water bodies. River bed sediment degradation depicts degradation of entire river environment because it is the direct consequence of river water quality deterioration. Environmental evaluation of the river bed sediment, therefore, becomes essential to study the impact of human-induced developmental projects on its quality.
Aquatic System and Environmental Health
It should be noted that, conservation of aquatic resources is equally important in terms of both quantity as well as quality.28 The water pollution is responsible for billions of illnesses and more than two million deaths per year. The patho-physiological conditions imposed by the polluted water are immense.21,22 Water scarcity makes these health problems worse. When pollutants enter the aquatic ecosystems they not only affect the aquatic organisms, but terrestrial life, including human beings, as well. Rise in quantities of nutrients like nitrogen and phosphorous based chemicals in aquatic ecosystems may lead to increased algal growth, which in turn may give rise to the phenomenon eutrophication that is harmful to the aquatic biota.29 Pollution of aquatic resources is also spreading antibiotic resistance genes in bacteria that cause many life-threatening diseases. To check proliferation of these potential superbugs, it is urgent to check pollution of aquatic resources. Poor water and sediment quality can also cause decline in biodiversity and mass of aquatic life. Chemical pollution of surface water can cause health hazards, because such water resources are often used directly for domestic consumption or linked with shallow wells utilized for drinking water, especially in developing countries like India. In addition to domestic use such as drinking, cooking, washing and cleaning, the waterways are widely used for fishing and fish culture, and also for recreational purpose. The water pollution affects the soil health and disturbs the vegetation including crop production.22
General Water Chemistry
In India, the river basins are highly populated, urbanized and industrialized; and consequently are the major sources of water supply and receiving bodies of the urban and industrial discharges. Moreover, these rivers eventually debouch into the seas carrying wastes with them. Thus, a systematic examination and evaluation of the river system is indispensable. One of the consequences of increased developmental activities is the rise in environmental presence of substances beyond their recommended or regulatory standards. Table 3 illustrates the standard limits of some general surface water quality parameters, recommended by the Central Pollution Control Board (CPCB) and Bureau of Indian Standards (BIS), intended for specific use.30,31
Table 3: Use of Water as Proposed by CPCB and BIS
|
Classification of water for different uses designated by CPCB
|
|||||
|
Designated best use |
Class of water |
|
|||
|
Drinking water source without conventional treatment but after disinfection |
A |
pH = 6.5–8; DO = 6 mg/l or more; BOD at 20°C = 2 mg/l or less; *TC MPN#/100ml = 50 or less |
|||
|
Outdoor bathing (organized sector) |
B |
pH = 6.5–8.5; DO = 5 mg/l or more; BOD at 20°C = 3 mg/l or less; TC MPN/100ml = 500 or less |
|||
|
Drinking water source after conventional treatment and disinfection |
C |
pH = 6–9; DO = 4 mg/l or more; BOD at 20°C = 3 mg/l or less; TC MPN/100ml = 500 or less |
|||
|
Propagation of wild life and fisheries |
D |
pH = 6.5–8.5; DO = 4 mg/l or more; Free ammonia (as N) = 1.2 mg/l or less |
|||
|
Irrigation, industrial cooling, controlled waste disposal |
E |
pH = 6.0–8.5 mg/l or less; Electrical conductivity at 25°C = maximum 2250 µmhos/cm; SAR#* = 26 maximum |
|||
|
Indian standard specifications for the tolerance levels for palatability; BIS; IS:10500; 2004
|
|||||
|
Parameters
|
Desirable limit (mg/l) |
Undesirable effect outside the desirable limit |
Permissible limit (mg/l)
|
||
|
Cl- |
250 |
Beyond this limit taste, corrosion and palatability are affected |
1000 |
||
|
Ca2+ |
75 |
Encrustation in water supply structure and adverse effects on domestic use |
200 |
||
|
Mg2+ |
30 |
Encrustation in water supply structure and adverse effects on domestic use |
100 |
||
|
NO3- |
45 |
Beyond this methaemoglobinemia takes place/ may be indicative of pollution |
No relaxation |
||
|
SO42- |
200 |
Beyond this causes gastro-intestinal irritation |
400 |
||
|
TDS |
500 |
Beyond this palatability decreases and may cause gastro-intestinal irritation |
2000 |
||
|
TH |
300 |
Encrustation in water supply structure and adverse effects on domestic use |
600 |
||
|
Alkalinity |
200 |
Beyond this limit taste of water becomes unpleasant
|
600 |
||
*TC = total coliforms; #MPN = most probable number; #*SAR = sodium adsorption ratio
The Gomti River (Northern India), one of the most important tributaries of the Ganges, is a major source of water supply to the Lucknow city, the capital of the Indian state of Uttar Pradesh. Along its course the water is also used for agricultural and industrial purposes. The investigation conducted on the Gomti River revealed that the river water was highly polluted with organic wastes.32 At some of the places, the Dissolved Oxygen (DO) content recorded was nil. The average minimum DO value recorded was 0.95 mg/l. The Biochemical Oxygen Demand (BOD) (3.35-18.93 mg/l) in the river water was beyond the recommended limit of the CPCB, which made the water unfit for any domestic use including bathing. The enrichment of organic pollution load was also corroborated by the exceedingly high presence of total coliforms and faecal coliforms in the Gomti River. The river has become one of the most polluted rivers in India due to discharge of untreated domestic wastewater from populated areas such as Lucknow, Sultanpur, Jaunpur and Jagdishpur located along the basin; effluents from industries such as chemical, distilleries and sugar mills; and agricultural runoff.
The pollution load extent of the Suswa River (Northern India) in Uttarakhand was assessed.33 The river is sentimentally attached to the people of Raiwala. However, increased human activities such as waste dumping, discharge of sewage, bathing, washing and excessive fishing have considerably deteriorated the river. The human interference has not only affected the ecology of aquatic biota, but has also rendered the river water unsuitable for socio-economic purposes. Most adverse impacts on river ecology have come from the effluents of Doon distillery. The authors recorded value of total alkalinity (255.51-312.60 mg/l) and magnesium (Mg2+) (41.13-44.78 mg/l) much above their recommended desirable limits. Moreover, total hardness (TH) (229.49-249.80 mg/l) and calcium (Ca2+) (maximum value 70.35 mg/l) content were also considerably higher in water.
The Cauvery River (Southern India) is considered sacred and is one of the major rivers in India. The four streams of the Cauvery River in Mandya district, Karnataka State, which supply 80% of the local domestic water demand, was heavily influenced by the small scale sugar industries and brewery distilleries.34 The DO content at the 50% of the sampling sites was below the recommended minimum value of 5 mg/l essential for the survival of the aquatic biota. The discharge of effluents of the industrial units were not only responsible for the increased levels of turbidity, total dissolved solids (TDS), sodium chloride, and reduced levels of DO and transparency; but also adverse impacts on the abiotic and biotic components of the aquatic ecosystem including low diversity of the fauna. The study highlighted that the inefficient treatment of effluents and limitations of the common effluent treatment plant (CETP) in treating wastewaters were the principle reasons for the water quality deterioration.
Pollution status of the River Chambal (Central India) in Madhya Pradesh State with respect to its use for public water supply, irrigation and aquaculture was provided.35 Some of the places recorded considerably higher values of the parameters such as total alkalinity (290 mg/l), TDS (500 mg/l) and BOD (5.67 mg/l). Overall the river was classified as oligosaprobic indicating that the river was relatively less polluted and suitable for various uses as well as growth of the aquatic animals.
Kanhan River and its two important tributaries namely Pench and Nag Rivers flow through the Central Indian plateau region. The water resources are extensively used for urban water supply and agricultural purposes in the region. Pollution load of the Kanhan River system was evaluated, and an investigation was also carried out to determine suitability of the river water quality for irrigational activities.7 Based on sodium adsorption ratio (SAR), percentage of sodium (Na%) and residual sodium carbonate (RSC) values, the Kanhan and Pench Rivers showed fairly good water quality for irrigational purposes. The waters also displayed suitability for drinking after conventional treatment. However, the Nag River showed heavy influence of human-activities on its water quality. For examples, total alkalinity was found in the range of 374 to 486 mg/l; and TDS crossed the recommended desirable limit of 500 mg/l. The most important noticeable result was complete absence of DO in all water samples of the river. The chemical oxygen demand (COD) was recorded in the range of 124-172 mg/l; and total coliforms and faecal coliforms were too numerous to count. The analysis of the basin revealed that the sewage from the Nagpur city had exceedingly deteriorated the Nag River water quality rendering it unsuitable for domestic and agricultural purposes.
The Mahanadi River system (Eastern India) is the largest river system in the Odisha state and third largest system in the peninsular India. The water of the river basin is extensively utilized for irrigation use (about 87% of the total consumption) as compared to industrial, municipal and other useful purposes. Hydrochemistry of the Mahanadi River system was assessed, and was also evaluated the suitability of the river water system for irrigational activities.36 Most of the stations displayed suitability of the water for irrigation with respect to indices such as SAR, permeability index (PI), Na%, magnesium hazard, Kelly’s index, and plots United States Salinity Laboratory (USSL) diagram and Wilcox diagram. However, some polluted stations located downstream to the major towns of the basin namely Sambalpur and Cuttack showed that the water was unsuitable for irrigational activities. The discharge of sewage from Sambalpur and Cuttack had polluted the downstream locations of the basin. The human-induced change in character of water was also evidenced at the Atharbanki creek. The pH here ranged from 3.66 to 5.07. The acidic character of the water was due to discharge of acidic effluents from the fertilizer-based industries like the Paradip Phosphate Limited. The negative impact of the human activities in the freshwater zone was also noticed from the recorded values of the sulphates (SO42-) (as high as 360.50 mg/l) much above the recommended desirable limit for the domestic consumption.
The Hindon River (Northern India) is a major freshwater resource for the greatly populated and largely rural population of the western part of the Indian State of Uttar Pradesh. The impacts of industrial and urban wastewater on the Hindon River water quality was assessed.37 The study not only revealed the contents of water quality parameters exceedingly above the prescribed limit of CPCB and BIS, and its unsuitability for any domestic use; but also markedly highlighted the interrelationship between human activities and quality of water environment. The Ca2+, chloride (Cl-) and nitrate (NO3-) ions displayed alarming concentration in river water as high as 402.20 mg/l, 1312.10 mg/l and 250 mg/l respectively. More alarming situation was recorded for the organic pollution load, which was obvious from the values of DO (3.1-4.03 mg/l), BOD (27-51 mg/l) and COD (85-337.4 mg/l). Industrial estates present in the Ghaziabad, Noida and Sahibadad areas were principally responsible for the highly polluted status of the river. Disposal of wastewater and garbage dumping from the urban locality of the Eastern Delhi drastically contributed to the deteriorating status of the river. The human interference was not only affecting the self-purification capacity of the river, but also entire ecosystem quality of the River Hindon.
The investigation of the water chemistry of the Chhoti Gandak River (Northern India) revealed its hard quality (as high as 370 mg/l) at most of the places.8 The study found levels of TH and Mg2+ exceeding the safety criterion recommended for drinking purpose at some of the places that would result in physical disorders. The deterioration of the river environment had its origin from the wastes of domestic and agricultural sectors. However, ironically, with respect to the agricultural use, the water was recorded as good quality for irrigation at most of the sites based on SAR and Na% values and plots such USSL and Wilcox diagrams. Recently, SAR, Na%, PI, USSL diagram and Wilcox diagram tools were also used to investigate the suitability of the Damodar River (Eastern India) and its canal waters for the agricultural purposes.38 Although the study showed suitability of the river system for agricultural activities, severe organic pollution load was noticed in the river basin. The BOD (12.3 to 28.3 mg/l) and DO (1.3 to 3.8 mg/l) values indicated that the river and canal waters were organically rich due to dumping of garbage, domestic sewage, industrial effluents; and excessively decaying of the dead water hyacinth in the main river.
The influence of human-induced developmental activities on the Narmada River (Central India), which is considered as the life-line of the Madhya Pradesh State, was investigated for its potable nature.10 The study highlighted activities such as discharge of industrial effluents from industrial units (for example, Security Paper Mill), domestic wastes, untreated municipal sewage, and agricultural run-off were principal reasons for the increased deterioration of the river water quality and loss of its potable nature. For examples, the river water displayed TH in the range of 515-689 mg/l and Cl- in the range of 270-342 mg/l, which were beyond the standard desirable limit of the BIS.
The Sabarmati River (Western India), flowing through the Ahmedabad city, the commercial capital of the State of Gujarat, presents another example of river water exploitation. The river water is used as a source of drinking water and irrigation as well as sink for the wastewaters of the industries, mostly textile mills, and urban areas. The study conducted on the river found that the Sabarmati water quality at Ahmedabad was adversely affected due to discharge of industrial effluents, domestic wastewaters, and agricultural wastes.9 The extended urbanization of the city had increased the pollution load of the river. The water was found more polluted in the main city area as compared to the upstream zone where values of parameters such as TH, Ca2+, Mg2+, Cl-, BOD and COD were recorded as high as 459.43, 242.84, 216.58, 1822.30, 133.28 and 549.92 mg/l respectively. Moreover, the number of faecal coliforms, recorded as 9561 MPN/100 ml, was also beyond the desirable limit of CPCB (class C). The negligible values of DO and high salinity indicated catastrophic situation of the river ecosystem.
The Wardha River (Western India) is an important river of the Maharashtra State and is widely used for drinking, industrial and agricultural purposes. Water quality of the river Wardha was examined which found it mildly polluted.39 The BOD values, which ranged from 2.68-6.53 mg/l, indicated unsuitability of the river water for domestic consumption due to organic pollution load. The higher content of nutrients and organic substances in the river was attributed to the surface runoff and sewage inflow.
Yamuna River (Northern India) is one of the most exploited water resources in India. The various urban centres located along the Yamuna basin draw its fresh water for many human-activities. Water quality of the River Yamuna was investigated which found it unsafe for the human use.40,41 The water showed highly alkaline nature and recorded values as high as 240 and 310 mg/l in the two studies. The alkalinity crossed the desirable limit of the BIS at most of the sampling sites. Moreover, the water was also reported very hard at most of the sites where its value reached as high as 475 mg/l. Also, with respect to the Ca2+ content (72.8-86.4 mg/l) the water was found unsuitable for domestic use. The study also reported very high salinity of the Yamuna which was evident from the contents of Na+ (404.9-524 mg/l) and Cl- (180-218 mg/l)41. The river was also reported organically polluted with BOD level showing 3-8 mg/l range. The investigations of the authors indicated that the industrial effluents and the entire domestic/municipal wastewater of the urban centres of the river basin are discharged either untreated or only partially treated into the Yamuna River.
Some studies on wetland ecosystems have also been conducted in India. For example, impact of human activities, such as industries and agriculture, on the water quality of the Kalakho Lake, Rajasthan, was investigated.42 The analysis of results indicated severe depletion of lake water quality and was found unsuitable for drinking purposes, wildlife propagation and pisciculture. Agricultural runoff and dumping of wastes from domestic and municipal sources were identified as principal water degrading agents. In this seasonal study (summer, monsoon and winter), the minimum BOD value recorded was 34.4 mg/l and the average value was 42.26 mg/l. In order to save the wetland from being declared ecologically dead, restoring the quality of lake was immediately needed. Dalvoy Lake (Mysore, Karnataka) water quality for domestic and agricultural purposes was evaluated.43 The parameters such as TDS (773-837 mg/l) and Mg2+ (47-75 mg/l) crossed the desirable regulatory standards in all water samples. With respect to Ca2+, 76% of the samples exceeded desirable recommended standard of the BIS. Although based on SAR, PI values and USSL diagrams the water appeared suitable for agriculture, the bicarbonate (HCO3-) content of water was abnormally high which indicated unsuitability of the water for agricultural uses. For irrigation purposes, HCO3- content in the range of 1.50-7.50 meq/l is considered as moderately safe.44 When the level exceeds 7.50 meq/l the water becomes unsafe for the irrigation works. The study recorded bicarbonate in the range of 470-587 mg/l which corresponded to 7.70-9.62 meq/l.
The examination of water environment is not possible without tools, and in this respect application of some physicochemical and biological indicators is central. The literature review shows that the parameters commonly employed to evaluate general water quality are: pH, electrical conductivity (EC), TDS, alkalinity (especially as HCO3-), TH, Ca2+, Mg2+, sodium (Na+), potassium (K+), Cl-, SO42-, phosphate (PO43-), NO3-, nitrite (NO2-), ammonical nitrogen (AN), DO, BOD, COD and coliforms. To test suitability of the surface water for agricultural purposes some of the indicator tools are SAR, Na%, PI, RSC, USSL diagram and Wilcox diagram. A summary of general water chemistry of some surface water bodies, with special emphasis on rivers, is displayed in Tables 4, 5 and 6.
Table 4: Water Quality of Some Freshwater Systems with Respect to Six Physicochemical Parameters
|
Water body
|
Range |
pH |
EC |
TDS |
Total Alkalinity |
TH |
Ca2+ |
|
Hindon River |
Min Max |
7.40 7.89 |
0.83 5.04 |
222.23 2426.30 |
347.00 596.30 |
235.10 459.90 |
64.50 402.20 |
|
Sabarmati River |
Min Max |
7.03 8.96 |
‒— |
‒— |
‒— |
119.54 459.43 |
71.16 242.84 |
|
Chhoti Gandak River |
Min Max |
6.24 8.61 |
0.121 0.310 |
60.1 192.6 |
‒— |
45 370 |
6 36 |
|
Cauvery River |
Min Max |
5.30 6.20 |
‒— |
51 1620 |
‒— |
75 118 |
12 19 |
|
Yamuna River (2011) |
Min Max |
6.43 9.13 |
0.340 0.734 |
‒— |
123.00 240.00 |
230 475 |
‒— |
|
Yamuna River (2013) |
Min Max |
7.30 7.70 |
0.990 1.285 |
705.00 785.00 |
175.00 310.00 |
252.00 304.00 |
72.80 86.40 |
|
Kalakho wetland |
Min Max |
6.95 8.40 |
0.510 0.627 |
352.00 411.00 |
112.00 197.33 |
70.67 123.77 |
‒— |
|
Dalvoy lake |
Min Max |
7.44 8.54 |
1.40 1.52 |
773.00 837.00 |
‒— |
‒— |
66.00 98.00 |
|
Suswa River |
Min Max |
7.34 7.54 |
‒— |
‒— |
255.51 312.60 |
229.49 249.80 |
56.67 70.35 |
|
Gomti River |
Min Max |
7.92 8.36 |
0.357 0.458 |
236.60 283.08 |
189.13 216.88 |
157.67 193.92 |
35.62 45.06 |
|
Damodar River |
Min Max |
6.46 7.80 |
0.381 1.520 |
203.00 823.00 |
‒— |
56.00 296.00 |
15.23 82.56 |
|
Narmada River |
Min Max |
7.68 9.90 |
0.272 0.462 |
‒— |
‒— |
515.00 689.00 |
‒— |
|
Wardha River |
Min Max |
7.59 8.11 |
‒— |
163.00 297.00 |
‒— |
71.00 175.00 |
‒— |
|
*Mahanadi River |
Min Max |
3.23 7.52 |
0.125 0.729 |
61.40 395.20 |
‒— |
34.67 215.80 |
‒— |
|
#Kanhan River |
Min Max |
7.10 8.17 |
0.227 0.970 |
136.00 582.00 |
158.00 486.00 |
142.00 246.00 |
24.00 62.00 |
|
Chambal River |
Min Max |
7.60 9.33 |
0.100 0.884 |
260.00 500.00 |
70.00 290.00 |
42.00 140.00 |
9.61 44.08
|
*Only freshwater zone and not estuarine system; #Including tributaries; pH in pH units; EC in mS/cm; other parameters in mg/l; Min = minimum, Max = maximum
Table 5: Water Quality of Some Freshwater Systems with Respect to Seven Hydrochemical Parameters
|
Water body
|
Range |
Mg2+ |
Na+ |
K+ |
Cl- |
SO42- |
PO43- |
NO3-
|
|
Hindon River |
Min Max |
‒— |
‒— |
‒— |
203.20 1312.10 |
36.40 162.40 |
‒— |
106.00 245.00 |
|
Sabarmati River |
Min Max |
40.87 216.58 |
‒— |
‒— |
41.52 1822.30 |
1.36 7.96 |
1.89 7.96 |
0.30 3.16 |
|
Chhoti Gandak River |
Min Max |
4.8 42 |
12 86 |
2.1 116 |
3.5 121
|
88 186 |
‒— |
14 38 |
|
Cauvery River |
Min Max |
11.60 23.00 |
6.80 40.00 |
6.20 16.20 |
176 254 |
0.00 0.40 |
2.50 8.50 |
0.00 0.05 |
|
Yamuna River (2011) |
Min Max |
‒— |
‒— |
‒— |
18.00 32.00 |
‒— |
‒— |
‒— |
|
Yamuna River (2013) |
Min Max |
13.60 24.30 |
404.90 524.00 |
18.10 23.80 |
180.00 218.00 |
‒— |
‒— |
‒— |
|
Kalakho wetland |
Min Max |
‒— |
‒— |
‒— |
22.00 55.93 |
‒— |
‒— |
‒— |
|
#Dalvoy lake |
Min Max |
47.00 75.00 |
119.00 161.00 |
168.00 179.00 |
5.00 27.00 |
‒— |
13.00 28.00 |
|
|
Suswa River |
Min Max |
41.13 44.78 |
‒— |
‒— |
16.77 22.18 |
‒— |
0.03 0.11 |
‒— |
|
Gomti River |
Min Max |
16.29 20.41 |
27.72 43.42 |
4.18 7.45 |
2.99 12.24 |
7.65 18.41 |
0.06 0.49 |
0.16 0.85 |
|
Damodar River |
Min Max |
1.94 21.87 |
26.40 83.00 |
3.50 13.60 |
8.00 74.00 |
52.82 120.37 |
0.13 0.30 |
1.33 6.31 |
|
Narmada River |
Min Max |
‒— |
‒—
|
‒— |
270.00 342.00 |
‒— |
0.16 0.28 |
‒— |
|
Wardha River |
Min Max |
‒— |
‒— |
‒— |
‒— |
‒— |
0.084 0.870 |
0.19 0.91 |
|
Mahanadi River |
Min Max |
‒— |
‒— |
‒— |
4.26 100.68 |
1.29 360.50 |
‒— |
0.08 3.73 |
|
Kanhan River |
Min Max |
13.00 28.00 |
21.00 183.00 |
3.00 33.00 |
19.00 102.00 |
8.00 23.00 |
0.10 1.40 |
3.00 32.00 |
|
Chambal River |
Min Max |
‒— |
14.30 54.40 |
‒— |
15.62 80.94 |
3.50 45.00 |
‒— |
0.008 0.025
|
#Na+ + K+ value; all parameters in mg/l; Min = minimum, Max = maximum
Table 6: Water Quality of Some Freshwater Systems with Respect to Six Hydrochemical and Biological Parameters
|
Water body
|
Range |
HCO3- |
DO |
BOD |
COD |
TC |
FC
|
|
Hindon River |
Min Max |
‒— |
3.10 4.03 |
27.00 51.00 |
85.00 337.40 |
‒— |
‒— |
|
Sabarmati River |
Min Max |
‒— |
0.32 6.27 |
11.56 133.28 |
25.14 549.92 |
‒— |
1124 9561 |
|
Chhoti Gandak River |
Min Max |
98 451 |
‒— |
‒— |
‒— |
‒— |
‒— |
|
Cauvery River |
Min Max |
‒— |
1.34 5.50 |
1.20 1.80 |
17.50 54.00 |
‒— |
‒— |
|
Yamuna River (2011) |
Min Max |
‒— |
4.90 8.50 |
3.00 8.00 |
11.00 24.00 |
‒— |
‒— |
|
Yamuna River (2013) |
Min Max |
‒— |
‒— |
‒— |
‒— |
‒— |
‒— |
|
Kalakho wetland |
Min Max |
‒— |
5.20 12.10 |
34.40 53.93 |
103.74 153.75 |
‒— |
‒— |
|
Dalvoy lake |
Min Max |
470.00 587.00 |
‒— |
‒— |
‒— |
‒— |
‒— |
|
Suswa River |
Min Max |
‒— |
7.20 8.06 |
0.51 1.10 |
2.58 3.76 |
‒— |
‒— |
|
Gomti River |
Min Max |
‒— |
0.95 7.41 |
3.35 18.93 |
10.76 38.68 |
8.2E+03 2.8E+09 |
8.1E+03 2.7E+09 |
|
Damodar River |
Min Max |
72.00 196.00 |
1.30 3.80 |
12.30 28.30 |
‒— |
‒— |
‒— |
|
Narmada River |
Min Max |
‒— |
4.10 4.60 |
‒— |
‒— |
‒— |
‒— |
|
Wardha River |
Min Max |
‒— |
4.19 7.95 |
2.68 6.53 |
17.19 38.43 |
‒— |
‒— |
|
Mahanadi River |
Min Max |
‒— |
‒— |
‒— |
‒— |
‒— |
‒— |
|
Kanhan River |
Min Max |
‒— |
0.00 8.50 |
‒— |
7.00 172.00 |
#36.00 TNC |
#15.00 TNC |
|
Chambal River |
Min Max |
‒— |
4.86 14.59 |
0.60 5.67
|
‒— |
‒— |
‒— |
TC and FC (faecal coliforms) in MPN/100 ml; other parameters in mg/l; Min = minimum, Max = maximum; TNC = too numerous to count; #CFU (colony forming unit)/100 ml
pH
The pH, one of the most important water quality measurements, can be defined as the negative logarithm of hydrogen ion concentration; and is used to express the intensity of the acidic or alkaline condition of water solution.45,46 The rivers are usually classified as alkaline water type, and display pH in the range of 6.8-7.8 units.47 The concentration of hydrogen ions in natural waters is chiefly associated with the quantitative ratio of carbonic acid and its dissociated ions; and therefore waters having large quantities of dissolved carbon dioxide have pH<7.0. On the other hand, hard waters display slightly alkaline condition due to dissolution of calcium and magnesium containing limestone and other minerals. In surface waters, the changes in pH values are closely connected to the photosynthetic activities, because of carbon dioxide consumption by plants, and organic matter decomposition. Discharge of mine-drainage waters; and industrial wastewaters, such as from metallurgical industries, containing mineral acids can significantly alter the pH of the receiving water systems. Sulphur-oxidizing bacteria convert sulphur, sulphides or iron pyrites, present in wastewaters, into sulphuric acid and sulphates. Moreover, hydrolyses of salts of elements such as iron (Fe), zinc (Zn), copper (Cu) and cadmium (Cd), present in mine-drainage waters, also play a significant role in pH determination of the receiving water bodies. Through similar processes, the municipal and domestic wastes can also change the pH of the receiving freshwater ecosystems. The concentration of hydrogen ions greatly impact chemical and biological processes of the water ecosystems; such as growth of aquatic biota, especially fish population. Acidified waters can also cause mobilization of toxic metals.26 Beyond the pH range of 6.5 to 8.5, it affects mucous membrane and water supply system. It is also important in corrosion control, as low pH causes corrosion of water supply system. High pH affects taste and gives soapy feel. The pH is important in environmental engineering practices such as water supplies: water and wastewater treatment processes, water softening, disinfection and chemical coagulation.45,26
Electrical Conductivity and Total Dissolved Solids
Electrical conductivity, also called specific conductance, is a measure of the ease with which electric current can pass through the water system. Because pure water is a weak electrolyte, the EC of an aqueous solution depends on the occurrence of charged ions. As the relation is close to linear between EC and number of ions in solution, with the increase of latter the former also increases. Because EC of water depends on the overall concentration of ions, it is regularly used as an index of the TDS. However, EC has one limitation; that it does not respond to the presence of dissolved uncharged substance, such as silica.48 In water chemistry, TDS is a measure of the dissolved substances small enough to be filtered through a 2 µm sieve; and consists mostly of inorganic salts, organic matter and other dissolved materials.49,50 The principal constituents of the TDS are generally Ca2+, Mg2+, Na+ and K+ as cations; and HCO3-, Cl-, SO42-, and NO3- as anions.51 Dissolved solids can affect the palatability of drinking water and can be indexed as: excellent (<300 mg/l), good (300-600 mg/l), fair (600-900 mg/l), poor (900-1200 mg/l) and unacceptable (>1200 mg/l)51. However, it should be noted that TDS is the overall picture of water, which does not differentiate among the constituents. Presence of any specific parameter above the desirable limit can make water unpalatable. Geology of the drainage area and processes such as evaporation and precipitation, naturally determine the concentration and composition of TDS in surface waters.49 Sources such as municipal sewage, wastewater runoff from urban areas, industrial effluents/wastewater, agricultural runoff and mining runoff can overwhelmingly alter the TDS of natural waters. TDS can be used as preliminary indicator of general drinking water quality. Because TDS is a measure of dissolved ions and is also directly related to conductivity, it is useful as a suitable indicator for water quality evaluation. High level of TDS concentrations may indicate existence of potentially harmful contaminants such as nitrates, metals, and other agricultural or industrial chemicals50. Dissolved solids in water may produce toxicity through enhanced salinity and alteration in the ionic composition and toxicity of specific ions. Increase in salinity may limit biodiversity, bring alterations in structure of natural biotic communities, produce acute or chronic effects in organisms at specific life stages, and result in exclusion of less-tolerant species.49 Since density of the water determines the water flow into and out of cells, change in TDS concentration may bring detrimental effects in the biota. High concentration of TDS may produce ecological disturbances such as water clarity reduction, decrease in photosynthesis, combination with toxic chemicals and an increase in water temperature.52 High level of TDS (>500 mg/l) can cause excessive scaling in boilers, water heaters, water pipes and many household appliances. The scaling severely impacts the service life of the appliances and makes economic costs higher.51
Alkalinity and Bicarbonate
The alkalinity of a water body is a measure of its buffering capacity and is the sum total of all titrable bases present in water. In simple terms, alkalinity is a measure of the capacity of the water body to neutralize acids. The alkalinity of natural waters is mainly a function of salts of strong bases and weak acids; and is primarily caused by the concentrations of bicarbonate, carbonate and hydroxide. HCO3- is the most important contributor to alkalinity in natural waters and it arises from the dissolution of carbon dioxide in water bodies.45,26
CO2 + H2O → H2CO3 (carbonic acid)
H2CO3 → H+ + HCO3- (bicarbonate)
HCO3- → H+ + CO32- (carbonate)
However, the carbon dioxide dissolution in water only provides little quantity of HCO3-; and it primarily comes from dissolution of limestone as demonstrated below53:
CaCO3 + CO2 + H2O → Ca2+ + 2HCO3-
(Calcitic limestone)
CaCO3∙MgCO3 + 2CO2 + 2H2O → Ca2+ + Mg2+ + 4HCO3-
(Dolomitic limestone)
HCO3- in water may also come from exchange reactions involving hydrogen ions in water and basic ions in sediment such as calcium, magnesium, sodium and potassium as illustrated below53:
Sediment-Ca2+ + CO2 + H2O → Sediment-H+ + HCO3- + Ca2+
Other potential sources of alkalinity include presence of compounds, in natural waters and wastewaters, such as ammonia and salts of weak acids, for examples silicates, borates and phosphates; and salts of organic acids such as acetic, humic and propionic acids.26
Although alkalinity carries little public health significance, in large quantity it imparts bitter taste to water and makes it unpalatable. For domestic use, water supplies with alkalinity less than 200 mg/l are desirable, as beyond this limit the taste becomes unpleasant30. Alkalinity data are used in water applications, such as, to determine buffering capacity of freshwaters and wastewaters, chemical coagulation and water softening processes, aeration of water, anaerobic digestion, boiler water in industries, corrosion control, and ammonia stripping.45,26 Alkalinity in excess of concentrations of calcium and magnesium in water plays an important role in determining its suitability for irrigation.26 High content of HCO3- in irrigation water can cause precipitation of calcium and magnesium, which result in increase in relative proportion of sodium in water as sodium bicarbonate. RSC, the expression which measures HCO3- hazard, with value exceeding 2.5 meq/l can result in: build up of salt in soil, clogging of pores of soil, obstruction of water and air movement in soil, and consequently degradation of the physical structure of soil.54 HCO3- levels exceeding 7.50 meq/l is considered unsafe for irrigation purposes. High HCO3- content in irrigation water can induce toxicity such as chlorosis in many crops. This enhances phosphorus solubility, and consequently its large uptake interferes with metabolism of Fe (iron) in plants. Because of high pH, high HCO3- level can also lead to micronutrient deficiency, such as, Fe deficiency in many crops. In plants, HCO3-has a tendency to oxidize Fe into biologically inactive ferric form44.
Calcium, Magnesium and Hardness
Calcium and Magnesium are essential nutrients and are required for many metabolic functions. They are commonly found in natural water and contribute mostly to the water hardness. Although other multivalent cations such as Fe2+, Mn2+ (manganese), Sr2+ (Strontium), Zn2+ and Al3+ (Aluminium) also contribute to hardness, their involvement is usually insignificant. The natural source of Ca and Mg is the mineral rocks from which they are leached. When present at high concentrations, they reduce the utility of water for domestic purposes45. With respect to absorption in living tissues, mainly small intestine, Ca and Mg are competitive, and excess Ca can partially inhibit Mg absorption55. The content of Mg in drinking water increases with water hardness. Mg salts can produce laxative and diuretic effects in persons, especially those unaccustomed to its high dosage45. Chemically, hardness is the sum of concentration of polyvalent cations dissolved in water. Hardness is usually categorized into two groups, carbonate hardness and non-carbonate hardness. While the former is due to the presence of bicarbonate (Ca(HCO3)2, Mg(HCO3)2) and carbonate (CaCO3, MgCO3) salts of polyvalent cations Ca2+ and Mg2+, the latter type is contributed by substances such as CaCl2, MgCl2 and MgSO4 salts56. Based on hardness, water can be classified, in term of CaCO3 equivalent, as: soft (<75 mg/l), moderately hard (75-150 mg/l), hard (150-300 mg/l) and very hard (>300 mg/l)57. Naturally, hardness in surface waters is primarily a function of the solubilisation of the geological minerals and the dissolution of atmospheric CO2. Areas having limestone formations are likely to show high hardness in surface waters because of dissolution of bicarbonates and carbonates. Hardness of water is also derived from weathering of dolomite and gypsum. Hardness has been shown to display mitigation actions against toxicity of some metals. However, the mitigating effects are most likely due to individual polyvalent hardness ions (for example, Ca2+ and Mg2+) competing antagonistically against the toxic metals for binding to active sites on or in the organism56. Economically hard waters are undesirable for two major reasons: hard water consumes more soap which causes economic loss to consumers; and water hardness can affect its use for industrial works, as it can result in scale formation in industrial systems such as hot-water heaters, pipes, boilers, and other units45,56. Magnesium hardness, especially with respect to SO42- ions, can produce laxative effect in individuals not accustomed to it45.
Sodium
Sodium is a widely distributed element in most natural waters. In surface water, its concentration may vary from less than 1 mg/l to more than 300 mg/l45. Its natural source in surface water includes rock-water interaction and leaching from terrestrial environment. Mineral deposits, discharge of sewage and industrial effluents, movement of agricultural chemicals, transport of animal and human waste can all significantly enhance Na content in water resources. Sodium salts are commonly used in industries such as chemical factories, for example, use of sodium chloride in the production of sodium chlorite, sodium hypochlorite, caustic soda and chlorine58; glass; soap; paper; pharmaceutical; and food processing units. Metallic Na is employed in manufacturing sodium hydride, titanium production, laboratory reagents, and as a catalyst for synthetic rubber. Use of salts, such as sodium hypochlorite, sodium fluoride and sodium bicarbonate as water treatment chemicals in corrosion control, coagulation, and disinfection raises environmental sodium58. In due course, sodium salts as water softeners also enter surface water systems. Although Na is an essential nutrient for life, at high concentration, as salts of Cl- and SO42-, it makes water unpalatable for humans by imparting salty taste to it. Moreover, high level of Na can also cause hypertension. Its High content in water render the operations of boilers difficult; and make irrigation water, which can result in deterioration of soil, unsuitable for use45. Usually Na salts do not produce acute toxic effects due to efficiency of the kidneys in removing them. However, excessive intake of salts, especially sodium chloride, aggravates chronic congestive heart failure; and may result in some heightened health effects such as cerebral and pulmonary oedema, muscular twitching and rigidity; as well as nausea, vomiting and convulsions. Excess Na ingestion can also cause depletion of potassium levels in body58.
Potassium
In relation to the magnitude of occurrence in the earth’s crust and solubility of the compounds, potassium is very similar to sodium. However, due to weak migratory capacity potassium content is lower in surface waters. This happens because it actively participates in biological activities such as absorption by microorganisms and living plants47. Potassium is an essential element; and is naturally present in water from weathering and erosion of silicate, mica, feldspars (such as orthoclase and microcline) and clay materials/minerals59; and decay and leaching of plant and animal (waste) residues. As potassium is one of the three primary plant nutrients, others being nitrogen and phosphorous, essential for plant growth and development, its compounds are widely employed in modern agricultural practices as chemical fertilizers. Potash mining and use of compounds such as potassium chloride in aluminium recycling, metal electroplating, steel-heat treating, water softening, and production of potassium hydroxide by the chloralkali industry significantly raise environmental potassium. Application of potassium hydroxide in industries include industrial water treatment, production of potassium carbonate, different types of potassium phosphate, several other potassic compounds, and manufacture of soap. Another industrial chemical potassium carbonate is used to produce television and computer monitor in glass industry, cement, photographic chemicals, a few types of fire extinguishers, textiles, animal feed supplements and food products. The other non-fertilizer use of potassium, through potassium bicarbonate, is in brewing industry, pharmaceuticals and manufacturing of synthetic rubber60. Exposure to potassium in water can also occur from the application of potassium permanganate as an oxidant in drinking water treatment process, and application of potassium salts as water softeners. When present in excess amount, potassium can interfere with normal magnesium uptake. Study data suggests that excess potassium causes health effects mostly to high-risk groups, which include individuals with kidney malfunction, adrenal insufficiency, heart disease, coronary artery disease, diabetes, hypertension, pre-existing hyperkalaemia; infants and older individuals61.
Chloride
The chloride is generally distributed in the environment in the form of salts like sodium chloride, potassium chloride, calcium chloride and magnesium chloride. The Cl- ion is highly mobile, due to the high solubility of its salts, and is transported to the river basins and other natural streams located close to its source62. The natural weathering of bedrock/minerals, surficial materials and soils cause leaching of Cl- into water bodies. Concentration of Cl- in surface water can also occur by the evapo-transpiration process. Wet deposition of Cl- from anthropogenic sources such as power generation and manufacturing can also occur in surface waters. It is widely used in chloralkali industries; and other units, such as metal processing, textiles and dyeing, petroleum production, paper production, food processing and chemical fertilizers. Water softeners, used in drinking water and wastewater treatment facilities to treat water hardness, can release considerably large amounts of Cl- in the aquatic environment. Salts of Cl- are used in agricultural products, such as pesticides and fertilizers, and also as an animal feed additive. Chloride, as a salt, from animal feeds and use of manure as a fertilizer, may discharge into surface water. Other agricultural sources of Cl- to the receiving water include use of potassium chloride in chemical fertilizers; and irrigation of agricultural fields from deep groundwater sources followed by concentration, dissolution and runoff of Cl- salts63. The concentration of Cl- between 1 and 100 mg/l is taken as normal in freshwater. Their excessive presence in water body makes ecological systems vulnerable as there are no biological processes that remove them. Although, Cl- is significant component of sewage, at water treatment plants they are not typically removed due to high costs associated with their removal. High Cl- concentrations can interfere with the osmoregulatory mechanisms of the freshwater organisms, which may hinder their survival, growth and reproductive capacity. Amphibians, such as frogs, which lay their eggs in vernal pools, are especially more vulnerable to high Cl- concentrations as eggs and during the course of metamorphosis64. WHO (World Health Organisation) has not proposed any health based guideline for Cl- in drinking water, probably because intake of large quantities of Cl- can be tolerated; provided the freshwater is also taken concomitantly. As shown in some investigations, hypertension in relation to sodium chloride intake is associated with the sodium rather than the chloride62.
Sulphate
Sulphate is one of the major ions occurring in all surface waters. Sulphates enter water naturally from chemical weathering and dissolution of minerals such as gypsum, epsomite and barite65; oxidation of elemental sulphur and sulphides; and decomposition of animal and plant residues26. Presence of SO42- in excess is taken as an index of pollution in river water. The release of SO42- ions from several wastes discharged into the surface water can exceedingly augment sulphate content in natural water66. Human-induced sources of sulphates in water are wastewater drainage from mines, smelters and industrial units such as tanneries, kraft pulp and paper mills, textile mills, and metal and plating units. Sulphates and sulphuric acid products are also used in manufacturing dyes, soaps; biocides such as fungicides, insecticides and algicides (copper sulphate); fertilizers, chemicals, cosmetics, astringents; and in sewage treatment. As a sedimentation agent, alum (aluminium sulphate), is used in the treatment of drinking water. Anthropogenic sulphur dioxide pollution, as a result of combustion of fossil fuels and metallurgical roasting processes, and consequent prolonged atmospheric deposition may also increase the quantity of sulphate in surface waters65. Human-actions such as disposal of municipal sewage, application of sulphate fertilizers (for example, ammonium sulphate) and their subsequent drainage, and runoff are other direct sources of sulphate in aquatic ecosystems26. Unlike nitrogen compounds, in natural waters, sulphate does not undergo major transformations, and is generally quite stable. However, occurrence of sulphur-reducing bacterial species may cause conversion of sulphate to hydrogen sulphide; and presence of sufficient iron content under these reducing environments may result in iron sulphide precipitation, causing further degradation in water quality26. Use of water having appreciable amounts of sulphates can lead to formation of hard scales in heat exchangers and boilers. Under anaerobic condition, it can also cause unpleasant odour and corrosion of sewer system due to formation of hydrogen sulphide. Excessive content of sulphate in water supplies can produce disorders such as catharsis, dehydration and gastrointestinal irritation in humans. Sulphate in the range of 300-400 mg/l produces a bitter taste in water, and those with excess content may produce undesirable laxative effects45.
Phosphate
Phosphorous is predominantly present in waters and wastewater as phosphates; and is classified as orthophosphates, condensed phosphates and organic phosphates. These compounds occur either in solution, body of the organisms, particulates or detritus45. Phosphorous is an essential requirement for living organisms. However, at high concentrations it is considered as a pollutant, principally for its role in causing eutrophication. Though NO3- pollution is also responsible for eutrophication, PO43- is the major cause in fresh waters45,26. Eutrophication not only harms aquatic organisms, such as fishes, but also results in increasing the costs of water clean-up process. Ferric and calcium phosphates in rocks form the greatest reservoir of phosphates. Naturally, rainfall induced erosion and the runoff of streams cause removal of phosphorous, as weathering, from its reservoir pool. The phosphorous in the soil gets dissolved in water, and in turn flows into the aquatic ecosystems. Another source of phosphorous in surface water is its release from bed sediments. Some specific bacterial actions release phosphate from organic phosphorous compounds, chiefly formed by biological mechanisms, present in the detritus such as plant residues67. Organic phosphorous may also be formed in natural aquatic systems and during biological wastewater treatment processes. Organic phosphates from household food residues and body wastes end up in sewage26. Natural animal manures, including animal excretions, also release phosphates in water resources. Common household detergents have emerged as a modern source of phosphorous in aquatic bodies. The detergents enter wastewater systems and are then released into rivers, ponds, lakes and estuaries67. Condensed phosphates, which include pyro, meta and polyphosphate compounds, are chief ingredients of many laundry detergents, such as Sodium tripolyphosphate, and commercial cleaning products; and are also employed extensively to control scaling in boilers26. Thus, phosphorous in freshwater resources can come from both discharge of industrial wastewaters and raw or treated sewage45. The problem with modern detergents is that, in water, polyphosphates slowly change to orthophosphates (water soluble salts of phosphoric acid). Phosphates also find use in water supplies where they are added in small amounts to inhibit corrosion during treatment process26. Large scale use of phosphorous containing mineral fertilizers, such a superphosphate (a mixture of calcium dihydrogen phosphate and gypsum), in agriculture also enriches water with phosphates from surface runoff67. Concentration of total phosphorous at 0.1 mg/l is unacceptably high; and concentration of 0.02 mg/l is often a problem68.
Nitrogen Species
Nitrogen compounds are essential nutrients for living organisms as well as pollutants, with some potentially harmful side effects. Three nitrogen compounds most commonly studied in water chemistry are NO3-, NO2- and AN. In unpolluted surface water ecosystems nitrogen species are naturally produced from, mineralization of organic matter (detritus), nitrification and denitrification processes. Nitrate nitrogen pollution of surface waters is mainly due to discharge of industrial and municipal/domestic wastewaters and agricultural runoff including animal feedlots. Nitrogen pollution by high NO3- and AN can cause eutrophication in surface waters. Acidic runoff from agricultural fields treated with nitrogenous fertilizers result in acidification of nearby water ecosystems. Atmospheric depositions from industrial emissions also supply NO3- to the surface waters26. Elevated levels of AN indicate recent organic pollution predominantly of animal origin45. The chief source of AN is sewage where it is produced by the action of urease bacteria on urea. Effluents from industrial units concerned with food and metallurgy have higher concentration of NO2- due to application of NO2- salts26. In water, NO3- can be converted to NO2- via reduction, while AN can form NO2- through oxidation process. Very high levels of NO2- in waters indicate unsatisfactory microbial activity45. Of the three nitrogen species, the most toxic is NO2-. It is known for its toxicity effects on aquatic plants, biota as well as human beings. Ammonical nitrogen produces its toxic effects only if the intake exceeds the detoxification capacity69. Nitrate toxicity in water is mainly through its reduced NO2- form, which can cause development of methaemoglobinemia or ferrihaemoglobinemia (also called blue baby syndrome). Moreover, in the gastrointestinal tract NO3- can also be converted to NO2- through certain bacterial actions. Nitrite induces oxidation of Fe in normal haemoglobin, where ferrous (Fe2+) state is changed to Fe3+ferric state70,71. Nitrite reacts with two molecules of haemoglobin and generates methaemoglobin (metHb)70. The impaired haemoglobin fails to carry oxygen resulting in cyanosis as well as dark colouration of blood71. The methaemoglobinemia is said to happen when the concentration of metHb reaches 10% of the normal Hb or above. Infants are more at risk to the development of metHb than the adults72. Nitrate, on reduction to nitrite, can react with secondary amine compounds in the stomach of adults, resulting in the generation of N-nitroso compounds such as N-nitrosamines; some of which have been shown to be strong carcinogens and mutagens in many laboratory tests on animals73,26.
Dissolved Oxygen
Measurement of dissolved oxygen content is a basic part of water quality, especially surface water, assessment and monitoring programmes since oxygen plays essential role in nearly all chemical and biological processes occurring in aquatic ecosystems74. In addition to its requirement in respiration of the most aquatic animals; it also combines with elements such as carbon, nitrogen, sulphur and phosphorous to form their respective compounds like carbonate, nitrate, sulphate and phosphate required for the aquatic biota to survive75. DO content in water bodies is function of many factors, such as, ambient temperature, salinity (ionic strength), turbulence, atmospheric pressure and biological activity. Atmospheric aeration and the photosynthetic activities of algae and other aquatic plants provide DO in water bodies76. However, due to slow diffusion rate of oxygen into natural waters, except during strong turbulence conditions, photosynthetic activity is the most important source of oxygen in water bodies75. The level of DO can vary temporally over 24 hour periods and seasonally because of change in temperature; and biological actions such as respiration and photosynthesis. Due to low flow rate of river and high biological oxidation rate (because of increased temperature), the DO content is usually higher in summer as compared to other seasons. The concentration of DO is used to indicate the extent of organic matter pollution load, the degradation of organic materials and the intensity of self-purification capacity of the aquatic bodies. The survival and functioning of the biotic communities may be severely affected at concentrations below 5 mg/l, and below 2 mg/l level may result in mortality of most fish. Biological processes such as respiration and decomposition cause reduction of DO content. Presence of high load of organic matter and nutrients can cause depletion of DO level because enhanced microbial action, in the form of respiration, during the process of organic matter degradation, result in increased consumption of oxygen74. As wastes supply nutrients to microorganisms, they grow and multiply fast, and in the process also consume oxygen. Usually, these microorganisms break down wastes and act to purify surface waters, but the presence of excess polluting waste may cause complete depletion of oxygen. The rise in demand of oxygen as compared to supply can lead to death of microorganisms, decrease in purifying capacity of water, and development of anaerobic environment. Anaerobic decomposition produces obnoxious substances such as methane, sulphides and ammonia in water26. Apart from measuring biochemical oxidation, study of oxygen is also important for corrosion control of steel pipes in water distribution system and boilers45.
Biochemical Oxygen Demand and Chemical Oxygen Demand
The analysis of BOD is performed to estimate the consumption or use of oxygen (demand) in the water column by the microorganisms from the decomposition of organic waste/matter (that is carbonaceous BOD) and nitrification of ammonia (that is nitrogenous BOD) under aerobic conditions. The BOD test provides information about the controls on DO consumption in the water column; and is used to obtain decomposition rates for water quality models77. Simply, the BOD can be defined as the quantity of oxygen needed to degrade organic matter in a unit volume of water. Most aquatic systems have some natural ability to decompose organic wastes. The situation becomes problematic when the receiving water body is supplied with overload of oxygen-demanding wastes. This overpowering of the natural cleansing capability of the water body may remove entire DO with adverse consequences to the aquatic life. The self-purifying capacity of the river is lost if the BOD level is greater than 4 mg/l26. In natural waters, many biotic and abiotic processes control the composition and concentration of organic materials, such as, excretions of hydrobiota; presence of water soluble humic substances; atmospheric deposition inputs; surface runoffs; receiving of industrial effluents, and domestic/municipal and agricultural wastes. Based on five-day BOD test, the water quality can be classified as: very clean (<1 mg/l), clean (1.1–1.9 mg/l), moderately polluted (2–2.9 mg/l), polluted (3–3.9 mg/l), very polluted (4–10 mg/l) and extremely polluted (>10 mg/l)26. COD is another empirical test that is also used to measure the degree of water pollution and self-purification capacity of aquatic bodies. The COD is a non-specific test and does not differentiate between the oxidizable organic and inorganic material present in water. It is widely used to estimate the susceptibility to oxidation, in the presence of a strong chemical oxidant (such as dichromate), of both organic matter and inorganic substances of water column. In unpolluted surface waters, the concentration of COD is generally below 20 mg/l74. However, the test suffers from limitations such as it does not indicate the presence of total organic carbon; and its inability to discriminate between biologically oxidizable and inert organic materials, which make the analysis less relevant to the natural processes as compared to the BOD analysis74,45,26. Nevertheless, determination of COD has some advantages over the BOD test in that the COD analysis is rapid and result can be obtained in few hours, the method gives more reproducible results, and unlike BOD test it is not affected by interferences45.
Total Coliforms and Faecal Coliforms
The coliform organisms are used as a suitable indicator of water pollution because their presence provides evidence of faecal contamination and, therefore, high risk of occurrence of pathogenic organisms also. The number of pathogenic organisms is relatively small in waste and polluted water as compared to other kinds of microorganisms. Moreover, it is impractical to examine many different types of disease producing microorganism as each group requires a unique isolation and analytical technique. On the other hand, the coliforms are present in large numbers and are easily tested. The possible sources of coliform contamination in fresh water include discharge of municipal/domestic sewage/wastewater, open-defecation near water bodies, input of domestic or wild animal faecal matter, bathing and washing of clothes, and agricultural run-off. The standards commonly used in water microbiology are isolation and enumeration of “total coliforms” and “faecal coliforms”. The “total coliforms” group comprises a large number of aerobic and facultative anaerobic rod-shaped, Gram-negative, non-spore forming bacteria which ferment lactose and produce gas within 48 hours at 35 or 37°C temperature78,45. This group includes bacteria such as Escherichia, Klebsiella, Enterobacter and Citrobacter which inhabit intestines of humans and other warm-blooded animals. Since, Escherichia and Klebsiella essentially multiply only in intestines they are categorized as faecal coliforms; while other two bacteria can multiply in intestines as well as environmental sources, such as soil or organic matter, and are thus categorized as non-faecal coliforms45. Thus, the record of “total coliforms” would not necessarily indicate the occurrence of faecal contamination in water. The “faecal coliforms” test, which is used to differentiate between “total coliforms” and “faecal coliforms” in water quality monitoring, denotes those coliform organisms which ferment lactose and form acid and gas at 44 or 44.5°C. The term “thermotolerant coliforms” is, therefore, more suitable for these organisms and is becoming more commonly used in scientific literature78,45.
Trace Element Chemistry
Trace Elements in Surface Water
Polluted water can show the presence of several toxic elements such as lead (Pb), cadmium (Cd), mercury (Hg), arsenic (As) and antimony (Sb). These toxic elements dangerously affect public health and biological systems of the aquatic bodies. The presence of elements such as Pb, Cd and Hg in freshwater systems is particularly deemed to be undesirable. The Cd alters functioning of arterial systems of the human kidneys; and is toxic to the fish populations. The Pb is a serious cumulative body poison which can cause gastrointestinal disorders; and neuromuscular and central nervous system disorders27,28. Although elements, such as, iron (Fe), copper (Cu), manganese (Mn) and zinc (Zn) are essential; at high concentrations they can also be damaging. The Fe and Cu can directly generate reactive species leading to oxidative damage of the cellular machinery via Fenton chemistry/Haber-Weiss reaction. Excess Zn can exacerbate oxidative stress through enhanced production of reactive oxygen radicals leading to cell death due to necrosis79,80. Excess Mn in brain can also induce oxidative damage leading to neurotoxicity81,82,83,84. More details about the physiological alterations due to exposure to trace elements are given in our previous review paper on oxidative stress85. The regulatory values of elements, in this manuscript, were taken from the drinking water specifications of the Bureau of Indian standards, IS 10500:1991, edition 2.1, UDC 628.1.033, 1st revision86.
The Gomti River (Northern India) stretch in Uttar Pradesh was investigated to determine levels of Fe, Zn, Cu, Pb, Cd, Mn, Cr (chromium) and Ni (nickel) in the river water87. Most of the elements occurred below the BIS guideline values in all water samples except Fe and Cr. The concentration of Cr was above the BIS guideline value at Barabanki station. However, Fe level frequently exceeded the desirable limit at most of the sites. Though, most of the trace elements didn’t exceed their desirable limit, their presence in water, however, was not due to natural causes. Direct discharge of untreated sewage and other domestic/municipal wastes, industrial effluents and agricultural runoff from cities and villages of the basin caused their occurrence in the river water. Due to the construction of barrage on the river the free flow of water was restricted, which reduced self-purification capacity of the river.
Bhagirathi-Hooghly River (Eastern India) in West Bengal is a widely exploited freshwater resource. Water quality status of the Bhagirathi-Hooghly River to examine its suitability for drinking and irrigation purposes with respect to parameters, namely, Fe, Zn, Cu, Pb, Cd, Mn, Cr and Ni was evaluated88. Though, the level of Cu, Zn, Cr and Cd were within the regulatory safe limit for crop production as well as drinking, the concentration of Pb, Fe, Ni and Mn surpassed the BIS benchmark for drinking in 24, 79, 84 and 67% of the examined samples respectively. The quantity of Mn crossed the safe limit for agricultural activities/crop production (Fe = 5.0 mg/l; Cu = 0.2 mg/l; Pb = 5.0 mg/l; Cd = 0.01 mg/l; Mn = 0.2 mg/l) in 29% of the analyzed samples. Overall, the river water was unsuitable for drinking purpose because of excess content of Fe, Ni, Pb and Mn. The excess quantity of Mn in water also revealed its unsuitability for crop production. The pollution load of the Bhagirathi-Hooghly River due to trace elements was attributed to both anthropogenic and natural causes, such as, discharge of municipal/domestic wastes, industrial effluents, geology of the catchment area and the river bed.
Analysis of the Cauvery River (Southern India) stretch in Karnataka (Kodagu, Mandya and Mysore districts) revealed its contamination with certain trace elements, mostly in the downstream catchment89. The quantity of all studied elements, namely, Cr, Cu, Mn, Co (cobalt), Ni, Pb and Zn progressively increased from Kogadu district to Mysore district. The concentration of Cr, Cu and Pb was recorded above the desirable regulatory limits of BIS throughout the river. The final location in the Mysore district showed concentration of elements as: Cr = 0.32 mg/l, Cu = 2.23 mg/l, Mn = 1.25 mg/l, Zn = 10.70 mg/l and Pb = 9.95 mg/l, which was 6.4, 44.6, 12.5, 2.14 and 199 times respectively above their desirable limits. The distribution pattern of elements in the downstream river indicated enhanced pollution load due to entry of industrial wastewater, anthropogenic wastes, agrochemicals and agricultural ashes.
An assessment of trace elements, namely, Fe, Zn, Cu, Pb, Cd and Mn was carried out for the Hindon River (Northern India), Uttar Pradesh90. The influence of human interference with the river ecology was markedly noticed from the reported values of the elements. From different sites the concentration of elements were recorded as high as Fe = 1.229 mg/l, Zn = 0.833 mg/l, Cu = 4.390 mg/l, Pb = 0.901 mg/l, Cd = 0.024 mg/l and Mn = 0.857 mg/l. Although Zn didn’t exceed the regulatory desirable limit, the concentration of Fe, Cd and Mn were 4, 2 and 9 times their standard limits respectively. For Cu and Pb the concentration intensity was alarming and recorded 88 and 18 times the desirable limits respectively. The investigation evidently demonstrated the negative impacts of recent industrial and urban developmental works in the Hindon basin on the river water quality.
Meenachil River (Southern India) is one of the most important rivers in the Kerala state. The river water is widely exploited for human consumption. The Meenachil water quality, to determine the level of Fe, Zn, Cu, Pb, Cd and Mn in water, was evaluated91. Except Zn, all other parameters exceeded their respective desirable limits. The most distinguishable pollutants emerged were toxic elements Pb and Cd which displayed concentration ranging from 0.16-0.86 mg/l and 0.06-0.13 mg/l respectively. When compared to their standard limits, Pb and Cd showed presence as high as 17 and 13 times respectively. Meenachil River forms one of the major sources of drinking water in the Kottayam region. The results showed high pollution load of the river water and its consumption would cause some serious health hazards. The study also showed that the presence of major industrial activities was not necessary for the trace element load of the river water. The excess presence of trace elements in the Meenachil water was predominantly due to movement of domestic wastes, urban sewage and agricultural runoff in the basin.
River Brahmani (Eastern India) is a major water source for the industries located in its basin. On the other hand the river is also a sink for the industrial effluents. The industrial activities influence various biotic and abiotic ecological components of the basin and cause trace element contamination in the Brahmani water. Status of water quality of the Brahmani River and its tributaries in Odisha, with respect to the concentration of trace elements, namely, Fe, Zn, Cu, Pb, Cd, Mn, Cr, Co, Ni and Hg was assessed92. Most of the locations recorded concentration of elements within the desirable limit of the BIS. Very few water samples reported slightly significant element level in the middle catchment of the river basin. It could be attributed to the presence of various mines and allied industries in the region. The Brahmani River and its tributaries were not critically contaminated with trace elements due to rapid dilution of mine water and industrial wastewater from the sufficient flow rate of the river water. The pollution load was somewhat mitigated due to strict implementation of some efficient environmental measures by the mining and allied industries and use of some clean technologies.
Trace Elements in Bed Sediments
Sediments act as sensitive indicators to monitor toxic substances entering freshwater systems93. Investigation on sediment quality is necessary: because they can be potential sources for movement, transportation and bioavailability of toxicants, such as, trace elements Pb and Cd in the freshwater systems94,95,96; to identify the sources of contaminants due to natural lithogenic or anthropogenic causes97,89; and to understand the behaviour and transport of contaminant, such as elements, in the aquatic bodies98. Recent works emphasize the presence of trace elements in river beds due to their persistent and non-degradable properties. They are also likely to enter the operating food chain in the ecosystem. To evaluate potential impacts of human-induced developmental activities on sediment ecology of the freshwater systems, it is indispensable to regularly monitor and assess these systems for the presence of elements99.
The concentration of Fe, Zn, Cu, Pb, Cd, Mn, Cr and Ni in bed sediments of the Gomti River (Northern India) stretch in Uttar Pradesh was determined87. Except for Cd and Pb, in most of the cases, the average concentrations reported for other elements showed values lower than their shale standards (compiled by Turekian and Wedepohl)100. The percentage enrichment factor (EF%) computed for Cr, Cu, Fe, Mn, Ni and Zn in the bed sediments reported 52.45, 27.93, 37.41, 40.50, 39.12 and 39.50 values respectively; which showed substantial loading of the river sediments with these elements. The concentrations of Cd and Pb recorded 8 and 2.5 times than their shale standards respectively. The EF% for the toxic elements Cd (27.29) and Pb (43.59) indicated extreme contamination of the bed sediments. Based on the geo-accumulation index (Igeo) values, the Gomti bed sediments were categorized as unpolluted with Zn, Cr, Cu, Fe and Mn; unpolluted to moderately polluted with Pb; and moderately to highly polluted with Cd. At two locations, namely, Barabanki and Jaunpur the sediments were very highly polluted with Ni. The most important pollution sources of the river Gomti were its tributaries which carried raw effluents/wastewater from industries/towns; and direct discharge of untreated wastewater into the river from drains bringing wastes of towns such as Luchnow, Sultanpur, Jagdishpur and Jaunpur. Lucknow, a capital city in the Gomti-Gangetic basin, contributed most to the degradation of the river. Agrochemical runoff in the catchment also contributed to the trace element pollution load of the river.
The Achankovil River (Southern India) is an important water resource in the Western Ghats of Kerala. The river drains into the Vembanad Lake which forms the largest estuary in Kerala. The basin is characterized by intense agricultural and plantation activities. A study conducted on the river recorded significant concentrations of trace elements, namely, Fe, Cu, Zn, Mn, Cd and Pb in the surface and core sediments of the river98. Except Fe and Mn, all other elements exceeded their respective shale standards. Zn exceeded its shale standard by 3 to 6 times, Cu exceeded by 3 to 10 times, Pb exceeded by 2 to 5 times, and Cd exceeded by 12 to 38 times. The elements exhibited an increase in enrichment towards the downstream regions as compared to the upstream catchment due to combined actions of local lithology, soil conditions and land use patterns. Based on enrichment ratio (ER), Cu, Zn and Pb had their origin mostly from anthropogenic activities, Cd and Fe had mainly terrigenous origin, and Mn involved both terrigenous and anthropogenic factors. The toxic element Pb displayed maximum enrichment due to human interference in the region. The study also demonstrated long time enrichment of Pb was happening in the sediments than that of Fe, Mn and Cu. The core sediments exhibited increase of elements in the upper strata as compared to the lower strata. This highlighted the onset of change in land use patterns due to intensive agricultural practices in the region and consequently increased pollution load in the Achankovil basin.
An assessment of level of trace elements, namely, Fe, Zn Cu, Pb, Cd, Mn and Cr in the River Hindon (Northern India), Uttar Pradesh, was carried out90. The concentration of Fe, Zn and Mn were below their average shale standard values; while level of Cu, Pb and Cd exceeded their shale standards as high as 4, 3 and 11 times respectively. Based on Igeo values Zn, Mn and Pb displayed unpolluted to moderate pollution; Cr, Cu and Fe displayed moderate pollution; and Cd displayed very strong pollution in bed sediment of the river. The toxic element Cd emerged as the major pollutant of the Hindon; which had its origin mostly from battery, paint, electroplating and metal processing industries. Industrial units in the Hindon catchment and its two principal tributaries, which are Kali and Krishni Rivers, contributed most to the element pollution load in the bed sediments. In the Ghaziabad region, the River Hindon and its tributaries acted as the end points of a number of industrial and urban wastewater drains. In addition to industrialization, rapid urbanization in the Ghaziabad region posed major threat to the ecology of the River Hindon. Moreover, disposal of wastewater and dumping of garbage by the urban localities of the Eastern Delhi national capital territory into the Hindon branch also increased its pollution load to some extent.
The Cauvery River (Southern India) forms the principal drainage basin in the Kodagu district, Karnataka. Sediment chemistry of the Cauvery River stretch in Karnataka (Kodagu, Mandya and Mysore districts) with respect to trace elements Cr, Cu, Mn, Co, Ni, Pb and Zn was analyzed89. The investigation revealed river bed contamination with certain trace elements, mostly in the downstream catchment. The contents of all studied elements progressively increased from Kogadu district to Mysore district. Except Zn and Pb, other elements had their concentrations lower than their shale standards. The Zn content in the river bed, which always displayed concentration above its shale standard, progressively increased from 120.50, 145.59, 156.47, 190.62, 263.51 and 467.30 mg/kg. The Pb displayed progressive increase as 59.30, 102.43, 167.94, 185.51, 199.50, 230.67 and 450.52 mg/kg, which was always more than its shale standard. The Zn and Pb had their concentrations as high as 5 times and 23 times than their respective shale standards. Excessive discharge of industrial effluents, agrochemicals (such as fertilizers), agricultural ashes, domestic and municipal wastes into the river, mostly in the downstream catchment, had caused the accumulation of elements in the bed sediments.
The Dikrong River, flowing through the North-Eastern part of the India, is a tributary of the Subansiri River flanking the north bank of the Brahmaputra River. Geochemical study of the Dikrong River sediments to evaluate the level of some trace elements, namely, Fe, Zn, Cu, Pb, Mn, Al (aluminium), Ti (titanium), Cr and Ni was conducted101. Except Cu and Pb, all other elements exhibited presence lower than their respective background values. The background values used in this study were taken from the world surface rock average values of the elements102,103. The Cu and Pb exceeded their respective background values by 6 and 2 times respectively. The Cu also showed very high ER (>10) indicating significant enrichment of the element in the river bed. The ER of Pb displayed its moderate enrichment in the sediments. The significant Igeo values were also recorded only for Cu and Pb. In the absence of any major industrial activities in the basin, the origin of these elements in the river was predominantly from the lithogenic influx, more importantly from the upper catchment, and to some extent from the discharge of domestic wastes. The pollution load index (PLI) determined for the basin also demonstrated no appreciable anthropogenic input of elements into the River Dikrong.
The Vembanad wetland system forms the largest estuarine ecosystem in the Southern Indian state Kerala. The wetland has a freshwater zone (upstream) and a saltwater zone (downstream), which are separated by a bund. The agricultural lands in the upstream part of wetland are highly fertile. Geochemical and toxicological assessment of the Vembanad wetland sediment cores with reference to elements such as Fe, Zn, Cu, Pb, Cd, Mn, Ni, Cr and Hg was performed to determine environmental quality of the region93. The concentration of Fe, Zn, Pb and Cd exceeded their respective average shale standard at most of the locations. An increasing trend in enrichment was obtained for Fe, Cu, Ni and Zn from bottom to the surface part of the sediment core, indicating increased anthropogenic activities in the region with time. Based on TEC (threshold effect concentration) and PEC (probable effect concentration) limits104 it was noticed that Zn and Ni posed ecological risks throughout the wetland region, which were also expected from Cu and Pb at some locations. When compared to the USEPA’s (United States Environmental Protection Agency) SQGs (sediment quality guidelines)105 most of the sampling sites displayed moderate to heavy pollution load for Zn and Ni. Based on ERL (effective range low)/TEL (threshold effect level) and ERM (effective range median)/PEL (probable effect level) SQGs106, Zn, Ni and to some extent Cu displayed potential eco-toxicity in the wetland ecosystem in the long term. The toxic units developed for the wetland to estimate potential acute toxicity due to presence of elements showed middle part of the wetland and further downstream region of the freshwater zone to be more polluted than the upstream region. The PLI values also exhibited more sediment quality deterioration in the middle (1.30) and downstream freshwater regions (1.47). Transfer of pollutants from the Cochin industrial area and urban effluents to the freshwater zone of the Vembanad wetland increased its water and sediment quality deterioration. The construction of bund between the freshwater and saltwater zones to prevent the invasion of saline water in the adjoining paddy fields resulted in increased accumulation of trace elements in the freshwater sediment environment.
The urban lakes are increasingly becoming fragile due to deposition of industrial and residential wastes. These lakes are important surface water ecosystems which support the surrounding biotic environment and also act as sanctuary for the migratory birds. Degree and extent of enrichment of some trace elements, namely, Zn, Cu, Pb, Cd, Mn, Cr and Ni in the bed sediments of the Bangalore city lakes was investigated107. The SQGs proposed by many international authorities regarding sediment toxicity limits were used to evaluate the degree of element enrichment and eco-toxicological responses to the aquatic biota. The average concentrations of Cd (8.38 mg/kg) and Pb (206 mg/kg) failed FDEP (Florida Department of Environmental Protection) and CCME (Canadian Council of Ministers of the Environment) SQGs108,109 while Cr (96.7 mg/kg) exceeded only CCME toxicity limit. The average concentration of Zn (220.9 mg/kg) exhibited presence within all studied sediment guideline goals; and Mn (176 mg/kg) was well within OMEE (Ontario Ministry of Environment and Energy) SLGs (screening level guidelines)110. The Cu and Ni emerged as most severe pollutants of the lake ecosystems. While Cu (203.5 mg/kg) failed all SQGs except NOAA (National Oceanographic and Atmospheric Administration) guideline111; the average Ni (97.64 mg/kg) was much above the SLG and NOAA limits. The Igeo of Cu and Ni also showed their considerable enrichment in lake beds. The PLI indicated progressive deterioration of some Bangalore lake systems. Nearly 1600 acres of the Bangalore city land are under industrial activities. The urban lakes are sometimes very close to the industrial sites and their drainage channels. Seepage and movement of hazardous industrial effluents into the wetlands caused increased enrichment of elements in the lake bed sediments of the Bangalore city.
The Kottuli wetland, lying in the coastal city Calicut, Kerala, India, carries national significance and is a part of the National Wetland Conservation Programme. The wetland is rich in aquatic biota. Human interference with the ecology of the Kottuli wetland system has led to its degradation and undesirable loss of biodiversity. The extent of some trace elements, such as, Zn, Cu, Pb, Cd, Mn, Ni and Cr in the bed sediments of the Kottuli wetland system was investigated112. In the downstream region the concentration of elements Cu (56-243.6 mg/kg) and Zn (218.65-456.3 mg/kg) recorded above their respective average shale background and continental crust values113. The content of Pb was also reported higher than its shale standard and continental crust standard at 23.62 mg/kg. The presence of these elements in the Kottuli wetland were predominantly due to urban and industrial wastewater, atmospheric deposition of emitted particles, urban runoff water and wide use of gasoline. The comparison of the wetland sediment chemistry with the effect based eco-toxicological reference values such as USEPA toxicity reference values114, USDoE (United States Department of Energy) TEC115, OMEE LEL (lowest effect level) revealed severe pollution load of the bed sediment. The elements also exhibited accumulation above the USDoE HNEC (high no effect concentration) and PEC; and SEL (severe effect level) delineated by the OMEE110. Thus, the occurrence of elements at the present level would cause severe negative impacts on the wetland ecosystem. The wetland displayed considerably high ERs for Pb, Zn and Cu indicating significant contamination of the aquatic ecosystem with these elements. Similar problematic trend was obtained from Igeo calculations. The average PLI obtained for the Kottuli wetland was 10, which established severe degradation of the wetland sediments.
Trace elements that have mostly been studied in the surface waters and bed sediments are Fe, Zn, Cu, Pb, Cd and Mn. In addition to these elements, Ni and Cr are also evaluated in water and sediment environment. ER, PLI and Igeo techniques have been utilized for quantitative estimation of contamination of bed sediments; and also to assign natural or man-made cause for the deterioration of sediment chemistry. The SQGs, namely, (ERL)/(TEL) and (ERM)/(PEL); TEC and PEC; SLG of the Ontario Environmental Ministry (Canada) on low and severe toxicity levels; NOAA SQGs showing ERL and ERM limits; TEL and PEL of the FDEP; CCME interim Canadian SQGs having interim sediment quality goals and PEL have been employed to investigate sediment eco-toxicity responses. Additionally, Government of Netherland’s sediment quality objectives showing target values and maximum permissible concentration (not discussed in the present text) have also been employed to study sediment quality. A summary of estimated values of trace elements (Fe, Zn, Cu, Pb, Cd and Mn) in some surface water bodies and bed sediments is displayed in Table 7 and Table 8 respectively.
Table7: Trace Elements in Water of Some Freshwater Bodies
|
Water body |
Range |
Fe |
Zn |
Cu |
Pb |
Cd |
Mn
|
|
Gomti River (mg/l) |
Min Max |
0.0791 0.3190 |
0.0144 0.0298 |
0.0013 0.0043 |
0.0158 0.0276 |
0.0001 0.0005 |
0.0038 0.0973 |
|
Bhagirathi-Hooghly River (mg/l) |
Min Max |
0.586 1.485 |
0.055 0.085 |
0.004 0.006 |
0.008 0.024 |
0.001 0.002 |
0.023 0.420 |
|
Cauvery River (mg/l) |
Min Max |
— |
1.23 10.70 |
0.03 1.12 |
0.08 9.95 |
— |
0.06 1.25 |
|
Hindon River (µg/l) |
Min Max |
0.001 1229.2 |
0.502 833.2 |
0.00067 4390.2 |
30.3 901.3 |
2.45 24.0 |
1.78 857.9 |
|
Meenachil River (mg/l) |
Min Max |
0.30 2.53 |
0.15 0.17 |
0.03 0.35 |
0.16 0.86 |
0.06 0.13 |
0.09 2.83 |
|
Brahmani River and its four tributaries (µg/l)
|
Min Max |
20.32 23.33 |
15.9 11.31 |
1.94 1.55 |
12.1 10.0 |
1.8 0.43 |
24.55 24.13 |
Min = minimum value; Max = maximum value
Table8: Trace Elements in Bed Sediments of Some Freshwater Bodies
|
Sediment body |
Range |
Fe |
Zn |
Cu |
Pb |
Cd |
Mn
|
|
#Dikrong River (mg/kg) |
Min Max |
1.63 (%) 1.98 (%) |
19.00 33.00 |
182.00 194.50 |
31.00 47.00 |
‒— |
441.00 642.00 |
|
Hindon River (mg/kg) |
Min Max |
221.80 237.00 |
4.11 84.70 |
35.60 194.70 |
5.17 59.00 |
1.30 3.28 |
61.30 201.00 |
|
Lake systems of Bangalore (mg/kg) |
Min Max |
‒— |
19.60 1118.25 |
74.90 882.20 |
36.58 2266.30 |
4.68 14.25 |
60.00 534.50 |
|
Kottuli wetland (mg/kg) |
Min Max |
‒— |
218.65 554.23 |
0.80 243.60 |
2.31 23.62 |
ND 0.08 |
6.43 29.47 |
|
Gomti River (mg/kg) |
Min Max |
5051.48 8291.48 |
15.72 99.35 |
3.74 35.68 |
21.25 92.15 |
0.70 7.90 |
134.91 320.45 |
|
Achankovil River (mg/kg) |
Min Max |
9760.00 14516.00 |
273.00 554.00 |
140.00 458.00 |
35.00 109.00 |
3.67 11.43 |
522.00 885.00 |
|
Vembanad wetland (mg/kg) |
Min Max |
45880.00 67510.00 |
136.55 211.39 |
24.08 49.43 |
15.65 54.42 |
0.26 0.73 |
310.09 860.97 |
|
Cauvery River (mg/kg)
|
Min Max |
‒— |
120.50 467.30 |
4.55 29.87 |
59.30 450.52 |
‒— |
105.23 278.27 |
# Fe in %; Min = minimum value; Max = maximum value; ND = not detected
Iron
Iron is the fourth most abundant element and the second most abundant metal in the earth’s crust116. Iron in its ionic forms Fe2+ and Fe3+ readily combine with compounds of oxygen and sulphur to form new compounds, such as, oxides, hydroxides, carbonates and sulphides117. Iron occurs as insoluble ferric oxide and iron sulphide, and relatively soluble ferrous carbonate in soils and minerals. Chemical weathering of geological materials is the major source of Fe in natural waters. Weathering causes transformation of solid Fe-compounds to soluble and/or colloidal species26. Anthropogenic sources of Fe in water include industrial wastewaters from units, such as, iron smelting, textiles, pigments/paints and agriculture26. Iron oxides are applied as pigments in paints and plastics. Many Fe salts are also employed as coagulants in water treatment117.Water with Fe>2 mg/l has bitter astringent taste45. At concentrations above 0.3 mg/l staining of laundry and plumbing may occur117. Iron also promotes growth of undesirable “iron bacteria” such as Frenothrix, Galionella and Laptothrix within water distribution system and waterworks. This causes deposition of slimy bacterial coatings on the piping system which can produce taste and odour problems in water117,45. Precipitation of Fe(II) salts as insoluble Fe(III) hydroxide produces rust-coloured silt in water supplies117. Iron is an essential ingredient for the proper functioning of many physiological processes such as haemoglobin, myoglobin and cytochrome synthesis, and production of blood cells. At excess levels it adversely affects the physiological functions, for example, occurrence of haemochromatosis which often leads to fibrosis118. Excess deposition of Fe in body may also lead to the development of cardiovascular diseases such as artherosclerosis and ischemic heart diseases55.
Zinc
Zinc, an essential metal, is a functional component of many metabolic processes; maintains a healthy immune system; and plays essential role in normal body growth and development. Zn-dependent transcription factors and Zn-metalloenzymes are essential substances for many physiological functions55. At higher concentrations, however, it may be toxic85. The sources of environmental Zn include mining of Zn ores, and wastes from industries manufacturing products such as corrosion-resistant alloys, and galvanized iron and steel products119,26. Zinc oxide, used as a white pigment in rubber, for example, is the most common industrial Zn compound119,107. Tire wear is a major source of Zn input in the environment. The other two major commercial Zn compounds are zinc chloride used in dry cells, to vulcanize rubber and as disinfectant; and zinc sulphide used to manufacture Zn-containing insecticides, for example zineb, and in Zn-electroplating120. Other sources of Zn include fertilizers and pesticides (as zinc carbamates, for example), batteries, printing processes, building materials, sewage wastewater, animal wastes and manure, coal combustion and atmospheric depositions26. De-zincification of brass and deterioration of galvanized iron/steel also supply Zn in water supplies45.The presence of Zn at levels above 3 mg/l makes drinking water opalescent and produces an undesirable astringent taste119. Exposure to Zn, in long term, can deplete dietary Cu absorption which may lead to early Cu deficiency symptoms like decrease in number of red cells55. One of the major consequences of chronic Zn ingestion is the manifestation of Cu deficiency119. Excess Zn can cause toxicity of pancreatic exocrine cells, and may also trigger neuronal death55.
Copper
Copper is one of the essential metals to sustain healthy development of the living organisms because many physiological processes depend on its presence. However, exposure to higher concentrations produces many toxic effects in the biota120,73,118. It is stable in its metallic state and forms cuprous (+1) and cupric (+2) cations121. Industrial waste, mining and metal plating are common sources of Cu in natural waters120. The Cu is extensively used commercially because of its versatile nature. It is used in electrical wire, tubing, copper pipe, gaskets and shims120. Other applications include valves, coins, fittings, building materials, cooking utensils, alloys of brass and bronze and coatings121. It is employed in plumbing, roofing, and in chemical industry, for examples, as paints and pigments, and azo dye manufacture121,26,107. Copper salts are applied in water supply systems for oxidation of Mn, and also for biological growth control in reservoirs and distribution pipes45. Copper compounds also find use in fungicides, insecticides, algicides, wood preservatives, electroplating, lithography, pyrotechnics, engraving, petroleum refining. Copper compounds are added to animal feeds as a nutrient to support animal growth and fertilizers to support plant growth. The compounds are also used as food additives, for examples, as a nutrient and colouring agent121,107. Long term exposure to high level of Cu can give rise to several disorders such as irritation in eyes, nose and mouth; dizziness, stomach-ache, vomiting and diarrhoea. In severe cases liver and kidney damage may occur118. At concentrations in excess of about 3 mg/l Cu can cause gastrointestinal irritation in some individuals73.
Lead
Inorganic lead occurs in water in its +2 oxidation state as carbonates and hydroxides. Major anthropogenic inputs of Pb in water include industries, mining and smelting plants. It also enters water from sewage sludge. It is used in the production of Pb-acid batteries, rust inhibitors, plastic stabilizers, solder, alloys, pigments, pesticides, cable sheathing, ammunition, glazes, water pipes, print typeface and building materials26,107,122. Mild Pb poisoning can cause anaemia, headaches, sore muscles, fatigue and irritability. Acute Pb poisoning produces severe dysfunctions in kidneys, liver, reproductive system and central nervous system120. It interferes with haeme synthesis, inhibits haematopoiesis, and produces adverse affects on blood vessels55,118. Pb can also cause osteoporosis by replacing Ca in bones55. The role of Pb in causing mental retardation is documented in many literatures120,73,123.
Cadmium
In river water, cadmium in +2 oxidation state is mostly present as CdCO3 species123. In recent decades there is an increase in production and use of Cd and its compounds. Cadmium enters river water from numerous sources, such as, industrial discharges, mining wastes, and atmospheric deposition due to combustion of fossil fuels and release of Cd124,120. Another source is washout from agricultural land because some fertilizers contain Cd level even up to 40 mg/kg124. One of the major sources of diffuse Cd pollution is the production of inorganic fertilizers from phosphate ores107,125. The major environmental Cd sources are Zn and Pb ores as it occurs naturally in their sulphide ores. Commercially it is produced as a by-product of Pb and Zn smelting process55,125. Raw Zn, Zn alloys and Zn compounds may have high concentrations of Cd, so that it may enter the river environment even from solid wastes, in addition to mining residues and wastewater discharges124. The Cd metal is used mainly in the plating of steel, Fe, Cu, brass and other alloys as an anticorrosive agent. Other uses include electric batteries, solders and electronic parts; and galvanized iron123,125. Cadmium sulphide and selenide are used as pigments in plastics and paints107,125. The Cd is also used in making of rubber and pesticides. Special uses include semi-conductors, aircraft manufacture and in nuclear reactors123. In sewage treatment plants the presence of Cd in wastewater is a matter of great concern because sewage sludge contaminated with Cd becomes unfit for use in fertilizing soils26. The sites of greatest Cd accumulation in the body are vital organs like liver and kidney. After gastrointestinal absorption, Cd is concentrated in kidney. Cadmium poisoning causes nephrotoxicity (kidney damage). Other toxicities of Cd exposure include decrease in haemoglobin concentration and destruction of erythrocytes; increase in blood pressure; liver damage; and sterility among males123,26.
Manganese
Manganese, one of the most abundant elements in the earth’s crust and a component of over 100 minerals, is an essential nutrient for both humans and animals. Manganese is essential for the functioning of many cellular and metabolic activities because it is a functional component of many metalloenzymes, such as Mn-superoxide dismutase and pyruvate caroxylase, and acts as a cofactor for many enzymatic reactions126,26. In the cell, it may be converted to more reactive and toxic trivalent form from the most prevalent divalent (+2) form55. Manganese naturally occurs in many surface waters. However, recently, human interference is increasingly responsible for causing Mn contamination in natural waters. Environmental Mn may result from manganese dioxide mines and smelters; industrial units manufacturing iron and steel alloys, and Mn-containing compounds. Manganese dioxide and other compounds of Mn are used to manufacture products such as batteries, fireworks, and glass. Industrial production of potassium permanganate and its use as an oxidant in disinfection, bleaching and cleaning activities may also cause Mn presence in water. Production and use of Mn compounds such as fungicides, fertilizers, varnish and as livestock feeding supplements may lead to environmental Mn presence. Environmental Mn may also be due to application of Mn greensands for potable water treatment; and production and use of Mn-organic compound Methylcyclopentadienyl Manganese Tricarbonyl (MMT), an octane enhancing agent in unleaded gasoline127,126,55,107. Many countries have set Mn concentration of 0.05 mg/l, above which discolouration problem may occur. At concentrations above 0.1 mg/l, the Mn ions stain laundry and impart unpleasant taste to beverages126. Although, Mn is an essential nutrient at low dose, overexposure to high doses may cause harmful effects. Chronic exposure to Mn may cause disabling syndrome of neurological effects called “manganism” 127.The reports, however, of health effects of Mn exposure via oral route is rather inconclusive127,126.
Nickel
Naturally nickel can exist in various oxidation states, such as, +1, +2, +3, and +4. However, under environmental conditions, the most prevalent oxidation state is the +2 valence state. Ni is released in the environment from both natural sources and human-induced activities. Natural sources include weathering of rocks and soils. Ni is an essential constituent of almost 100 minerals. Nickel and its compounds are widely used for industrial and commercial purposes. Nickel and its alloys find wide applications, especially as pigments and catalysts, in the chemical (for example, Ni-Cd batteries), metallurgical (for example, electroplating) and food processing industries128. Nickel is mostly used for the production of stainless steel and other high temperature and corrosion resistance non-ferrous alloys and super alloys129. Ni salts of chloride, sulphate, acetate, carbonate, nitrate, hydroxide and oxide are of greatest commercial importance. Nickel also enters water bodies due to atmospheric depositions from combustion of coal, fuel oil and diesel oil. Other sources of Ni in aquatic ecosystems include domestic wastewater effluents and non-ferrous metal smelters123,128. Although Ni is essential for some important physiological functions in organisms, at high exposure it may be toxic to the living beings. Drinking water and food are the most important sources of Ni in the human body. As per the WHO guideline, 70 µg/l is the value of Ni in drinking water129. The gastrointestinal route, however, is of lesser importance due to limited capacity of the intestine to absorb it. Exposure of skin, particularly in sensitized individuals, to water contaminated with Ni and its compounds may lead to a dermatitis condition known as ‘nickel itch’. Some of the immediate symptoms of the itch are headache, dizziness, nausea, vomiting, weakness and epigastric pain. Secondary symptoms, which include chest constriction, develop after a latent period of 1-5 days123,118.
Chromium
Three chromium forms, namely, Cr(0), Cr(III) and Cr(VI) are commercially used and occur in the environment. The availability of Cr to living organisms as well as its toxicity strongly depends on Cr species130,131. Whereas Cr(III) is considered necessary for the maintenance of metabolism of glucose, lipid and protein, Cr(VI) is reported to be toxic and also carcinogenic, due to its oxidizing potential and easy transport across biological membranes130,132. Of the three Cr species, Cr(VI) is most mobile in the environment133. Environmental presence of various Cr forms results from its numerous applications in alloy manufacturing; chrome plating; chemical industry, manufacture of pigments, paints and catalysts, fungicides, preservation of woods; leather tanning; ceramic and glass industry and many other products131,133. Stainless steel accounts for 20% of Cr by weight. The drinking water can also contain Cr(VI) due to oxidation of naturally occurring Cr(III) by oxides of Mn(III/IV). Level of chromium in surface waters increase due to leaching and improper dumping of chromite ores133.Water contamination with hexavalent Cr has become widespread, making its presence a matter of significant public health importance132. The tentative guideline value of 0.05 mg/l in drinking water of Cr(VI) has been proposed by the WHO131.
Significant Outcomes and Future Directions
The river basins in India are showing signs of changing water chemistry with respect to increase in salinity. Higher chloride level (203.2-1312.1 mg/l) was reported from the River Hindon37 due to mixing of urban wastewater and industrial effluents with the river water. Increase in NaCl content in Cauvery River streams due to inefficient treatment of industrial effluents has also been documented34. Nag River water was found high in salinity due to sewage discharge7. Sewage discharge and industrial wastes were responsible for increase in levels of Na+ (512-1040 mg/l) and Cl- (1118-2594 mg/l) in the Palar River134. Recently, the Yamuna River water reported substantially higher concentration of Cl- (180-218 mg/l) and much elevated levels of Na+ (404.9-524 mg/l)41. With respect to trace elements, cadmium contamination of bed sediments of the rivers from human-induced developmental activities is increasingly becoming a major problem99. This situation is predominantly seen in Gomti River87; Achankovil River98; and Hindon River90. Cadmium contamination is also reported for the wetland systems, for example, Bangalore urban lakes107and Vembanad wetland system in Kerala93. With increasing urbanization, storm runoffs from urban areas are also emerging as an important non-point pollution source.
Traditionally, the river water pollution, in Indian scenario, is described from three dimensions, namely, agricultural runoff, industrial effluents and domestic/municipal sewage28. Previously un-investigated activities, such as, impact assessment of quarrying of minor minerals from river bed on river environment should also be studied. Discharge of mine drainage into the river water and possible ecological impacts should be intensely looked into. Studies on speciation and bioavailability studies of trace elements are very few from India. In geochemical studies various background standards are used, such as, shale standard and world surface rock average. There is a need to build consensus on the use of background standard because same measured concentration when used against different standards will produce different results in geochemical indices.
Overview of Waste Production and its Treatment in India
The cities and towns in urban India, with municipal bodies reporting, generate about 47 million tonnes of garbage (solid waste) every year or about 1.3 lakh tonnes of solid waste every day. Moreover, about 30% of population of urban India lives outside these cities. Thus, the total amount of garbage generated by urban India every year adds to about 68 million tonnes. Nearly, 30% of the garbage generated is not collected at all and is left to rot in streets of urban India. The solid waste which is collected (70%) is dumped in landfills or any available space outside the major habitations of cities. In Monsoons, the problem worsens and wastes pile up135. Urban runoffs result in transfer of garbage into nearby water bodies. Of the collected solid waste only about 18% is treated to recycle or to produce fuel. The amount of sewage (wastewater) generated very day by 498 tier-1 cities (as per 2009 estimates) is about 38 billion litres. Installed capacity to treat the wastewater is around 12 billion litres, which is alarmingly less than one-third of the total requirement of wastewater treatment plants. Thus, about 26 billion litres of sewage is dumped into rivers and other streams on daily basis135. According to a recent report by the CAG (Comptroller and Auditor General) of India, sewage and industrial waste discharge constitute the main polluting sources of aquatic systems in India; and of all wastewater generated, only about 10% is treated before being discharged into the water bodies136.
Sources of Pollutants in Water
Out of total water withdrawn in India, 89% is consumed by the agricultural sector while the domestic (9%) and industrial (2%) sectors together consume 11%. However, domestic and industrial sectors are overwhelmingly responsible for the water pollution menace. From the discussion mentioned in above paragraphs it is clear that the anthropogenic activities have become dominant on the natural causes for increase of pollutants in the water environment, which in short can be described as: defective mining process; discharge of industrial wastewater/effluents rich in ionic solutions; unchecked littering, dumping of solid wastes/garbage including religious wastes and the consequent leaching of salts in river water; idol immersions; storm water run-off (particularly in monsoon season); discharge of untreated/partially treated urban domestic and municipal sewage into rivers; rural domestic wastewater; application of metal-based biocides and fertilizers in agricultural practices (agricultural wastes) 118; discharge of animal wastes; washing of vehicles, dhobi ghats29; industrial emissions and the settling of emitted particles.
Pollution Reduction Alternatives
Water pollution is a gigantic problem which needs an integrated approach to deal with. A brief account of some strategies to prevent and control water pollution is provided in Figure 1. It is observed that to treat industrial and urban wastes, treatment plants are built but poorly maintained. Theses treatment plants eventually become moribund and shut down. With increasing industrial and urban growth the untreated wastes are discharged as such into the rivers. With ‘Make-in-India’ campaign recently launched to boost domestic manufacturing, the environmental concerns increase linearly. The ‘Zero Defect-Zero Effect’ agenda is possible only through institutional reforms. Infrastructure for the waste treatment is urgently needed, and, equally essential is their maintenance. Public Private Partnership (PPP) model could be applied to set-up and maintain the working of treatment plants.
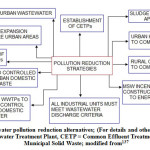 |
Figure1: River water pollution reduction alternatives; (For details and other options see text); WWTP = Wastewater Treatment Plant, CETP = Common Effluent Treatment Plant, MSW = Municipal Solid Waste; modified from137 Click here to View figure |
Municipal waste power is not subsidized unlike power generation from renewable resources such as wind energy and sun. The waste to power technique needs policy intervention and incentives. The use of municipal compost and fertilizers also needs policy intervention. The N-P-K chemical fertilizers are highly subsidized which makes the use of municipal compost costlier and unattractive135. Another water quality management scenario is reclamation of wastewater through strategies like wastewater aquaculture138. The polluter unit must be forced to invest in a clean-up activity in a stipulated time. For this, a wastewater quality index should first be instituted to ensure the severity of punitive measures.
There is a need to formulate a new green regime which could serve the country’s twin objectives of economic growth and environment protection. Some measures which could be initiated include re-categorization of industries based on water (and also air) pollution potential, strengthening norms for wastewater recycle by industries to reduce dependency on potable water, and strictly regulated management of solid wastes, especially hazardous, such as medical, plastic and e-waste. For re-categorization of industries it is proposed to categorize various industries into a three-coloured framework, namely, red, orange, and green in descending order of severity of pollution, based on their water (and air) pollution potential and nature of generation of wastes. Delineation of eco-sensitive zones should be competed immediately and red category industries should not be allowed in these areas. Red category industrial units should also be exempted in urban and protected areas. The individual units coming under various sectors should be allowed to earn ‘stars’ for compliance with environmental norms139.
Conclusion
Traditionally, in Indian scenario, the river water pollution is defined in terms of three activities, namely, agricultural runoff, industrial effluents and domestic/municipal sewage discharge. With increase in urbanization, solid wastes, especially hazardous wastes are also entering the river water. The water quality of the Indian rivers has deteriorated over the years. Salinity problem and cadmium contamination of the river environment may lead to severe ecological imbalance in the aquatic ecosystem. Sewage and industrial effluents constitute mostly to the degradation of the river environment because, of all wastewater generated in India only about 10% is treated and the rest is discharged as such into the water bodies. Of the collected solid waste only about 18% is treated to recycle or to produce fuel. With ‘Make-in-India’ campaign recently launched to boost domestic manufacturing, the environmental concerns increase linearly. The ‘Zero Defect-Zero Effect’ agenda is possible only through institutional reforms. The impending project on the linking of rivers makes for continuous monitoring and assessment of the river environment.
Acknowledgments
Junior and senior research fellowships provided by the Council of Scientific and Industrial Research (CSIR), India, to the main author Mr. Kumar Manoj, is greatly acknowledged. The authors also thank Mr. K.B. Jha, Senior Teacher, Kendriya Vidyalaya Panagarh, Durgapur, West Bengal, India, for his valuable inputs during the course of this review work.
References
- Singh V. P., Journal of Hydrologic Engineering, 13(3), 118-123 (2008).
- Lal R., Soil Quality and Ethics: The Human Dimension, In: Food Security and Soil Quality, CRC Press, Boca Raton, 301-308 (2010).
- O’Flaherty W. D., The Rig Veda: An Anthology, Penguin Books Limited, London, (2000).
- Jha P. K., Economic Reformation or Deformation in India, In: Post-Reform Leading Issues of Indian Economy 2 vols. Set, Atlantic Publishers and Distributors, New Delhi, 8-17 (2002).
- The Asian Tribune., Judge Weeramantry Focuses on Hindu Contribution to Environment Protection, http:/www.asiantribune.com/index.php?q=node/6083, Accessed on 22.02.2011, (2007).
- Lessem R., Schieffer A., Tong J. T. and Rima S.D., Integral Dynamics: Political Economy, Cultural Dynamics and the Future of the University, Gower Publishing Limited, Surrey, (2013).
- Khadse G. K., Patni P. M., Kelkar P. S. and Devotta, S., Environmental Monitoring and Assessment, 147, 83-92 (2008).
- Bhardwaj V., Singh D. S. and Singh A. K., Journal of Earth System Science, 119, 117-127 (2010).
- Rita N. K., Solanki R. and Nirmal K. J. I., Electronic Journal of Environmental, Agricultural and Food Chemistry, 10(5), 2248-2261 (2011).
- Shraddha S., Rakesh V., Savita D. and Praveen J., Research Journal of Chemical Sciences, 1(3), 40-48 (2011).
- Srivastava A. and Srivastava S., International Journal of Environmental Sciences, 2, 325-336 (2011).
- The Times of India., All Rivers can be Linked in 10 Years: Uma, Bennett Coleman and Company Limited, Ahmedabad, (2014a).
- Subramanian V., Asian Journal of Water, Environment and Pollution, 1(1), 41-54 (2004).
- Manoj K. and Padhy P. K., International Research Journal of Environment Sciences,2(1), 79-87 (2013).
- Mall R. K., Gupta A., Singh R., Singh R. S. and Rathore L. S., Current Science, 90(12), 1610-1626 (2006).
- WaterAid., Drinking Water Quality in Rural India: Issues and Approaches, http://www.wateraid.org/documents/plugin_documents/drinking_water.pdf, Accessed on 05.04.2010, (2008).
- Bhardwaj R. M. Water Quality Monitoring in India-Achievements and Constraints, IWG Env, International Work Session on Water Statistics, Vienna, (2005).
- Smakhtin V. and Anputhas M., An Assessment of Environmental Flow Requirements of Indian River Basins, International Water Management Institute, Colombo, (2006).
- Dasmohapatra G., Environmental Pollution and Control, Vikas Publishing House Private Limited, Noida, (2011).
- UNCED., United Nations Conference on Environment & Development, Protection of The Quality and Supply of Freshwater Resources, Agenda 21, (1992).
- Singh B. S., Ranveer K. and Singh M. P., Water Pollution and Environment, Enkay Publishing House, New Delhi, (2012).
- Ranveer K., Singh B. S. and Singh M. P. Pollution Control and Environment, Enkay Publishing House, New Delhi, (2012).
- Iscen C. F., Emiroglu Ö., Ilhan S., Arslan N., Yilmaz V. and Ahiska S., Environmental Monitoring and Assessment, 144, 269-276 (2008).
- Hegde N., Water Scarcity and Security in India: A Presentation by Narayan Hegde, BAIF at the Indian Science Congress 2012, http://www.indiawaterportal.org/node/23240, Accessed on 06.12.2012, (2012).
- Kole R. K., Quality Evaluation of Surface Water Resources with Special Reference to the River Ganga in West Bengal, In: Winter School on Advanced Strategies for the Mitigation of Heavy Metals and Arsenic Pollution in Agricultural Production Systems, Bidhan Chandra Krishi Visvavidyalaya, West Bengal, 248-264 (2005).
- Radojević M. and Bashkin V. N., Practical Environmental Analysis, Royal Society of Chemistry, Cambridge, (2006).
- Sharma P. D., Ecology and Environment, Rastogi Publications, Meerut, (2009).
- De A. K., Water Pollution, In: Environmental Chemistry, New Age International Private Limited, New Delhi, 195-276 (2010).
- The Times of India., Gangajal Time for Sabarmati, Bennett Coleman and Company Limited, Ahmedabad, (2014b).
- Bureau of Indian Standards., Indian Standard Drinking Water Specification (second revision of IS: 10500), Manak Bhawan, Government of India, (2004).
- Central Pollution Control Board., Use Based Classification of Surface Waters in India, In: Guidelines for Water Quality Management, Ministry of Environment and Forests, Government of India, (2008).
- Singh K. P., Malik A. and Sinha S., Analytical Chimica Acta, 538, 355-374 (2005a).
- Bhutiani R. and Khanna D. R., Environmental Monitoring and Assessment, 125, 183-195 (2007).
- Begum A. and Harikrishna., E-Journal of Chemistry, 5(2), 377-384 (2008).
- Saksena D. N., Garg R. K. and Rao R. J., Journal of Environmental Biology, 29(5),701-710 (2008).
- Sundaray S. K., Nayak B. B. and Bhatta D., Environmental Monitoring and Assessment, 155(1-4), 227-243 (2009).
- Suthar S., Sharma J., Chabukdhara M. and Nema A. K., Environmental Monitoring and Assessment, 165(1-4), 103-112 (2009a).
- Bhattacharyya R., Manoj K. and Padhy P. K., International Research Journal of Environment Sciences, 2(2), 53-62 (2013).
- Dahegaonkar N. R., Telkhade P. M. and Bhandarkar W. R., Bionano Frontier, 5(2-I), 196-200 (2012).
- Kumar V., Arya S., Dhaka A., Minakshi. and Chanchal., International Multidisciplinary Research Journal, 1(5), 14-16 (2011).
- Gupta N., Yadav K. K., Kumar V. and Singh D., International Journal of ChemTech Research, 5(1), 528-531 (2013).
- Sisodia R. and Moundiotiya C., Journal of Environmental Hydrology, 14(23), 1-11 (2006).
- Mahesha. and Balasubramanian A., Hydrogeochemical Studies of Dalvoy Lake Ecosystem of Mysore city, India, Proceedings of Taal2007: The 12th World Lake Conference, 337-341 (2008).
- Raghupathi H. B. and Ganeshamurthy A. N., Current Science, 105(6), 764-766 (2013).
- Maiti S. K., Handbook of Methods in Environmental Studies, Volume 1: Water and Wastewater Analysis, ABD Publishers, Jaipur, (2004).
- Srivastava R. K. and Pandey D., International Journal of Environmental Sciences, 3(3), 1089-1096 (2012).
- Nikanorov A. M. and Brazhnikova L. V., Water Chemical Composition of Rivers, Lakes and Wetlands, In: Types and Properties of Water-Volume II, Encyclopedia of Life Support Systems, United Nations Educational Scientific and Cultural Organization, (2014).
- Moore R. D., Richards G. and Story A., Streamline Watershed Management Bulletin, 11(2), 25-29 (2008).
- Weber-Scannell P. K. and Duffy L. K., American Journal of Environmental Sciences, 3(1), 1-6 (2007).
- Benham B., Ling E. J., Wright B. and Haering, K., Virginia Household Water Quality Program: Total Dissolved Solids (TDS) in Household Water, Publication 442-666, Communications and Marketing, College of Agriculture and Life Sciences, Virginia Polytechnic Institute and State University, USA, (2011).
- World Health Organization., Total Dissolved Solids in Drinking Water: Background Document for Development of WHO Guidelines for Drinking-water Quality, WHO/SDE/WSH/03.04/16, Geneva, (2003a).
- Stihi C., Popescu I. V., Bancuta A., Stihi V. and Vlaicu G., Romanian Journal of Physics, 50(9-10), 977-981 (2005).
- Boyd C. E., Water Quality: An Introduction, Springer Science and Business Media, Berlin, (2000).
- Nishanthiny S. C., Thushyanthy M., Barathithasan T. and Saravanan S., American-Eurasian Journal of Agricultural and Environmental Sciences, 7(1), 100-102 (2010).
- Klaassen C. D., Casarett and Doull’s Toxicology: The Basic Science of Poisons, The McGraw-Hill Companies Incorporation, USA, (2008).
- Wilson P. C., Water Quality Notes: Alkalinity and Hardness, Institute of Food and Agricultural sciences, University of Florida, USA, (2010).
- Sawyer C. N. and McCarty P.L., Chemistry for Sanity Engineers, McGraw-Hill, New York, (1967).
- World Health Organization., Sodium in Drinking Water: Background Document for Development of WHO Guidelines for Drinking-Water Quality, WHO/SDE/WSH/03.04/15, Geneva, (2003b).
- Khound N. J., Phukon P. and Bhattacharyya K. G., Archives of Applied Science Research, 4(2), 1169-1174 (2012).
- Ober J. A., Potash, United States Geological Survey Minerals Year Book-2006, 58.1-58.9, (2006).
- World Health Organization., Potassium in Drinking Water: Background Document for Development of WHO Guidelines for Drinking-Water Quality, WHO/HSE/WSH/09.01/7, Geneva, (2009).
- World Health Organization., Chloride in Drinking Water: Background Document for Development of WHO Guidelines for Drinking-Water Quality, WHO/SDE/WSH/03.04/03, Geneva, (2003c).
- Mullaney J. R., Lorenz D. L. and Arntson A. D., Chloride in Groundwater and Surface Water in Areas Underlain by the Glacial Aquifer System, Northern United States, U.S. Geological Survey Scientific Investigations Report 2009–5086, (2009).
- Hunt M., Herron E. and Green L., Chlorides in Fresh Water. The University of Rhode Island Watershed Watch 4, USA, (2012).
- World Health Organization., Sulphate in Drinking Water: Background Document for Development of WHO Guidelines for Drinking-Water Quality, WHO/SDE/WSH/03.04/114, Geneva, (2004a).
- Subin M. P. and Husna A. H., International Research Journal of Environment Sciences, 2(6), 76-84 (2013).
- Gujarat State Board of School Textbook., Ecosystem, In: Biology, Standard 12, Semester III, Gandhinagar, (2012).
- Correll D. L., Poultry Science, 78, 674-682 (1999).
- World Health Organization., Ammonia in Drinking Water: Background Document for Development of WHO Guidelines for Drinking-Water Quality, WHO/SDE/WSH/03.04/01, Geneva, (2003d).
- Sharma R., Suthar A. K., Arora R. and Sharma S., International Journal of Green and Herbal Chemistry, 1(1), 55-60 (2012).
- Faley B. and Chase H., Journal of Clinical Toxicology, 2(4), 127-128 (2012).
- World Health Organization., Nitrate and Nitrite in Drinking-Water: Background Document for Development of WHO Guidelines for Drinking-Water Quality, WHO/SDE/WSH/07.01/16/Rev/1, Geneva, (2011a).
- Harrison R. M., Pollution: Causes, Effects and Control, The Royal Society of Chemistry, Cambridge, (2001).
- Chapman D., Water Quality Assessments-A Guide to Use of Biota, Sediments and Water in Environmental Monitoring, United Nations Educational Scientific and Cultural Organization/World Health Organization/United Nations Environment Programme, London, (1996).
- Araoye P. A., International Journal of Physical Sciences, 4(5), 271-274 (2009).
- Rounds S. A., Wilde F. D. and Ritz G. F., Dissolved Oxygen (Version 3.0), Book 9, Chapter A6, Section 6.2, U.S. Geological Survey Techniques of Water-Resources Investigations, http://water.usgs.gov/owq/FieldManual/Chapter6/6.2_v3.0.pdf, Accessed on 13.10.2013, (2013).
- Sullivan A. B., Snyder D. M. and Rounds S. A., Chemical Geology, 269, 12-21 (2010).
- Unite Nations Environment Programme Global Environment Monitoring System., Water Quality for Ecosystem and Human Health, UN GEMS/Water Programme Office, Ontario, (2008).
- Valko M., Morris H. and Cronin M. T. D., Current Medicinal Chemistry,12(10), 1161-1208 (2005).
- Tewari R. K., Kumar P. and Sharma P. N., Journal of Plant Nutrition and Soil Science, 171, 286-294 (2008).
- Erikson K. M., Dobson A. W., Dorman D. C. and Aschner, M., Science of the Total Environment, 334-335, 409-416 (2004).
- Santamaria A. B., Indian Journal of Medical Research, 128, 484-500 (2008).
- Benedetto A., Au C., Avila D. S., Milatovic D. and Aschner M., PLoS Genetics, 6(8), 1-18 (2010).
- Bhuvaneswari D. C., Kiran K. K., Vaddana J. and Indravathi G., International Journal of Innovative Research in Science, Engineeringand Technology, 3(2), 9252-9263 (2014).
- Manoj K. and Padhy P. K., International Research Journal of Biological Sciences, 2(10), 91-101, (2013).
- Bureau of Indian Standards., Indian Standard Drinking Water-Specification (2.1 Ed, First Revision, UDC 628.1.033) IS 10500: 1991, Manak Bhawan, Government of India, (2003).
- Singh V. K., Singh K. P. and Mohan D., Environmental Monitoring and Assessment, 105, 43-67 (2005b).
- Kar D., Sur P., Mandal S. K., Saha T. and Kole R. K., International Journal of Environmental Science and Technology, 5(1), 119-124 (2008).
- Begum A., Ramaiah M., Harikrishna., Khan I. and Veena, K., E-Journal of Chemistry, 6(1), 47-52 (2009).
- Suthar S., Nema A. K., Chabukdhara M. and Gupta S. K., Journal of Hazardous Materials, 171(1-3), 1088-1095 (2009b).
- Nair I.V., Singh K., Arumugam M., Gangadhar K. and Clarson D., World Applied Science Journal, 9(10), 1100-1107 (2010).
- Reza R. and Singh G., International Journal of Environmental Science Technology, 7(4), 785-792 (2010).
- Harikumar P. S., Nasir U. P. and Rahman M. P. M., International Journal of Environmental Science and Technology, 6, 225-232 (2009).
- Sekabira K., Oryem O. H., Basamba T. A., Mutumba G. and Kakudidi E., International Journal of Environmental Science and Technology, 7, 435-446 (2010).
- Mohiuddin K. M., Zakir H. M., Otomo K., Sharmin S. and Shikazono N., International Journal of Environmental Science and Technology, 7, 17-28 (2010).
- Sun W., Sang L. and Jiang B., Journal of Soils and Sediments, 12, 1649-1657 (2012).
- Milenkovic N., Damjanovic M. and Ristic M., Polish Journal of Environmental Studies, 14, 781-787 (2005).
- Prasad M. B. K., Ramanathan A. L., Shrivastav S. K., Anshumali. and Saxena R., Environmental Monitoring and Assessment, 121, 77-102 (2006).
- Manoj K. and Padhy P. K., Journal of Environmental Protection, 5, 1419-1434, (2014).
- Turekian K. K. and Wedepohl K. H., Geological Society of America Bulletin,72, 175-192 (1961).
- Chakravarty M. and Patgiri A. D., Journal of Human Ecology, 27(1), 63-67 (2009).
- Martin J. M. and Meybeck M., Marine Chemistry, 7, 173-206 (1979).
- Rath P., Panda U. C., Bhatta D. and Sahoo B. N., Journal of the Geological Society of India, 65, 487-492 (2005).
- MacDonald D. D., Ingersoll C. G. and Berger T. A., Archives of Environmental Contamination and Toxicology, 39, 20-31 (2000).
- Perin G., Bonardi M., Fabris R., Simoncini B., Manente S., Tosi L. and Scotto S., Environmental Technology, 18(6), 593-604 (1997).
- Bakan G. and Özkoç H. B., International Journal of Environmental Studies, 64(1), 45-57 (2007).
- Jumbe A. S. and Nandini N., American Journal of Environmental Sciences, 5, 678-687 (2009).
- Florida Department of Environmental Protection., Approach to the Assessment of Sediment Quality in Florida Coastal Waters, Volume 1-Development and Evaluation of Sediment Quality Assessment Guidelines, http://www.dep.state.fl.us/waste/quick_topics/publications/documents/sediment/volume1/chapter6.pdf, Accessed on 23.08.2011, (1994).
- Canadian Council of Ministers of the Environment., Canadian Sediment Quality Guidelines for the Protection of Aquatic Life: Summary Tables, updated, In: Canadian Environmental Quality Guidelines, 1999, Winnipeg., http://st-ts.ccme.ca/en/index.html, Accessed on 23.08.2011, (2002).
- Ontario Ministry of Environment and Energy., Guidelines for the Protection and Management of Aquatic Sediment Quality in Ontario, http://agrienvarchive.ca/download/guide_aquatic_sed93.pdf, Accessed on 23.08.2011, (1993).
- National Oceanographic and Atmospheric Administration., Sediment Quality Guidelines Developed for the National Status and Trends Program, http://archive.orr.noaa.gov/book_shelf/121_sedi_qual_guide.pdf, Accessed on 23.08.2011, (1999).
- Harikumar P. S. and Jisha T. S., International Journal of Engineering Science and Technology, 2(5), 840-850 (2010).
- Bowen H. J. M., Environmental Chemistry of the Elements, Academic Press, New York, (1979).
- United States Environmental Protection Agency., Appendix E: Toxicity Reference Values, In: Screening Level Ecological Risk Assessment Protocol, http://www.epa.gov/osw/hazard/tsd/td/combust/eco-risk/volume3/appx-e.pdf, Accessed on 23.08.2011, (1999).
- United States Department of Energy., Toxicological Benchmarks for Screening Contaminants of Potential Concern for Effects on Sediment-Associated Biota: 1997 Revision (ES/ER/TM-95/R4), http://rais.ornl.gov/documents/tm95r4.pdf, Accessed on 23.08.2011, (1997).
- Xing W. and Liu G., Fresenius Environmental Bulletin, 20(6), 1339-1345 (2011).
- World Health Organization., Iron in Drinking Water: Background Document for Development of WHO Guidelines for Drinking-Water Quality, WHO/SDE/WSH/03.04/08, Geneva, (2003e).
- The Times of India., Toxic Metals Flood Gujarat rivers, Bennett Coleman and Company Limited, Ahmedabad, (2014c).
- World Health Organization., Zinc in Drinking Water: Background Document for Development of WHO Guidelines for Drinking-Water Quality, WHO/SDE/WSH/03.04/17, Geneva, (2003f).
- Manahan S. E., Environmental Chemistry, CRC Press LLC, Boca Raton, (2000).
- World Health Organization., Copper in Drinking Water: Background Document for Development of WHO Guidelines for Drinking-Water Quality, WHO/SDE/WSH/03.04/88, Geneva, (2004b).
- World Health Organization., Lead in Drinking Water: Background Document for Development of WHO Guidelines for Drinking-Water Quality, WHO/SDE/WSH/03.04/09/Rev/1, Geneva, (2011b).
- Ming-Ho Y., Environmental Toxicology: Biological and Health Effects of Pollutants, CRC Press LLC, Boca Raton, (2005).
- Muntau H. and Baudo, R., Sources of Cadmium, its Distribution and Turnover in the Freshwater Environment. International Agency for Research on Cancer Science Publication, 118, 133-48 (1992).
- World Health Organization., Cadmium in Drinking Water: Background Document for Development of WHO Guidelines for Drinking-Water Quality, WHO/SDE/WSH/03.04/80/Rev/1, Geneva, (2011C).
- World Health Organization., Manganese in Drinking Water: Background Document for Development of WHO Guidelines for Drinking-Water Quality, WHO/SDE/WSH/03.04/104/Rev/1, Geneva, (2011d).
- United States Environmental Protetion Agency., Drinking Water Health Advisory for Manganese, Washington DC, (2004).
- Cempel M. and Nikel G., Polish Journal of Environmental Studies, 15(3), 375-382 (2006).
- World Health Organization., Nickel in Drinking Water: Background Document for Development of WHO Guidelines for Drinking-Water Quality, WHO/SDE/WSH/07.08/55, Geneva, (2007).
- Åšwietlik R., Polish Journal of Environmental Studies, 7(5), 257-266 (1998).
- WHO, World Health Organization., Chromium in drinking water: Background Document for Development of WHO Guidelines for Drinking-Water Quality, WHO/SDE/WSH/03.04/04, Geneva, (2003g).
- Linos A., Petralias A., Christophi C. A., Christoforidou E., Kouroutou P., Stoltidis M., Veloudaki A., Tzala E., Makris K. C. and Karagas M. R., Environmental Health, 10:50, 1-8 (2011).
- Zhitkovich A., Chemical Research in Toxicology, 24, 1617-1629 (2011).
- Govindasamy C. and Sundaramoorthy M., Global Journal of Environmental Research, 5(1), 39-45 (2011).
- The Times of India., Mixed Traffic in Recycle Path, Bennett Coleman and Company Limited, Ahmedabad, (2014d).
- Comptroller and Auditor General of India., Performance Audit of Water Pollution in India, CAG Report Number 21 of 2011-12, New Delhi, (2012).
- Gong De., Gao X., Ntakirutimana T., Guo J. and Li K., Polish Journal of Environmental Studies, 22, 1061-1067 (2013).
- Biswas J. K. and Rana S., Journal of Clean Energy Technologies, 2, 23-27 (2014).
- The Times of India., States and Centre Agree on Tighter Green Regime, Bennet Coleman and Company Limited, Ahmedabad, (2015).


