Dispersion Pattern of Native Species in Sal Forests of Chhotanagpur Plateau, India.
Chandravir Narayan1 and Anshumali 1
1
Department of Environmental Science And Engineering,
Indian School Of Mines,
Dhanbad,
826004
Jharkhand
India
http://dx.doi.org/10.12944/CWE.10.2.12
Changes in the dispersion pattern of native tree species were studied in Sal forests of Chhotanagpur plateau by selecting 1 hectare (ha) plot at four sites, located 2 to 10 km apart from each other. Each plot was divided into 100 quadrats each of 10 m x 10 m in size. For each 10 m x 10 m quadrat, the number of species and density of adult trees (>30 cm circumference at breast height: 1.37 m) were measured and identified. The range of uniform dispersion (77-89%) was greater than clumped dispersion (6-19%) and random dispersion (4-8%) in all four sites. About 78% of the plant species were characterised by uniform dispersion indicating dominant ecological reaction (i.e. dispersion behaviour) in response to alterations in the habitat conditions. A greater part of quadrats had 1-3 species and 1-4, 5-8 and 9-12 individuals indicating a patchy habitat with poor species richness and density at each site, a characteristic of the highly disturbed Sal forests.
Copy the following to cite this article:
Narayan C, Anshumali. Dispersion Pattern of Native Species in Sal Forests of Chhotanagpur Plateau, India. Curr World Environ 2015;10(2) DOI:http://dx.doi.org/10.12944/CWE.10.2.12
Copy the following to cite this URL:
Narayan C, Anshumali. Dispersion Pattern of Native Species in Sal Forests of Chhotanagpur Plateau, India. Curr World Environ 2015;10(2). Available from: http://www.cwejournal.org/?p=11922
Download article (pdf) Citation Manager Publish History
Introduction
The dispersion pattern of individuals in inhabitants illustrates their spacing correspondingly to each other. The altered species and populations of the same species can reveal different dispersion patterns (Mishra and Anshumali, 2014). In common, dispersion pattern have one of three fundamental patterns: random, uniform (evenly spaced or hyper-dispersed), or clumped (aggregated or contiguous). Species characteristics such as territoriality, social behaviours, dispersal ability, allelochemistry, emigration, immigration etc., change population dispersion patterns in the tropical forests. In accumulation to species characteristics, the dispersion of resources or microhabitats associates population dispersion patterns to the adjoining abiotic environment.
The arid tropical forest is 38.2% of the total forest cover in India (MoEF, 1999) which is mostly endangered by lopping, ablaze, overgrazing and clearing for husbandry (Jha and Singh, 1990). Deciduous forests are variety of life forms, but they are not considered as species-rich (Gentry, 1995). Deciduous forest assume remarkable consequence in favour of conservation since they are the mainly used and endangered ecosystems (Medina, 1995), particularly in India. Murphy and Lugo (1986) argued that the seasonally dry deciduous forests are the most disturbed and least protected ecosystem on earth. As about 42% of the world forests are dry forests, successful conservation of these tropical forests will ultimately depend on understanding their ecosystems (Gentry, 1990; Hartshorn, 1983). The diversity interruption debate requirements for further work, and the comprehensive information on the interruption grade of species distribution, dispersal, forest density, structure and species diversity from dry tropical forest is lacking.
In Chhotanagpur plateau, the Sal forests are undergoing rapid changes due to invasion by weeds, grazing, extraction of timber and non-timber resource, etc. As a consequence, the residue Sal forest cover exists in the form of non-contiguous patches of varying sizes. Aspect information on the dispersion of native species is deficient in such Sal forests around the Chhotanagpur region. Hence, the aim of present study was to find out the dispersion pattern of the native tree species in Sal forests and assess the impact of natural and anthropogenic constraints in the conservation of tropical deciduous forests.
 |
|
Materials and Methods
Study area
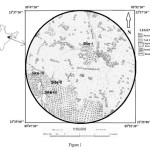
The study area was located in the tropical deciduous forests around Chhotanagpur Plateau, India (latitude 23o 35’ 87’’ N to 23o 37’ 03’’ N, longitude 85o 48’ 30’’ E to 85o 50’ 42’’ E). The elevation ranges from 200 to 350 m above sea level. The mean annual precipitation of the district is 1363.57 mm. It is categorized by hot and dry summer from March to June and cold winter from November to February. The gradient of study area is in the direction of east and controlled the alignment of the tributaries of Damodar River. Sal (Shorea robusta) is by far the predominant tree species in the study area. The forest soils can be classified into the soil developed in different formations like granite or granite gneiss of Archean age, sandstone and shales of Gondwana formation and alluvial plain.
Field survey
Ecological study was carried out by establishing four one hectare (ha) plots at four sites: Jiradih (site-I), Chargi (site-II), Sandoi (site-III) and Chiruvabera (site-IV) in December 2012 in the Sal forest around Chhotanagpur plateau. At each site, 1-ha plot (100 m x 100 m) was demarcated by nylon rope and each plot was divided into 100 quadrates of 10 m x 10 m in size (Sagar et al., 2003). These sites were located 2 to 7 km apart from each other. In each quadrat, the diameter at breast height (dbh) of all adult trees (≥ 9.6 cm) and saplings (≥ 3.2 to < 9.6 cm) were measured and identified (Sagar et al., 2003). The circumference of adults at 1.37 m from the ground. For each 10 m x 10 m quadrat, the number of species and stem density were recorded. Regional floras such as Haines (1921-25) and Mooney (1950) were used for identifying plants. In the present study, the dispersion of species was calculated by variance-to-mean ratio (Greig-Smith, 1983) at the scale of 1 ha plot. A ratio of one indicates a random dispersion, less than one a uniform dispersion and greater than one is clumped dispersion.
Results and Discussion
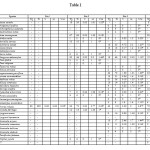
A total 38 tree species in 33 genera and 21 families were recorded in the four study sites, while two species remain unidentified (Table 1). Combretaceae and Fabaceae with 6 species each dominated the forest canopy, followed by Anacardiaceae (3), Lythraceae, Meliaceae, Moraceae, Myrtaceae and Sapotaceae (2 species each). Density-wise, Dipterocarpaceae (721 trees) and Fabaceae (187 trees) dominated the stand. Genera with a large number of plant species include Terminalia (4 species), Ficus (2) and Syzygium (2).
 |
|
The forest stands were moderately dense with total 1470 adult stems (> 9.6 cm) in the 4 hectare (mean density 368 stems ha-1). Tree density was greatest (455 stems ha-1) in site-III and lowest (290 stems ha-1) in site-I. Stand density was almost similar for site-I (290 stems ha-1) and site-II (291 stems ha-1). The stem density (> 9.6 cm) of Shorea robusta varied from 72 ha-1 to 290 ha-1 followed by Butea monosperma, Diospyros melanoxylon, and Buchnania lanzan. The density of seedling (diameter <3.2 cm) varied from 0 to 6147 ha-1; while the sapling density (>3.2 to <9.6 cm) recorded in the range of 0 to 874 ha-1. The Shorea robusta was common tree species on all sites. In addition to this, Bombax ceiba, Diospyros melanoxylon and Phoenix dactylifera were also common on three sites. Basal area was least (5.1 m2ha-1) in site-II and greatest (39.3 m2ha-1) in site-I. Based on basal area site-I, III and IV was dominated by Shorea robusta, while site-II was dominated by Butea monosperma.
The dispersion pattern of the four sites is given in the Table 2. The uniform dispersion (77-89%) was dominant followed by the clumped (6-19%) dispersion in all four sites. Random distribution was observed only in the case of S. febrifuga in site-II, T. chebula in site-III and A (unidentified species) in site-IV. The clumped dispersion in species may be due to coppice forming habit, patchy distribution of microhabitats, inadequate form of seed dispersal and gap formation (Lieberman, 1979; Armesto et al., 1986; Roy and Singh, 1994; Barik et al., 1996; Richards, 1996). According to Odum (1971), the clumped dispersion is frequent in environment while random dispersion is only in extremely identical environments, Tripathi and Singh (2009) found 74 to 94% and Sagar et al., (2003) recorded 42-57% species had clumped distribution in the Vindhyan forests.
Table 2: Changing nature of species distribution with their abundance in four sites
around Chhotanagpur plateau, India
|
Sl. No. |
Species |
Site 1 |
Site 2 |
Site 3 |
Site 4 |
|
1 |
Acacia catechu |
- |
29 C |
- |
8 U |
|
2 |
Anogeissus latifolia |
- |
- |
6 U |
4 U |
|
3 |
Anthocephallus cadamba |
- |
- |
4 U |
- |
|
4 |
Azadirachata indica |
- |
- |
2 U |
- |
|
5 |
Butea monosperma |
- |
89 U |
- |
27 U |
|
6 |
Bombax ceiba |
- |
3 U |
3 U |
- |
|
7 |
Boswellia serrata |
- |
10 U |
- |
7 U |
|
8 |
Buchnania lanzan |
- |
- |
35 C |
18 U |
|
9 |
Cassia fistula |
- |
- |
18 U |
3 U |
|
10 |
Dalbergia sissoo |
- |
- |
3 U |
- |
|
11 |
Derris indica |
- |
6 U |
- |
- |
|
12 |
Diospyros melanoxylon |
- |
44 C |
48 C |
12 U |
|
13 |
Ficus glabra |
- |
3 U |
- |
- |
|
14 |
Ficus religiosa |
- |
2 U |
- |
- |
|
15 |
Flacourtia indica |
- |
- |
3 U |
- |
|
16 |
Grewia serrulata |
- |
- |
2 U |
- |
|
17 |
Lagerstroemia parviflora |
- |
- |
76 C |
38 U |
|
18 |
Lannea coromandelica |
- |
- |
21 U |
- |
|
19 |
Madhuca indica |
- |
- |
26 U |
- |
|
20 |
Miliusa tomentosa |
- |
- |
14 U |
5 U |
|
21 |
Manilkara hexandra |
- |
- |
7 U |
- |
|
22 |
Moringa oleifera |
- |
- |
3 U |
13 U |
|
23 |
Nyctanthes arbortristis |
- |
9 U |
6 U |
- |
|
24 |
Phoenix dactylifera |
- |
4 U |
2 U |
5 U |
|
25 |
Pterocarpus marsupium |
- |
- |
4 U |
- |
|
26 |
Semecarpus anacardium |
- |
8 C |
6 U |
|
|
27 |
Shorea robusta |
290 U |
72 U |
119 U |
240 U |
|
28 |
Soymida febrifuga |
- |
16 R |
- |
17 U |
|
29 |
Syzygium cumini |
- |
- |
14 U |
3 U |
|
30 |
Syzygium heyneanum |
- |
- |
- |
- |
|
31 |
Terminalia arjuna |
- |
- |
17 C |
21 U |
|
32 |
Terminalia tomentosa |
- |
- |
11 U |
5 C |
|
33 |
Terminalia bellirica |
- |
- |
1 U |
- |
|
34 |
Terminalia chebula |
- |
- |
4 R |
- |
|
35 |
Woodfordia fruticosa |
- |
- |
- |
- |
|
36 |
Ziziphus jujuba |
- |
4 U |
- |
- |
|
37 |
A* |
- |
- |
- |
4 R |
The patchiness of the community increased along with increase in frequency of species-poor pockets and selective cutting of high diameter trees in the forest that might have favoured the uniform dispersion irrespective of the variations in the phenology of the tropical deciduous forests. Tropical species among small density have a tendency to contain comparatively uniform dispersion and those with elevated density include clumped dispersion (Krebs, 1972). Connell (1971) recommended facilitating the uniform dispersion patterns of species in tropical forests mainly allow the preservation of high levels of diversity (Mishra and Anshumali, 2014).
From the investigation of varying dispersion pattern; species which were there at minimum of two sites with ≥2 individuals at a site were measured (Table 3). Of the entirety analysed species, 22% showed altering nature in dispersion, some of these species altered between clumped to uniform dispersion (A. catechu, B. lanzan, D. melanoxylon, L. parviflora, S. anacardium, and T. arjuna); only one species (T. tomentosa) altered from uniform to clumped dispersion. Table 4 shows that the most of the species were illustrated by extremely few individuals which differ from site to site. The 78% of the plant species were characterized by uniform dispersion without showing any alterations in their dispersion behaviour across four sites. Hence, the uniform dispersion dominant ecological reaction (i.e. dispersion behaviour) to resists the alterations in the habitat conditions around Sal forests in Chhotanagpur plateau. This may also be an impression of spatial variations in the physico-chemical parameters, aspect, relief, moisture availability, rockiness, temperature etc.
Table 3: Number of quadrants with varying number of adult tree species and individuals in four sites around Chhotanagpur plateau, India
|
Species Class |
Site |
No. of species |
No of individuals |
||||
|
1-3 |
4-6 |
7-9 |
1-4 |
5-8 |
9-12 |
||
|
All species |
Site 1 |
98 |
0 |
0 |
95 |
3 |
0 |
|
Site 2 |
79 |
12 |
0 |
69 |
19 |
3 |
|
|
Site 3 |
77 |
21 |
0 |
52 |
44 |
2 |
|
|
Site 4 |
67 |
28 |
0 |
51 |
41 |
3 |
|
Table 4: Number of species represented by 1, 1-10, 11-20, 21-30, 31-40, 41-50 and more than
50 individuals in four sites around Chhotanagpur plateau, India.
|
Special Class |
Site |
1 |
1-10 |
11-20 |
21-30 |
31-40 |
41-50 |
>50 |
|
All Species |
Site 1 |
0 |
0 |
0 |
0 |
0 |
0 |
1 |
|
Site 2 |
0 |
8 |
1 |
1 |
0 |
1 |
2 |
|
|
Site 3 |
1 |
14 |
5 |
2 |
1 |
1 |
2 |
|
|
Site 4 |
0 |
10 |
4 |
2 |
1 |
0 |
1 |
The number of species and individuals range from 1-9 species and 1-12 individuals per quadrat of 10 m x 10 m size (Table 3). The most of the quadrats had 1-3 species and 1-4, 5-8 and 9-12 individuals represents a patchy distribution of species and individuals at every site. These community characteristics indicate a marked patchiness in the habitat conditions, a feature of the dry tropical forest (Jha and Singh, 1990). The occurrence of highest number of species with only one or 1-10 individuals represent the mixed character of the forest and a distinct spatial diversity (Richards, 2002). Sagar et al. (2003) found that the species showed by a single individual varied from 18 to 30% in the Vindhyan forests. Black et al. (1950) reported that Amazonia rain forests, above one-third of the species were showed by a distinct individual. This infers that the tropical deciduous forests are variety of communities, every of which is dispersed anthropogenically altered non-contiguous patches. The heterogeneity of the surroundings as well as disturbance is the major causes of patch formation (Forman and Godron, 1986).
Conclusion
In this study, the uniform dispersion of local tree species shows conflict to spatial variation in habitat situation. This dispersion activity also indicates that the four sites are experiencing similar climatic environments while experiencing diverse microclimate in Sal forests. This infers that fragmentation of integral forests led to arrangement of patches but the uniform dispersion behaviour is changing slowly into clumped or random dispersion. The management of Sal forest thus need urgent attention in the Chhotanagpur plateau region from its fragmentation into non-contiguous patches. This will assist in restoration of phenology, regeneration and diversity of native tree species in the tropical deciduous forests in India.
References
- Armesto, J.J., Mitzel, J.D. and Villagram, C. A comparison of spatial patterns of trees in some tropical and temperate forests. Biotropica 18, 1-1 (1986).
- Barik, S.K., Tripathi, R. S., Pandey, H.N. and Rao, P. Tree regeneration in a subtropical humid forest: effect of cultural disturbance on seed production and germination. J.Appl. Ecol. 33, 1551-1560. (1996).
- Black, G.A., Dobzhansky T. and Pavan C. Some attempts to estimate species diversity and population density of trees in Amazonian Forests. Bot. Gaz., 111: 413-425 (1950).
- Connell, J.H. On the role of natural enemies in preventing competitive exclusion in some marine and in rain forest trees. In: Dynamics of Populations. Center for Agricultural Publishing and Documentation (eds Den Baer P. And Gradwell P.R.) Wageningen, Netherlands, 298-312 (1971).
- Forman, R.T.T. and Godron M. Landscape Ecology. Wiley & Sons, New York. (1986).
- Gentry, A.H. Floristic Similarities and differences between southern Central America and upper and Central Amazonia. In Four Neo tropical Rainforests (ed. Gentry A.H.) Floristic Similarities and differences between southern Central America and upper and Central Amazonia. In Four Neo tropical Rainforests (ed. Gentry A.H.) Yale University Press, New haven, CT. 141-160. (1990).
- Gentry, A.H. Seasonally dry tropical forest In Bullock S.H., Mooney H.A. and Medina E. (eds). Cambridge University Press, Cambridge, 146-194. (1995).
- Greig-Smith, P. Quantitative Plant Ecology. 3rd ed. Blackwell Scientific Publications, Oxford. (1983).
- Haines, H.H. The Botany of Bihar and Orissa. Adlard & Son Ltd, London (1921-1925).
- Hartshorn G. Plants: introduction. In: Costa Rican natural history (ed Janzen D.H.) University of Chicago Press, Chicago. 118- 157. (1983).
- Jha, C.S. and Singh, J.S. Composition and dynamics of dry tropical forest in relation to soil texture. J. Veg. Sci. 1: 609-614 (1990).
- Kerbs, C.J. Ecology: The experimental analysis of distribution and abundance. Harper & Row, New York (1972).
- Lieberman D. Dynamics of forest and thickest vegetation on Accra plains, Ghana. Ph.D. Thesis. University of Ghana, Legon. (1979).
- Medina E. Seasonally dry tropical forest In Bullock S.H., Mooney H.A. and Medina E. (eds). Cambridge University Press, Cambridge, 221-242. (1995).
- Mishra S. and Anshumali. Dispersion pattern of legumes and non-legumes in the tropical deciduous forests around Jharia Coalfield, Eastern India. Indian J. of Tropical Biodiversity, 22(1), 51-56 (2014).
- Mooney, H. Supplement to the Botany of Bihar and Orissa. International Book Distributors, Dehra Dun, India, 1-308 (1950).
- Murphy P.G. and Lugo A.E. Structure and biomass of subtropical dry forest in Puerto Rico. Biotropica 18, 89-96. (1986).
- Odum, E.P. Fundamental of Ecology. 3rd edn. W.B. Saunders Co., Philadelphia. (1971).
- Richards, P. W. The Tropical Rainforest, 2nd ed. Cambridge University Press, Cambridge (1996).
- Richards, P.W. Composition of primary rain forest (II). In: Foundations of Tropical Forest Biology (eds Chazdon R.L. and Whitmore T.C.). The University of Chicago Press, Chicago and London, 538-544 (2002).
- Roy, S., Singh, J.S. Consequences of habitat heterogeneity for availability of nutrients in dry tropical forest. J. Ecol. 82, 503-509. (1994).
- Sagar, R., Raghubanshi, A.S. and Singh J.S. Tree species composition, dispersion and diversity along a disturbance gradient in a tropical forest region of India. Forest Ecology & Management 186: 61-71 (2003).
- Tripathi, K.P. and Singh B. Species diversity and vegetation structure across various strata in natural and plantation forests in Katerniaghat Wildlife Sanctuary, North India. Trop.Ecol. 50(1), 191-200. (2009).


