Effect of Fly Ash Disposal on Ground Water Quality Near Parichha Thermal Power Plant, Jhansi – A Case Study
Shubham Kanchan1 , Vinit Kumar1 , Krishna Kumar Yadav1 , Neha Gupta1 and Sandeep Arya1
http://dx.doi.org/10.12944/CWE.10.2.21
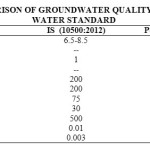
Thermal power plant generates a huge amount of fly ash on combustion of coal which is becoming a major environmental issue. Thermal power plants are greatly facing a fly ash management problem. Open dumping of fly ash can deteriorate the groundwater quality by runoff. In the present investigation, the ground water samples were collected from nearby areas of Parichha Thermal Power Plant at six locations during the period of Jan 2014 to May 2014. The samples were taken to the laboratory and analyzed for physico-chemical properties and heavy metal content. The physico-chemical analysis was done for the parameters like pH, Turbidity, Temperature, Electrical Conductivity, Alkalinity, Total Dissolved Solids, Total Hardness, Calcium Hardness and Magnesium Hardness. The concentration of Turbidity, EC and Alkalinity was exceeding the standard at all locations and shows that the groundwater of the area is not fit for drinking. The ground water samples were also analyzed for the presence of lead and cadmium and it was found that lead was exceeding the limit although cadmium was found within the limit.
Copy the following to cite this article:
Kanchan S, Kumar V, Yadav K. K, Gupta N, Arya S, Sharma S. Effect of Fly Ash Disposal on Ground Water Quality Near Parichha Thermal Power Plant, Jhansi – A Case Study. Curr World Environ 2015;10(2) DOI:http://dx.doi.org/10.12944/CWE.10.2.21
Copy the following to cite this URL:
Kanchan S, Kumar V, Yadav K. K, Gupta N, Arya S, Sharma S. Effect of Fly Ash Disposal on Ground Water Quality Near Parichha Thermal Power Plant, Jhansi – A Case Study. Curr World Environ 2015;10(2). Available from: http://www.cwejournal.org/?p=11235
Download article (pdf) Citation Manager Publish History
Introduction
Fly ash is a waste material generates on the combustion of coal in power station throughout the world. The increasing amount of fly ash being generated from thermal power plants can pose a serious environmental threat (Nalawade et al., 2012). Fly ash contains major elements like Silica, Aluminum and Iron with significant amount of Calcium, Magnesium, Potassium, Phosphorous and Sulphur (Ivanova et al., 2011; Aswar, 2001). It also contain trace amount of some heavy metals like Molybdenum, Mercury, Selenium and Cadmium etc. (Adriano et al., 1980). Fly ash in itself is a waste product and contains a huge problem for disposal. Fly ash is disposed off in ash pond by collecting it in the form of wet slurry (Singh et al., 2010). Disposal of fly ash in surface water bodies can damage the aquatic life. Mosquitoes and bacteria may grow in large number in slurry disposal lagoons/settling tank (Nawaz, 2013). The soil and water contamination from ash ponds has been a major subject of research all over the world (Theis et al., 1978; Theis and Richter, 1979; Theis and Gardner, 1990; Carlson and Adriano, 1993; Deshmukh et al., 1994; Deshmukh et al., 1995; Gulec et al., 2001; Praharaj et al., 2002; Singh et al., 2010; Ramya et al., 2013; Nawaz, 2013). The water quality plays a vital role for the mankind as it directly affects the human health. More than 90% population in India is dependent on groundwater for drinking purpose (Yadav et al., 2012; Ramachandraiah, 2004; Tank and Singh, 2010). The present study was done to assess the impact of fly ash disposal on groundwater quality near Parichha Thermal Power Plant at Jhansi.
Study Area
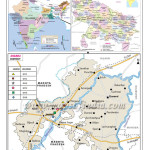
Locality near Parichha thermal power plant at Jhansi was selected as the study area. Parichha thermal power plant is located at 25°30'51.16"N and 78°45'37.40"E. Jhansi is located at 24°11' and 25°57' N and 78°10' and 79°25 E'. Jalaun lies on North to Jhansi, Mahoba and Hamirpur on East, Tikamgarh of Madhya Pradesh on South and Lalitpur on southwest which joins the Jhansi District by a narrow corridor. A map showing the sampling location of study area is depicted as figure-1.
 |
|
Collection of Sample
Groundwater samples were collected from 6 different locations near Parichha Thermal Power Plant during January to May 2014. The water samples were collected in polyethylene bottles which were pre-cleaned by nitric acid and distilled water in the laboratory. The pre-cleaned polyethylene bottles were also washed twice by water sample prior to collect the samples. The water samples were immediately taken to the laboratory and analyzed to minimize the physicochemical changes.
Physico-Chemical Analysis
Physico-chemical parameters like pH, turbidity, temperature, electrical conductivity, alkalinity, total hardness, calcium hardness, magnesium hardness and heavy metals like Lead and Cadmium were determined using standard methods of APHA (1995) and the methods by Trivedi and Goel (1986). The reagents of analytical grade were used for analysis and the instruments were calibrated.
Result and Discussion
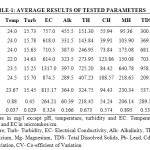
The result of physico-chemical and heavy metal analysis of groundwater collected near Parichha Thermal Power Plant is given in Table-1.
 |
|
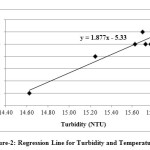
pH value of studied samples ranges from 6.99 to 7.55 which conform to the IS 10500:2012 drinking water standard. High temperature may raise the alkalinity of water because it reduce solubility of CO2. Temperature was ranges from 22ºC and 24.5ºC.
The turbidity was varied between 14.63 NTU to 15.78 NTU. It was found greater than the IS 10500:2012 standard in all the samples.
 |
|
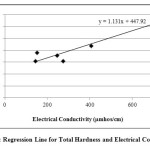
Conductivity is a carrying capacity of electrical current of a solution through the water (Gupta et al., 2013). EC values were varied between 614 to 1317 µmhos/cm. It is directly proportional to the ionizable solids.
Alkalinity of water may be due to either the always presence of strong bases like sodium hydroxide or potassium hydroxide in water or the extreme low concentration of them. Maximum alkalinity of 455.5 mg/l was recorded in GW-1 and minimum i.e. 289.5 mg/l was recorded in GW-6 which exceeds the standard value. It may be due to the minimum rate of decomposition of salts caused by low temperature and low water table (Mahananda et al., 2010). The water is well buffered if it has high alkalinity.
The range of hardness analyzed is 143.84 – 725.20 mg/l. Some samples were within the standard of drinking water and some was exceeding the limit. Hardness caused excessive soap consumption and formation of scum due to the presence of calcium and magnesium in water.
Different type of rocks, sewage and industrial waste are responsible for the calcium and magnesium in water (Trivedy and Goel, 1984). The values of calcium varied from 39.91 – 188.57 mg/l and the values of magnesium ranged from 95.56 – 640.78 mg/l.
Total Dissolved Solids and conductivity usually related with each other. The water is not considered good for drinking if TDS of water is more than 500 mg/l (Jain, 2002). The values of investigated samples were ranged between 209.5 – 958.5 mg/l. Half samples were within the drinking water standard of IS 10500:2012 and half were exceeding the limit.
 |
|
The value of lead was ranged from 0.02 to 0.04 mg/l and the range of cadmium was 0.002 to 0.004 mg/l. Use of mineral phosphate fertilizer is important source of cadmium (Lambert et al., 2007). Both parameters were detected within the permissible limit of IS 10500:2012.
 |
|
Correlation and Regression Analysis
The correlation study reduces the uncertainty range associated with decision making. The correlation co-efficient 'r' is used to know the relationship among the parameters. The co-efficient was calculated by using the below given formula:
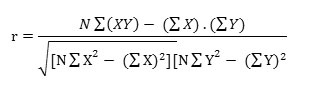
Where, X and Y represents investigated parameters, N= Number of total observation.
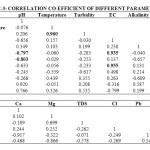
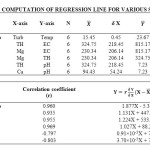
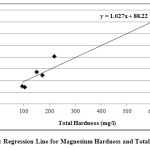
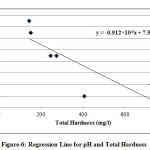
In the present study, the correlation coefficient (r) between two different parameters was calculated by considering the average values as shown in table 1. Correlation coefficient was calculated for pH, Turbidity, Temperature, EC, Alkalinity, Total Hardness, Calcium, Magnesium, Total dissolved solids, Lead and Cadmium of groundwater. The highest positive correlation (r = 0.960) was found between turbidity and temperature and the highest negative correlation (r = -0.803) was found between calcium hardness and pH. High values of the correlation coefficient between TH & EC (0.935), Mg & EC (0.955), Mg & TH (0.969), TH & pH (-0.797) as shown in table 3, were observed for the regression analysis, regression equations were formed and regression lines are drawn as shown in figures 2, 3, 4, 5, 6 and 7.
 |
|
 |
|
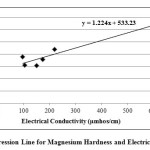 |
Fig. 4: Regression Line for Magnesium Hardness and Electrical Conductivity Click here to View figure |
 |
|
 |
|
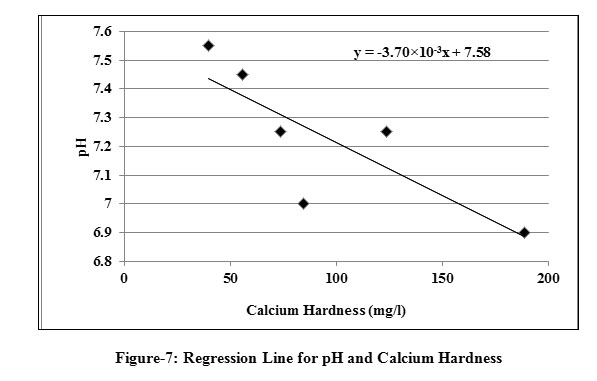 |
Fig. 7: Regression Line for pH and Calcium Hardness Click here to View figure |
Conclusion
After the analysis and interpretation of numerical data, it can be concluded that the groundwater is contaminated in terms of Turbidity, alkalinity, magnesium, total hardness, calcium and TDS. This may be due to the disposal of fly ash near Parichha Thermal Power Station. The study shows that the groundwater needs attention for certain degree of treatment before drinking. Perfect positive correlation evolved between Turbidity and Temperature (0.960), TH & EC (0.935), Mg & EC (0.0.955), Mg & pH (0.969) and perfect negative correlation evolved between TH & pH (-0.797) and Ca & pH (-0.803). It shows that Turbidity, Total Hardness and Magnesium is permanent in nature however there is no relation between TH & pH and Ca & pH. Regression lines were drawn to get the value of one parameter from another parameter.
References
- Adriano D.C., Page A.L., Elseewi A.A., Chang A.C. and Straughan I., Utilization and Disposal of fly ash and other coal Residues in terrestrial Ecosystems: A review. Journal of Environmental Quality. 9 (3): 333-344 (1980).
- Aswar W. R., Fly ash disposal and utilization: National scenario. International Conference on Fly ash Disposal and Utilization, New Delhi, India. 80 -86 (2001).
- Carlson C.L. and Adriano D.C., Environmental impacts of coal combustion residues. Journal of Environmental Quality. 22: 227–247 (1993).
- Deshmukh A.N., Shah K.C. and Appulingam S., Coal Ash: a source of fluoride contamination, A case study of Koradi Thermal Power Station, District Nagpur, Maharashtra. Gondwana Geological Magazine. 9: 21–29 (1995).
- Deshmukh A.N., Shah K.C. and Srivastava B.N., Impact of rainy season (monsoon) on fly ash dispersal–– A case study of Koradi thermal power plant, Maharashtra. Gondwana Geological Magazine. 8: 1–17 (1994).
- Gulec N., Gunal B. and Erler A., Assessment of soil and water contamination around an ash-disposal site: a case study from the Seyitomer coal-fired power plant in western Turkey. Environmental Geology. 40 (3): 331–344 (2001).
- Gupta N., Yadav K.K., Kumar V. and Singh D., Assessment of Physicochemical Properties of Yamuna River in Agra City. International Journal of ChemTech Research. 5(1): 528-531 (2013).
- Ivanova T.S., Panov Z., Blazev K. and Paneva V.Z., Investigation of fly ash heavy metals content and physicochemical properties from Thermal Power Plant, Republic of Macedonia. International Journal of Engineering Science and Technology. 3(12): 8219-8225 (2011).
- Jain C.K., A hydro-chemical study of a mountainous watershed: the Ganga, India. Water Research. 36(5): 1262-1274 (2002).
- Nalawade P.M., Bholay A.D. and Mule M.B., Assessment of Groundwater and Surface Water Quality Indices for Heavy Metals nearby Area of Parli Thermal Power Plant. Universal Journal of Environmental Research and Technology. 2(1): 47-51 (2012).
- Nawaz I. 2013 Disposal and Utilization of Fly Ash to Protect the Environment. International Journal of Innovative Research in Science, Engineering and Technology. 2(10): 5259-5266 (2013).
- Praharaj T., Swain S.P., Powell M.A., Hart B.R. and Tripathy S., Delineation of groundwater contamination around an ash pond geochemical and GIS approach. Environment International. 27: 631–638 (2002).
- Ramachandraiah C., Right to drinking water in India. Centre of Economic and Social Science Studies. 56 (2004).
- Ramya S.S., Deshmukh V.U., Khandekar V.J., Padmakar C., SuriNaidu L., Mahore P.K., Pujari P.R., Panaskar D., Labhasetwar P.K. and Rao V.V.S.G., Assessment of impact of ash ponds on groundwater quality: A case study from Koradi in Central India. Environmental Earth Sciences. 69: 2437-2450 (2013).
- Singh R., Singh R.K., Gupta N.C. and Guha B.K., Assessment of heavy metals in fly ash and Groundwater - A case study of NTPC Badarpur Thermal Power Plant, Delhi, India. Pollution Research. 29(4): 685-689 (2010).
- Standard methods for the examination of water and wastewater, 19th edn, American Public Health Association, Washington, D.C., USA (1995).
- Tank D.K. and Singh C.C.P., Analysis of major ion constituent ground water of Jaipur city. Nature and Science. 8(10): 1-7 (2010).
- Theis T.L. and Gardner K.H., Environmental assessment of ash disposal. Critical Reviews in Environmental Control. 20: 21–42 (1990).
- Theis T.L. and Richter R.O., Chemical speciation of heavy metals in power plant ash pond leachate. Environmental Science and Technology. 13: 219–224 (1979).
- Theis T.L., Westrick J.D., Hsu C.L. and Marley J.J., Field investigations of trace metals in groundwater from fly ash disposal. Journal of the Water Pollution Control Federation. 50: 2457–2469 (1978).
- Trivedy R.K. and Goel P.K., Chemical and Biological Methods for Water Pollution Studies. Environmental Publication, Karad (India) (1984).
- Trivedy R.K. and Goel P.K., Chemical and Biological Methods for Water Pollution Studies, Environmental Publication, Karad (India) (1986).
- Yadav K.K., Gupta N., Kumar V., Arya S. and Singh D., Physico-chemical analysis of selected ground water samples of Agra city, India. Recent Research in Science and Technology. 4(11): 51-54 (2012).


