Physico-Chemical Contamination of Groundwater in and Around Industrial Areas of District Alwar, Rajasthan
Mithlesh Agrawal1 * and Kailash Chand Sharma1
1
Department of Rajasthan,
University of Rajasthan,
Jaipur,
302004
India
http://dx.doi.org/10.12944/CWE.10.2.35
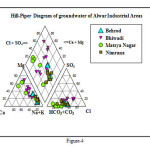
Chemical behaviors of groundwater in various locations are one of the most dynamic fields of research in the present world. In the present study, groundwater sampling from four industrial areas viz. Matsya Nagar, Bhiwadi, Neemrana and Behror was conducted with an aim to assess the groundwater chemistry and the interpretation of the ‘water type’ was made using Hill-Piper and Wilcox diagrams. The chemical quality was assessed by examining the major cations, anions and other parameters like sodium adsorption ratio, residual sodium carbonate and sodium percent. The groundwater chemistry was then assessed and factors affecting the area were identified. It was resulted that the groundwater quality of the area was influenced by industrial and human activities which cause pollution in the aquifer system and the data supported the pollution level in the area. Majority of the samples were behaved in more or less same way.
The TDS were found in average range of 1000 mg/l, while total hardness ranged the average value of 400 mg/l. Carbonate alkalinity was found in all the water samples and the average pH value were observed 8.60. In some locations, up to 337 mg/l nitrate indicates the nitrogenous contamination in the area. Fluoride was found within the prescribed limits as per BIS (Indian Drinking Water Standard, IS: 10500, 1991) norms, except one significant location at Majri Kalan in Neemrana industrial area has high fluoride as 13.0 mg/l. The interpretation of the ‘water type’ was made using Hill-Piper and Wilcox diagrams. The prominent type was Na/Mg-HCO3 and Na/Mg-Cl type of water. However, a slight variation was observed in the Na-HCO3 type of water. Sodium (alkali) hazard were observed from low (S1) to high (S3) and salinity hazard is high (C3) to very high (C4).
Copy the following to cite this article:
Agrawal M, Sharma K. C. Physico-Chemical Contamination of Groundwater in and Around Industrial Areas of District Alwar, Rajasthan. Curr World Environ 2015;10(2) DOI:http://dx.doi.org/10.12944/CWE.10.2.35
Copy the following to cite this URL:
Agrawal M, Sharma K. C. Physico-Chemical Contamination of Groundwater in and Around Industrial Areas of District Alwar, Rajasthan. Curr World Environ 2015;10(2). Available from: http://www.cwejournal.org/?p=12367
Download article (pdf) Citation Manager Publish History
Introduction
Water is one of the abundantly available substance in the nature next to air. Water is considered as a very dilute solution of number of chemicals essential for maintaining equilibrium in biochemical reactions taking place in all living organisms in order to maintain the physiology. Water quality as well as quantity crisis is the burning issue all around the world and raise a big challenge as the groundwater as use as drinking purposes become very scare in the world. Water scarcity and poor quality water is not only harmful to human life but also affects the fertility of soil and therefore diminishes the growth of plants and crops.
Development never means on the cost of nature, but the global modernization procedures puts stress on groundwater as well as surface water resources all around the world. Industrial development is the main source of water pollution as it gives out harmful chemicals and micro organisms.
Hard water mostly contains dissolved salts of calcium and magnesium as bicarbonates, sulphates and chlorides. Major cations, anions, conductivity, dissolved solids, pH, SAR, RSC and %Na are constituents of study and are determined in milligrams per litre (mg/l) or in parts per million (ppm).
District Alwar is located in north eastern part of Rajasthan in between 27040’ to 28040’ North latitude and 76070’ to 77013’ East longitude. The length of the district from north to south, it is 137 kms while from east to west, it is 110 kms. The district is surrounded by Gurgaon of Haryana and Bharatpur in north-east side, Mahendragarh of Hariyana from north-west side, Jaipur by south-west and Sawaimadhopur by southern side.
The aquifer water quality of four industrial areas viz. Matsya, Bhiwadi, Neemrana and Behror industrial area were selected for study. Industrial activities generate large number and variety of waste products which were generally discharged in to water streams. Now a day the dispersal of waste waters is of widespread national concern.
Materials and Methods
Sampling
Ground water sampling was done from different sites of industrial areas in 1.0 litre polythene bottles for the analysis of chemical parameters, 1.0 litre nitric acid treated samples for trace metal analysis and 2.0 litre for BOD and COD analysis.
Analysis
Chemical parameters like electrical conductivity and pH were determined using conductivity and pH meters. Ca, Mg and total hardness (as CaCO3) was analyzed using EDTA-complexo-metric titrations. Chloride was analyzed by standard AgNO3 as intermediate and K2CrO4 as marker (Argento-metric titration). Sulphate was analyzed using back titration method and alkalinity by acidimetric titration. Nitrate was analyzed using UV-Visible spectrophotometer at 220 nm and fluoride at 540 nm wavelengths (APHA, 1989).
TDS, total hardness (as CaCO3), TA, Na%, RSC and SAR were calculated using suitable formula.
Results and Discussion
As per WHO and BIS (IS 10500:1991) drinking water specifications, the desirable concentration of TDS is less than 500 ppm and maximum permissible limit in the absence of alternative source is 1500 ppm (2000 ppm as per BIS). Beyond this limits, palatability decreases and may cause gastrointestinal irritation. In the areas under investigation was found that out of 25 water samples 23 water samples having TDS in between 500 to 2000 mg/l (92%). Only 2 water sample ranged within 500 mg/l (8%) and no one sample cross the upper limits of TDS 2000 mg/l. The average TDS in the area was found 1018 mg/l (Figure-1). The desirable Ca+2 (as CaCO3) concentration in normal potable ground water should have less than 75.0 mg/l while 200 mg/l set as maximum permissible limit. Beyond this undesirable effects can occur. In the whole study area, the concentration of Ca-H (as CaCO3) ranges between minimum 22 mg/l at Neemrana and near Monto factory, Matsya Industrial Area to maximum 126 mg/l at Santhalka. The average calcium was measured 44 mg/l in and surrounding areas and found soft in nature and fit for drinking as well as bathing, washing, laundering and industrial activities. The concentration of Mg-H is found minimum 16 ppm at Manchal to maximum 224 mg/l at Alampur (near front gate of Ashram) with the average concentration is calculated 70 mg/l, while maximum relaxable level of magnesium in water should be 100 mg/l. (BIS, 1991 and ICMR, 1975). The result shows that the ground water of the area under investigation is safe side with respect to magnesium and suitable for specific purposes. As per BIS standards, the ground water having up to 250 mg/l total hardness (TH) is essential which relaxes up to maximum of 600 mg/l (Table-2). The average total hardness in the area under investigation is measured 396 mg/l, while it is found minimum 125 mg/l at Manchal and maximum 1175 mg/l at Alampur (near front gate of Ashram). It can be concluded that the aquifer water is quite hard in nature and it should be used for any specific purposes after taking suitable measures.
The Cl- concentration is observed minimum 50 mg/l at Khijuri was to maximum 652 mg/l at Alampur with an average concentration was measured 254 mg/l. The desirable/essential limit of chloride for drinking water is 250 mg/l and it is relaxed up to 1000 mg/l. Therefore, the chloride concentration was found in between the prescribed limits. The SO4-2 concentration in the study area were varies minimum traces at many locations to maximum 293 mg/l at Alampur, while average concentration was measured 82 mg/l. The essential level of sulphate is 200 mg/l while maximum permissible limit for drinking purpose should not be more than 400 mg/l. Therefore, on the basis of these limits and analysis results thereon, it can be said that the ground water in the area was found within limits. More than 200 mg/l sulphate was shown in some locations of Bhiwadi and Neemrana industrial areas (Table-1). As per BIS specifications, the prescribed level of total alkalinity is 200 mg/l, and the higher concentrations make the water unpleasant in taste. Alkalinity relaxes up to 600 mg/l. The water analysis results reveal that the average concentration of alkalinity in the ground water of the area under investigation was measured 468 mg/l ranges from minimum 281 mg/l at near bus stand tiraha of Bhiwadi industrial area to maximum 940 mg/l at Belni of Neemrana industrial area. The BIS sharply relaxed the NO3- concentration up to 45 mg/l in drinking water for potability which relaxes up to 100 mg/l. In the study area it was found minimum 5 mg/l at Behrod, while maximum 337 mg/l near bus stand tiraha of Bhiwadi industrial area with average of 71 mg/l indicates the increasing rate of nitrate level in the study areas (Figure-2). The F- concentration was found minimum 0.10 mg/l at Khijuriwas to maximum 1.45 mg/l near bus stand tiraha of Bhiwadi industrial area. An exceptional fluoride concentration was observed in Majri kala location of Neemrana industrial area. An elevated concentration of fluoride in groundwater is common in rocky areas heaving fluoride minerals (Handa, 1975). The average fluoride concentration was measured 1.08 mg/l. The water quality standards specified by Bureau of Indian standards (BIS) for drinking, F- concentration should not be more than 1.5 mg/l (Figure-3). Artificial recharge, blending of water, construction of well in the area where the fluoride concentrations are under the safe limits etc. may improve the aesthetic status of community of the area. (Vikasi et al, 1999).
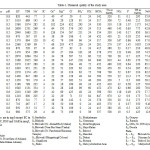 |
Table 1: Chemical quality of the study area Click here to View table |
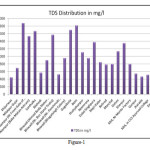 |
Figure 1 Click here to View figure |
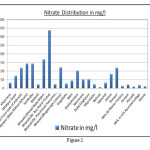 |
Figure 2 Click here to View figure |
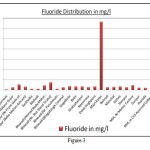 |
Figure 3 Click here to View figure |
The interpretation of the ‘water type’ was made using Hill-Piper and Wilcox diagrams.The prominent was Na/Mg-HCO3 and Na/Mg-Cl type of water. However, a slight variation was observed in the Na-HCO3 type of water. Sodium (alkali) hazard were observed from low (S1) to high (S3) and salinity hazard is high (C3) to very high (C4) (Figure-4 and 5). The average Na% of the water ranged minimum 9.49 at Jharda to maximum 82.28 in the groundwater of Daulat Singhpura with an average of 51.48 indicates that the groundwater is not fit for excellent irrigation. RSC value <2.0 meq/l put the water bodies in to good category of irrigation water. It was observed nil to 10.8 with an average 3.26 meq/l refers moderately poor quality of irrigation water. SAR reveals the ratio of sodium versus major cations and reflects the irrigation suitability of the water for different agricultural purposes. Water that has an SAR <3.0 meq/l is safe for irrigating turf and other ornamental landscape plants. Greater than 9.0 can cause severe permeability problems when applied to fine textured soils (a silty clay loam) and should be avoided. In the study, the SAR values ranges minimum 0.82 at Matsya industrial area, near CCS Ayurved College to maximum 28.15 meq/l at Dolat Singhpura with an average of 11.61 meq/l. The area fall in high sodium class and it implies that there is alkali hazard anticipated to the crops.
 |
|
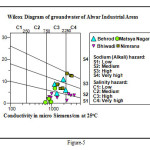 |
Figure 5 Click here to View figure |
Table 2: Ground Water Quality Standards for Drinking Purposes
|
S. No. |
Parameters |
Units |
ISI: 1991 |
ICMR: 1975 |
WHO: 2006 |
|
1 |
EC |
µS/cm at 250C |
NG |
500 |
600 |
|
2 |
pH |
- |
6.50-8.50 |
7.0-8.50 |
6.50-8.50 |
|
3 |
TDS |
mg/L |
500 |
500 |
500 |
|
4 |
Na+ |
mg/L |
NG |
NG |
200 |
|
5 |
K+ |
mg/L |
NG |
NG |
NG |
|
6 |
Ca+2 |
mg/L |
75 |
75 |
75 |
|
7 |
Mg+2 |
mg/L |
30 |
50 |
30 |
|
8 |
Cl- |
mg/L |
250 |
200 |
200 |
|
9 |
SO4-2 |
mg/L |
200 |
200 |
200 |
|
10 |
HCO3- |
mg/L |
NG |
NG |
NG |
|
11 |
NO3- |
mg/L |
45 |
20 |
50 |
|
12 |
F- |
mg/L |
1.00 |
1.00 |
1.50 |
|
13 |
TH as CaCO3 |
mg/L |
300 |
300 |
200 |
NG-No Guideline
The overall water quality of the area taken under consideration is getting deteriorated. The causes of quality variations may be attributed to the rainfall, draw down of water and geological formations/structures of the area (Sharma and Agarwal, 2013).
References
- APHA, Standards Methods for Examination of Water and Wastewater, American Public Health Association, Washington DC, edn. 17 (1989).
- BIS Indian Standard Drinking Water Standard Specification (First Revision). 8th Reprint, Sept. 2008, IS, 10500, 1991.
- Handa, B.K., Geochemistry and genesis of fluoride containing groundwater in India, Groundwater, 13, 275-281, 1975.
- ICMR Manual of Standards of Quality for Drinking Water Supplies, spl. Res. S.No. 44, ACMR, New Delhi (India), 1975.
- Sharma, K.C. and Agarwal, M., Assessment of ground water quality for drinking and irrigation purposes in Banasthali village, district-Tonk, Rajasthan, Nat. Env. & Poll. Tech., 12 (4) 679-684,
- Vikasi, C., Kushwaha, R.K. and Pandit, M.K., Hydrochemical Status of Groundwater in District Ajmer (NW India) with Reference to Fluoride Distribution, J. Geological Soc. of India, 73, 773-784 1999.
- WHO, International Standards for Drinking Water, World Health Organization, Geneva, 1971.
- WHO, Fluoride and Fluorides, Environmental Health Criteria, 21-23, 63 WHO, Geneva, Switzerland, 1984.


