Potential of Individual and Cluster Tree Cooling Effect Performances Through Tree Canopy Density Model Evaluation in Improving Urban Microclimate
Mohd Fairuz Shahidan
http://dx.doi.org/10.12944/CWE.10.2.04
Technically, trees can provide cooling effect and able to reduce ambient temperature in its own way. This paper investigates the potential of individual and cluster tree cooling effect performances in improving urban microclimate through the evaluation of urban trees canopy density. The evaluation is based on the actual measurement of Leaf Area Index (LAI) and Leaf Area Density (LAD) and uses tested computer simulation tools ENVI-met. The study found that each tree has different capabilities in modifying each microclimate variables. However, it was revealed that the optimum effect of cooling of each tree was found during the hottest day to takes place approximately at 15:00 hours when the sun is overhead and solar angle height is close to 90°. Besides, trees with higher densities such as Ficus benjamina (i.e. LAI 9.7, LAD > 1.5) showed a remarkable reduction in comparison to the other loose density trees. It is also revealed that the implementation of cluster tree planting at larger scale could maximize the effects of cooling. Nevertheless, the downside of implementing high tree density could create a reduction of 63% of wind speed that might possibly influence the air movement in urban areas due to the drag force of tree canopy. The study concluded that the performance of tree cooling effect is well correlated with tree canopy density and it is also suggested the optimum cooling effect could achieved by higher tree density (mean LAD > 1.5) and larger tree quantities with tree cluster planting.
Copy the following to cite this article:
Shahidan M. F. Potential of Individual and Cluster Tree Cooling Effect Performances Through Tree Canopy Density Model Evaluation in Improving Urban Microclimate. Curr World Environ 2015;10(2) DOI:http://dx.doi.org/10.12944/CWE.10.2.04
Copy the following to cite this URL:
Shahidan M. F. Potential of Individual and Cluster Tree Cooling Effect Performances Through Tree Canopy Density Model Evaluation in Improving Urban Microclimate. Curr World Environ 2015;10(2). Available from: http://www.cwejournal.org/?p=11939
Download article (pdf) Citation Manager Publish History
Introduction
The combination good natural elements and effective landscape design may provide the approach to create both sustainable urban development and desirable urban environment through the modification of urban microclimate. The modification can be targeted at four key microclimate components of the dynamic outdoor thermal cycle: wind velocity, humidity, temperature and radiation. A good quality landscape, with its own characteristics can be adapted on its technical and functionality to address these microclimates in the whole design development. This approach emphasises better appreciation of the climates in the basic design principles to provide a potential solution to the urban heat island phenomenon. For instance, by creating as much outdoor shading as possible, preventing solar radiation from reaching façade of building and ground surfaces, and actively utilizing the cooling effect of the latent heat of evapotranspiration. Trees have its own potential in offering this significant effect especially in natural cooling. It is important to determine their capability in improving urban air temperature through microclimate modification. However, it should be noted that different types of tree species offer variations in cooling effect performance. This can be determined by the physical properties of each tree species such as canopy density and tree form (Kotzen, 2003; Fahmy et al., 2010; Shahidan et al., 2010). Therefore, it is vital for this study to examine the variation in tree species cooling effect performance that is influenced by its physical properties. The changes or improvement in microclimate components thus become the evaluation performance parameters in considering the cooling effect from each tree. The potential of individual and cluster tree cooling effects based on tree physical properties are demonstrated – i.e. tree canopy density of Leaf Area Index (LAI) and Leaf Area Density (LAD) in modifying urban microclimate environment through each variable such as air temperature, relative humidity, absolute humidity, ground surface temperature, wind, solar and terrestrial radiation.
Microclimate Modification
In general, the microclimate consists of five main components that affect the condition of outdoor spaces. Physically, the components can be modified by elements in landscape. In modifying the microclimatic environment, there are four main ways to be applied through landscape elements, especially green structures. These include relative humidity, wind modification, incoming solar radiation, terrestrial radiation from the ground and other surfaces (Shahidan et al., 2010). In other words, trees can have some effects on all modifications but the most significant effect is in modifying radiations through the creation of shades (Kotzen, 2003; Shahidan et al., 2010). In this case, tree radiation modification is the utmost modifications that could enhance the cooling effect performance and reduced surrounding air temperature in urban areas. In fact, other microclimate factors too will influenced by the changing of radiation through the modification.
Solar and Terrestrial Radiation Modification
Based on previous studies, a tree is able to intercept solar radiation through its canopies by leaves and branching system (Brown and Gillespie, 1995 and Shahidan et al., 2010). Almost 93% of higher radiation interception will be achieved due to high dense foliage covers and multiple layer arrangement of branching and twigs (Shahidan et al., 2012). Thus in improving efficiency in radiation absorption and reflection, forms, arrangements and sizes of leaves play a significant role. This is associated with LAI, defined as a dimensionless value of the leaf area per unit ground area and a key measure used to understand and compare plant canopies (Steven et al., 1986 and Meir et al., 2000). In this case, lowest amount of terrestrial radiation underneath tree canopy could be achieved due to higher tree density tree canopy that generates low amount of radiant heat. This will promote evapotranspiration and increase of latent heat that improve surrounding ambient by decreasing of air temperature and increasing humidity (Shahidan et al., 2012). Thus, cooling benefits can be obtained from high quality of shade creation and incoming radiation filtration. In conclusion, high performance of shade trees are essential in controlling the radiative heat exchange process of ground surfaces.
Air Temperature and Humidity Modification
Air temperature and atmospheric humidity cannot normally be significantly modified by landscape elements. The atmosphere is such an efficient mixer that any temperature or humidity differences that may occur are normally dissipated very quickly by air movement (Brown and Gillespie, 1995). However, it can be achieved through the other microclimate components such as radiation and wind modification. As these modifications take place, trees can modify microclimate through shading, wind shielding, evapotranspiration and photosynthesis (Robinette, 1972; Dimoudi and Nikolopoulou, 2003; Wong and Yu, 2009). Most of the absorbed solar radiation can be modified to latent heat which converts water from liquid to gas through photosynthesis process (Sheweka et al, 2011). This condition resulting in lower leaf temperature, lower surrounding air temperature and higher humidity through the process of evapotranspiration (Kurn et al., 1994; Wong and Yu, 2009). Generally, evapotranspiration (ET) (i.e. evaporation and transpiration) from soil-vegetation systems is another effective moderator of near-surface climates, particularly in the hot climate. Evaporation takes place from leaves surfaces and ground surfaces to air (Dimoudi and Nikolopoulou, 2003). Meanwhile, transpiration from the soil through leaves stems due to photosynthesis that circulates this system (Fahmy, 2010). Essentially, the energy transferred to latent heat through plants can be very high (Wong and Yu, 2009). The perfect control system such as tree with 50-100 stomata on each mm2 of leaf surface can react individually to both internal water system and external microclimate condition (Pokorny, 2001). One large tree has several billions of stomata, as its leaf area is several times greater than the tree’s simply projected ground area (a typical leaf area index of 3-6), thus, larger amount of leaves in one tree canopy could transpire more water into urban atmosphere (Pokorny, 2001). Besides, the presence of vegetative cooling may be effectively determined through measurements of absolute humidity (g/m3) (Konya, 1980; Kurn et al., 1994, Spangernberg et al., 2008). The variation contribution of evapotranspiration on each plant can be easily determined by measuring the increase of moisture content in the air. This measurement will determine the effect of trees towards microclimate and the greater effect will influence on the urban temperature and relative humidity.
Tree Physical Properties
Leaf Area Index (LAI) and Leaf Area Density (LAD)
Evidently, the density of tree canopy properties will influence thermal performance, shade effectiveness and evapotranspiration. In one hand, the shade effectiveness and thermal performance which in turn depend on foliage characteristics as well as tree mature shape. On the other hand, evapotranspiration is depending on the quantity of foliage that can absorb and transfer the energy to latent heat (water vapour) (Kotzen, 2005; Fahmy et al., 2010; Shahidan et al., 2010). Both are well related to LAI and LAD that are considered as conceptual environmental canopy modelling parameters to study heat exchanges of trees with the environment, as they have significant role in urban heat balance (Fahmy et al., 2010, Shahidan et al., 2010).
LAI can be defined based on the radiation interception concept through flat leaves trees’ canopies as a dimensionless value of the total one sided leaf surface area (m2) of a tree divided by the tree planting ground area (m2) (Fahmy, 2010). Thus, with this value, tree canopies across tree species and across trees within a species can be compared and evaluated (Shahidan et al., 2010). It has been proved to be measured by instruments - i.e. Plant Canopy Analyzer (Kotzen, 2003; Jonckheere et al., 2004; Shahidan et al., 2010). Besides, this value is important in determining LAD of trees. LAD is key parameter needed to model the radiation through a tree canopy and between a tree and its environment (Fahmy, 2010). It can be defined as total one sided leaf area (m2) per unit layer volume (m3) in each horizontal slices along the height of a tree that can give an idea about the vertical leaves distribution (Fahmy, 2010). LAD modelling can be estimated by means of field measurement or using instrumentations along with empirical models (Jonckheere et al., 2004; Fahmy, 2010). For example, Mier et al. (2000) and Pierce and Running (1988) using instrumentations in finding LAD, whilst Stadt and Lieffers (2000), Lalic and Mihalovic (2004) and Fahmy et al. (2010) using empirical model in modelling in determine LAD values. However, in this study the actual LAD values can be determined by actual LAI values from the field measurement based on Bruse (2008) and Lalic and Mihalovic (2004) simplified equations presented below:
LAI = LADz*dz Eq. 1
where, LADz is the total LAD in one tree;
dz is the tree’s total height;
Therefore, in finding the actual LAD in z-height for one tree, Eq. 10 can be converted into:
LADz = LAIz / dz Eq. 2
This equation can also be useful in determining the vertical distribution of LAD for each height of LAD slice, zp, and can be calculated by applying actual LAI values obtained from optical measurements (Bruce, 2008). In this case the intention is to use an analytical approach through the assumption value of LAI by Lalic and Mihailovic (2004) and Fahmy et al (2010). Therefore, each LAD slice, z, is divided according to 10 LAD profiles of h/10, where h is the total height of tree. Thus, Eq.11 can be rewritten as:
zp = LAIz / (h/10) Eq. 3
Where, zp, is the LAD value at height of LAD slice;
LAIz, is the leaf area index at selected height, z;
h, is the tree’s total height;
Nevertheless, the value in each LAD slice, zp, can be confirmed by summing up the difference LAD levels and compare with total LAI values of tree.Based on the equations above, the LAD distribution and values in any type of trees can be estimated as the data needed for latter simulation studies. Thus, the knowledge on leaf area density identification will determine the thermal performance in each tree type and how far it can offer the cooling effect to the environment.
Materials and Methods
Local tree development and determination of per-tree cooling effect performance
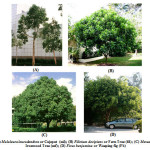
Selected trees were chosen based on the determination of LAI and LAD values in providing information of local tree database that is coordinated with ENVI-met model and their cooling effect performance. Thus, selection of sample of trees were according to their characteristics, i.e. types and locality of tree, height of the tree and densities of the canopy. Due to availability of tree species and time limitation, only four selected trees were chosen in representing each category of densities from 0.5 to 2.0 LAD. The selected tree species with their respective LAI values are as follows: (i) Malaleuca leucadendron or Cajeput – ml (LAI = 0.93); (ii) Filicium decipiens or Fern Tree – fd (LAI = 4.8); (iii) Mesua ferrea or Ironwood Tree – mf (LAI = 7.9), and (iv) Ficus benjamina or Weeping fig – Fb (LAI = 9.7) (Fig. 1).
 |
|
Field measurement to find the actual LAI and LAD distribution values for each individual tree was made during the month of January, 2009 in Putrajaya, Malaysia. Then, the data taken was transferred and calculated using Eq. A.1 to A.4 in developing new tree database for ENVI –met simulation that is based on local climate condition and species.
In the LAI and LAD field measurement, specific procedures were conducted in finding the actual LAD distribution in each tree. The LAI’s measurement was based on the Isolated Plants Method (LI-COR, Inc., 1992). The calculations of the LAI using LAI-2000 require measurements above (A) and below (B) the vegetation and using 90° view cap as presented in the earlier author research (Shahidan et al., 2010). However, in order to determine LAD distribution in each layer of the canopy or LAD slice, zp, an advanced procedure was conducted that is based from the previous method. In the measurement, Plant Canopy Analyzer LAI-2000 was used in determining the LAI values in each layers of the canopy. The procedures from the field measurement to update data storage in ENVI-met simulation model plant database were conducted based on the steps below:
- The selected tree was measured using measuring tape to measure the total height, h, from ground to the highest peak of the canopy.
- In order to determine the total LAI (LAI (to)) for the tree, the same procedures from the previous research were used (Shahidan et al., 2010).
- After the total LAI was determined, the tree total height was divided into 10 sections where each of the section LAI was measured accordingly using Plant Canopy Analyzer LAI-2000 in obtaining the LAIz (Fig. 2).
- The same method from the previous research procedures was used in measuring the LAIz for each tree section.
- Then, the results from each section was used in calculating, zp, for each section of the tree using equation A3.
- The results of zp from each section were added for the sum of LAD (SLAD) and compared with LAI(to) that was measured earlier in the second (2) steps to ensure the sensibility of the measurement (Bruse, 2009).
- Then, the result from each tree was transferred and stored into ENVI-met model plant database PLANTS.DAT based on each LAD layers distribution (LAD1 to LAD10) added as a local database.
- Finally, all trees were simulated in basic setting of ENVI-met model with 50m x 50m domain to predict and compare individual and cluster tree cooling effect performance by comparing the outside-inside tree canopy meteorological parameters.
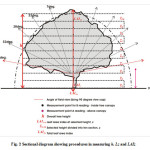 |
Figure 2: Sectional diagram showing procedures in measuring h, Lz and LAIz Click here to View figure |
ENVI-met 3.1 numerical modelling
ENVI-met (Bruse, 2009) is a non-hydrostatic prognostic model based on the fundamental laws of fluid dynamics and heat transfer in a much improved package than only a CFD package for fluid dynamics’ simulation (Shahidan et al., 2012). It nearly has the complete capability to simulate built environments from microclimate scale to local climate scale at any location. In compare to the other models, preferences in using ENVI-met as this model applies a soil-plant-air sub model and development in new plant database. ENVI-met vegetation model provide the actual technical process in single trees and is formed of four sub-models (Fahmy et al., 2010).
Validation of ENVI-met model – Computed and Measurement Comparisons
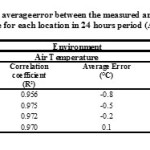
An experiment has been conducted for validating accuracy based on the actual one clear day measurement in Putrajaya, Malaysia, i.e. February 28, 2009. A horizontal resolution of 20 m x 20m was chosen for the model area. In the pilot simulation, the diurnal amplitude tends to increase with decreased wind speed. Therefore, the average mean wind speed measured was changed from 2.1 m/s to 1.0 m/s. Four selected location points were evaluated in this experiment. Three locations were selected with variation in tree density and one location with pavement and without trees. A similar 24 hours surface air temperature curves were achieved and the calculated correlation coefficient, R2, between measured and computed for measurement point ranged from 0.860 to 0.975 as shown in Table 1. Thus, it suffices to say here that the measured and computed values of Ta and Ts was well correlated and considered reliable in presenting the effect of tree cooling performance based on microclimate parameter modification.
 |
|
Results
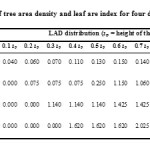
Tree cooling effect performance prediction was simulated based on the results from leaf area index and leaf area density field measurement of four different types of tree. The results of LAD distribution, Lz, average distribution of LAD, LADave; LAD classes, LADclasses; and LAI of each selected trees is presented in Table 2.
 |
|
Air Temperature
Obviously, in Fig. 3, the effect of trees in reducing the air temperature occurred from 08:00 and gradually increased until it reached the peak at 15:00 hours, then the effect started to decrease gradually in the evening. However, the individual effect of each tree can be seen based on the differences starting from 10:00 to 16:00. During the peak hour, the Fb shows the highest maximum reduction with magnitude of 1.38°C differences from the outside air temperature. It follows by fd and mf with both maximum reduction of 1.2°C and the lowest maximum reduction of 1.1°C for ml. During these hours, it can be observed that the tree shading effect is greater during the middle of the day from 12:00 to 15:00 when the solar position is overhead and is hottest (Shahidan, 2010). The shade is concerted directly around the tree canopy and provides it full shades. Thus, the air temperature becomes lower compared to the outside ambient temperature and it is affected until it reached it peaks at 15:00 hour. This is correlated to Kotzen (2005) and Shahidan et al. (2010) studies where the greatest effect of tree shading can be found during these hours. Besides, it is believed that the process of evaporation and transpiration in each tree was different due to the amount of leaves and the density of shade that were created throughout these hours. In addition, the process of radiation filtration varied according to density of each tree (Brown and Gillespie, 1995; Shahidan et al., 2010).
On average, the air temperature reduction of Fb is the highest with magnitude of 0.6°C, follows by mf, fd and ml with magnitude of 0.51°C, 0.42°C and 0.37°C, respectively. The regression model presented displays a linear pattern (Fig. 3).
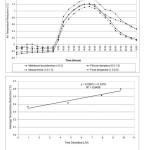 |
Figure 3: Comparison of hourly temperature reductions for four different tree species in 24-hours period and correlation of average air temperature and tree densities (LAI) of four different tree species Click here to View figure |
LAI value showed a greater increase of average temperature reduction. Thus, it noted that the average temperature reduction corresponds to the higher LAI values of tree canopy with R2 value of 0.94. In relation to the result, it is confirmed that the variation of reductions are due to the canopy proportions and foliage differences with densities variation. In fact, the greater reduction within the tree canopy parameter was affected by the solidness of shading effect and radiation interception due to the greater density of the canopy during the daytime. For instance, trees with the same density as Fb (more than 9 LAI values) warming the air less compared to other trees with lower densities. Thus, the high quality of shade and incoming solar radiation interception will produce greater cooling benefits. Further, clusters arrangement of tree would be benefited greater cooling effect.
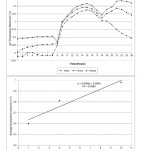 |
Figure 4: Comparison of hourly temperature reductions for one, four and ten trees in 24-hours period and correlation of average air temperature and tree quantities of Ficus benjamina tree species Click here to View figure |
Fig. 4 shows the hourly air temperature reduction for one, four and ten high density of Fb trees in 24 hours period. The graph show the same reduction patterns during the peak hours and the air temperature reduction become higher as the quantities of trees become larger. The additional maximum reduction comparing to single trees are 0.08°C and 0.2°C for four and ten trees added to the site, respectively. However, during the night time starting from 18:00 hours the reduction is gradually increased comparing to the single tree that is reduced. It is believed that with additional trees that provide larger shaded area during the daytime are able to maintain lower air temperature underneath the tree comparing to the outside temperature during the night time. This condition continued with constant lower surface temperature during the daytime and throughout the night time compared to the outside surface material that slowly starts to expel heat stored during the day time. The heat from the outside surface warming the air more and the differences of outside and underneath become larger. However, due to slower heat diffusion during the night time inside the tree canopy, higher temperature differences can be found at the beginning of the day compared to the outside condition. Nevertheless, the results demonstrate the importance of cluster planting that offers an optimum cooling performance as the quantities of trees become larger during the hottest period of the day. This is presented in Fig. 4 where about 60% more reduction when 10 trees are added to the site. This result confirmed that the higher average temperature reduction corresponds to the larger trees’ quantities with R2 value of 0.94. Thus, it suffices to say here that the larger density and quantity of trees influenced the performance of tree cooling especially in air temperature reduction.
Relative Humidity
 |
|
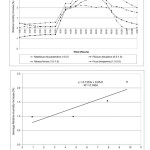
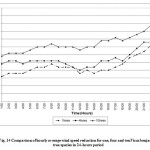
In Fig. 5, it can be observed that the relative humidity increase pattern is correlated with air temperature reduction presented in earlier section. The highest temperature reduction creates higher increase of relative humidity starting from 08:00 to the peak at 15:00 to 17:00 hours and reduced gradually during the night time. However, the ml tree species keep constant at 2% level of reduction and this may be due to the loose canopy that is mixed with the outside humidity. On the other hand, higher canopy density such as fd, mf and Fb were increased up to maximum of 3% and 4%, respectively. That makes the difference of 1% maximum differences in each tree. The Fb tree species shows the highest relative humidity due to the reduction of air temperature underneath the tree. In fact, the effect is believed to originate from the higher process of water transpired to the air due to the process of evapotranspiration from the trees and ground surface. It also can be noted that the greater effect from the process take place during daytime hours starting from 10:00 and gradually increased to the peaks from 13:00 to 17:00 hours, after which the effect slowly decreased during the night time. It obviously can be seen that the greater effects can be found during the critical hours when the urban air temperature is at the peak. In fact, it is believed that the latent heat production transpires more water from the surface besides the transpiration process during the hottest daytime. It can be observed that each tree contributes to this effect even though each tree densities offer variation towards surrounding humidity. In average, Fb shows the highest average relative humidity increase with 2.21%, follows by mf, fd and ml with 1.54%, 0.99% and 0.98% respectively. The correlation between the relative humidity increase in each tree and the physical properties of each tree densities with R2 of 0.78 is confirmed on Fig. 5. In respect to cluster planting with larger quantity, Fig. 6 shows the relative humidity outline correlates with air temperature reduction pattern where the highest reduction was found when ten trees were added to the site.
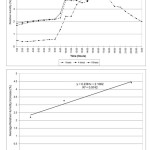 |
Figure 6: Comparison of hourly relative humidity increase for one, four and ten trees in 24-hours period and correlation of average relative humidity and tree quantities of Ficus benjamina tree species Click here to View figure |
Importantly, the greater effect was found for ten trees during the peak hours with the highest increase of 5.3 %. Besides, the same effect was found during the night time where the difference of relative humidity increases between single and additional trees is believed due to the same reason of heat released that reduced the outside humidity. The additional tree quantities of 10 increased relative humidity for about 4.42%. This makes 50% additional increment from a single tree. In contrast to the air temperature, the result shows that the increases of average humidity become larger as more trees are added to the site. This has been confirmed with correlation of the humidity affected to the number of tree quantities with R2 value of 0.97 as presented in Fig. 6.
Absolute Humidity
Literally, the presence of vegetative cooling is effectively determined through measurement of absolute humidity (Kurn et al., 1994; Spangernberg et al., 2008). The range of absolute humidity in four different tree species was found to be at 15.59 to 22.90 g/m3. This correlates with Kurn et al. (1994) findings where the average range of absolute humidity in summer season was in the range of 7.74 to 29.67 g/m3. Thus, the absolute humidity result from the simulation was confirmed based on this verification.
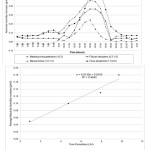 |
Figure 7: Comparison of hourly absolute humidity increase for four different tree species in 24-hours period and Correlation of average increase of absolute humidity and tree densities (LAI) of four different tree species Click here to View figure |
Fig. 7 shows the hourly absolute humidity increase for four different types of tree species during the 24 hours period. It can be observed during the day time that the absolute humidity gradually increased in all four tree species, starting from 10:00 until it reached it peaks at 15:00 to 16:00 and slowly decreased during the night time. The largest increment was found in Fb at 16:00 with magnitude of 0.62 g/m3 follows by mf, fd and ml with 0.46, 0.37 and 0.25 g/m3, respectively. Thus, this explained the variation in relative humidity and evapotranspiration rate in each tree. Obviously, Fb tree species has the higher evapotranspiration rate comparing to the others. This condition allows higher ratio of latent heat flux to sensible heat flux within tree parameter. This condition factor contributes to the causes of largest improvement in air temperature and relative humidity for this tree. Importantly, the physical property of tree creates this condition to be more effective. Fig. 7 explained the absolute humidity condition with density of trees. The moisture content increased as the density increased. The correlation confirmed that the evapotranspiration rate is larger with higher density of trees with R2 value of 0.96. Further to that, the use of more trees with high density of tree such as Fb can create larger moisture content to the urban area. Fig. 8 shows the pattern in absolute humidity with highest increment with magnitude of 0.69 g/m3 in ten trees follows by four and single tree with 0.62 g/m3 for both. This one condition factor will lead to the optimum cooling effect of trees in urban environment. This is further confirmed with correlation result of average absolute humidity with tree densities of R2 value of 0.93 presented in Fig. 8.
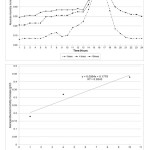 |
Figure 8: Comparison of hourly absolute humidity increase for one, four and ten Ficus benjamina tree in 24-hours period and correlation of average absolute humidity and tree quantities of Ficus benjamina tree species Click here to View figure |
Ground Surface Temperature
 |
|
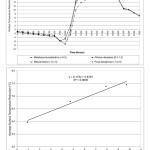
Fig. 9 shows that ground surface temperature differences occurred during the daytime starting from 11:00 and drastically increased until it reached peaks at 15:00 to 17:00 hours then it gradually decreased during the night time. This is believed to be due to the sun angle in this region where the shade is concentrated directly around the canopy starting from 12:00 to 15:00 hours (Shahidan et al., 2010). At this point of time, the shaded area will be nearly correspondent to the planting area due to the solar angle height being close to 90° (Fahmy et al., 2010; Shahidan et al., 2010). In fact, the radiation filtration throughout tree canopy will influence the amount of radiant heat underneath the canopy. This condition leads to the lowering of ground surface temperature compared to the exposed surface and more latent heat fluxes were released. Thus, the ground surface provides more latent heat due to evaporation process. This is one reason why the moisture contents are higher during the daytime. Consequently, the air is less heated, air temperature become lower and relative humidity was increased drastically. However, in referring to the results it can be observed that the performance depends on each individual tree. It can be noted that the effects of surface cooling continued for two hours until it slowly started to decrease. The Fb tree shows the highest reduction at 17:00 with 23.8°C and follows by mf, fd and ml with magnitude differences of 22.6°C, 20.1°C and 19.1°C, respectively. In average, the ground surface temperature reduction for Fb is about 7.45°C, follows by mf, fd, and ml with magnitude of 7.38°C, 6.79°C and 5.97°C, respectively. This again has been proved where the ground surface temperature reduction correlates with tree densities as presented in Fig. 9 with R2 values of 0.97.
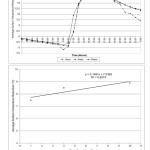 |
Figure 10: Comparison of hourly ground surface temperature reduction for one, four and ten Ficus benjamina tree in 24-hours period and correlation of average ground surface temperature reduction and tree quantities of Ficus benjamina tree species Click here to View figure |
It can be observed that the reduction become larger as more trees were added to the urban environment (Fig. 10). In fact, the densities of trees become optimum and solid as more trees are placed in groups. This condition will remain the lowest ground surface temperature underneath the tree during the day and night time. On average, ten trees can reduce about 8.9°C of surface temperature with significant relationship with R2 values of 0.83 (Fig. 10). These results demonstrate that the more high-density trees added to urban spaces, the amount of evapotranspiration become optimum due to the influence from the lowest ground surface temperature. Thus, this phenomenon becomes another significant factor in evaluating the performance of cooling based on variation in tree density and quantity.
Thermal Radiation Filtration
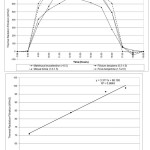 |
Figure 11: Comparison of hourly thermal radiation filtration for four different tree species in daytime period and correlation of average thermal radiation filtration and tree densities (LAI) of four different tree species Click here to View figure |
One reason for surface temperature reduction is due to radiation filtration throughout the canopy. Fig. 11 shows the comparison of hourly thermal radiation filtration for four different tree species from 07:00 to 19:00 hours daytime period. It can be observed that the canopy begin to filter direct radiation from 08:00 to 17:00 hours. Obviously, it can be seen that the highest filtration occurred at 12:00 due to the 90° sun angle that provide solid shade underneath the canopy. Comparing to the other time, the filtration become more effective as the leaves filtered more incoming radiation and small amount was transmitted through shading underneath the canopy. Drastically, this condition will reduce the amount of direct and terrestrial underneath the canopy, thus, less heat was found in compare to the exposed area. Due to this reason, the ground surface absorbed less heat and simultaneously reduced the ground surface temperature underneath the canopy. This explained the condition where the ground surface temperature reduction which is significantly starting to increase during this hour. However, the effects continued until 17:00 hours where the surface temperature reduction was found to be the highest. On average, it was found that trees with highest density correlate with the highest thermal radiation filtration. The Fb tree species was found to be of 98.71% filtration follows by mf, fs and ml with 96.48%, 83.76% and 70.87% filtration, respectively. Fig. 11 shows the relationship with R2 values of 0.95.
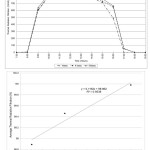 |
Figure 12: Comparison of hourly thermal radiation filtration for one, four and ten Ficus benjamina tree species in 24-hours period species and correlation of average thermal radiation filtration and tree quantities of Ficus benjamina Click here to View figure |
In Fig. 12, the pattern of single, four and ten trees of Fb tree species are the similar, however, the variation on the filtration can be observed after 12:00 as the effect of shading become significant during this hour. In fact, during 16:00 hours the filtration become larger compared to single trees. This pattern correlates to ground surface temperature where the gap difference between tree quantities can be seen starting from 12:00 and reduces slowly at 17:00 as the filtration become lesser when the sun angle at low altitude. During this time the shading is located far away from single trees and the ground surface are exposed to the sun, thus, the ground surface temperature become higher. However, with more high density trees added to the site, larger shaded area can be found and filtration process was occurred during this hour. As a result, lower surface temperature was found at some part of shaded area underneath the canopy. On average, the ten trees’ thermal radiation filtration of Fb is almost 100% and the shading can be considered solid. It is believed that this state of filtration values provides an optimum condition of cooling effect as it influence the reduction of ground surface temperature and the increase of evapotranspiration rate. In fact, these modifications turn out to be another reason of urban air temperature and relative humidity improvement. Fig. 12 explained the relationship of thermal radiation filtration with tree densities with R2 values of 0.95.
Wind Speed
In measuring the absolute cooling effect from trees, the influence of wind was reduced to 1.0 m/s in this simulation study. This condition was created in order to provide almost static wind effect to see the absolute performance on the actual tree cooling effect throughout the 24 hours period. However, in this study the air movement pattern still can be measured by percentage of reduction from the initial simulation input.
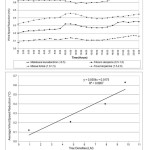 |
Figure 13: Comparison of hourly wind speed reduction for four different tree species in 24 hours period and correlation ofaverage wind speed reduction and tree densities (LAI) of four different tree Click here to View figure |
Fig. 13 shows a similar and constant pattern for each tree species. It can be observed that the highest reduction can be found in Fb tree with 0.69 m/s follows by mf, fd and ml with magnitude differences of 0.46, 0.35 and 0.17 m/s, respectively. In contrast to above results, it is believed that the highest wind speed reduction in Fb create a less impact in cooling distribution due to the large drag force of high density of tree canopy. On average, the reduction of high density trees such as Fb was found to be at 63% reduction and correlation of tree densities and wind speed reduction has been confirmed with R2 values of 0.89 (Fig. 13). However, based on this study results it seems that the wind effect does not affect much on the cooling process as this has been proven from the above section that reduction of air temperature are still considered as significantly higher. Nevertheless, it is believed that the existence of wind movement will help in distributing the tree cooling effect in urban area. On the other hand, trees with high density will reduce the distribution effect but the distribution still can be seen with the less effect. In contrast to high density trees, the loose density trees such as fd and ml provide an average reduction of 12% to 21%, respectively. The loose canopy blocked wind speeds less. However, the effect of cooling and reduction of air temperature were significantly lesser due to the smaller amount of leaves that provide low quality of shading effect and direct radiation filtration. In fact, by having large amount of wind movement the cooling effect of loose density will be decreased due to the immediate effects of mixture of cool air from tree and hot air from the surrounding that carried by high air movement (Dimoudi and Nikolopoulou, 2003). Thus, suffice to say that the wind effect does not help in providing the optimum cooling effect process of trees despite on the effect of cooling distribution in urban area. This correlates with Fahmy et al. (2010) study where he found that the wind speeds did not help in reducing air temperature. It also should be noted in this findings that high tree quantities with tree clusters planting is believed can create drag force of plant canopies where the highest reduction can be found at the end of the day (Fig. 14).
 |
|
However, the reduction of wind speed does not affect much on the tree cooling processes during daytime since the air temperature was found to be lower with higher quantity of high density trees in Ficus benjamina of 7% more reduction. Suffice to say that, wind movement is insignificant in influencing the cooling effect performance of trees due to small changes in other meteorological parameter that are listed in previous findings. Besides, it is worth to point out that by having almost static air movement the optimum cooling effect of tree can be produced effectively due to high density and quantities of trees. Thus, the ambient air temperature can be reduced to optimal level.
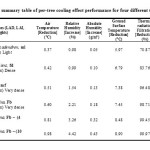 |
Table 3: The summary table of per-tree cooling effect performance for four different tree species Click here to View table |
Discussion and Conclusion
Essentially, the purpose of this paper is to study the individual tree and cluster tree cooling effect performance based on tree physical properties. Table 3 shows the summary of per-tree cooling effect performance for four different tree species. Collectively, it can be confirmed that tree cooling effect performance in each based significantly on tree’s physical properties. Variation of tree densities offers a different performance in tree cooling effect. Based on this condition, each tree have different capability in modifying air temperature, relative humidity, absolute humidity, ground surface temperature, solar radiation and wind. It can be observed that with single high density trees such as Ficus benjamina of LAD classes of 1.5 to 2.0 offers a remarkable modification on microclimate variables compare to other trees. The other trees such as Mesua ferrea, Filicium decipens and Maleleuca leucadendron provide less cooling effect as the tree density become lower, respectively. The high dense of Ficus benjamina offer a significant reduction of 0.6°C of air temperature and 2.21% increases of relative humidity and it was justified due to high filtration of 98.71% that provide high quality of tree shading effect underneath the canopy. Besides, this condition allows ground surface temperature to reduce up to 7.45°C and promotes the evaporation rate that increased the absolute humidity up to 0.18 g/m3. Importantly, the optimum cooling performance can be found during the hottest day time hours approximately at 15:00 hours. Besides, the effect of cooling can be achieved by having lowest air movement. However, it should be noted that the downside by implementing high tree density could create a reduction of 63% of wind speed that possibly influence the air movement in urban area in contrasting to loose density with 40%, 21% and 12% for Mesua ferrea, Filicium decipens and Maleleuca leucadendron, respectively. In providing the optimum cooling effect, the study demonstrates that tree quantities play important role in tree cooling performance. By having larger high density trees at site of urban area offers a better improvement in all microclimate variables, regardless the further reduction of wind effect. However, in the tropics, it can be observed that the improvement was much concerned on the air and surface temperature that could influence the thermal comfort and building’s energy performances. Thus, the improvement of microclimate variables was significantly correlated to larger tree quantities with cluster planting. Overall, the optimum cooling effect can be achieved and influenced by high density trees and large quantities of trees that offer better improvement in air and surface temperature, relative humidity through evaporative cooling, high quality radiation filtration and shading effect to the urban environment. Finally, this essential of knowledge in technical aspects of tree cooling could be useful in modifying urban microclimate variables and reduce the effect of urban heat island from the evaluation of tree physical properties.
References
- Ali-Toudert and Mayer H., 2007a. Thermal comfort in an east-west oriented street canyon in Freiburg (Germany) under hot summer conditions. Theoretical and Applied Climatology, 87, 223-237.
- Ali-Toudert and Mayer H., 2007b. Effects of asymmetry, galleries, overhanging facades and vegetation on thermal comfort in urban street canyons. Solar Energy, 81, 742-754. A
- Ali-Toudert F. and Mayer H., 2006. Numerical study on the effects of aspect ratio and orientation of an urban street canyon on outdoor thermal comfort in hot and dry climate. Building and Environment, 41, 94-108.
- Ali-Toudert F., 2005. Dependence of outdoor thermal comfort on street design in hot and dry climate. Unpublished PhD thesis, University of Freiburg.
- Bourbia P.F. and Mansouri O., 2008. The effect of albedo on urban street microclimate for semi arid climate Constantine. In: World Renewable Energy Congress (WRECX), Glasgow, Scotland.
- Brown, R. D., & Gillespie, T. J., 1995. Microclimate landscape design: creating thermal comfort and energy efficiency. New York: John Wiley & Sons.
- Bruse M., 2009. ENVI-met V3.1, a microclimate urban scale model.envi-met.com (retrieved on 8 January 2009)
- Bruse M., Fleer H., 1998. Simulating surface-plant-air interactions inside urban environments with a three dimensional numerical model. Environmental Modelling Software 13: 373-384.
- Dimoudi, A., and Nikolopoulou, M., 2003. Vegetation in the urban environment: microclimatic analysis and benefits. Energy and Buildings, 35(1), 69-76.
- Fahmy, M., Sharples, S., Yahiya M., 2010. LAI based trees selection for mid latitude urban developments: A microclimate study in Cairo, Egypt, Building and Environment, 1-13.
- Jacobs, A.F.G., Ronda, R.J., Holtslag, A.A.M., 2003. Water vapour and carbon dioxide fluxes over bog vegetation. Agriculture for Meteorology, 116 (1-2): 10312.
- Jonckheere, I., Fleck, S., Nackaerts, K., Muys, B. Coppin, P., Weiss, M., baret, F., 2004. Review of methods for in situ leaf area index determination: part I. Theories, sensors and hemispherical photography. Agriculture for Meteorology, 121 (1-2): 19-35.
- Katzshner L., Bosch U., Roettgen, M., 2004. Thermal Comfort Mapping and Zone, RUROS, Fitfth Frame Work Programme 1998-2000, Key Action 4 “City of Tomorrow and Cultural Heritage” from the programme “ Energy, Environment and Sustainable Development”.
- Konya, A., 1980. Design Primer for Hot Climates. The Architectural Press Ltd., London.
- Kotzen, B., 2003. An Investigation of Shade under Six Different Tree Species of the Negev Desert towards Their Potential Use for Enhancing Micro-climatic Conditions in Landscape Architectural Development. Journal of Arid Environments, 55, 231-274.
- Kurn, D.K., Bretz, S.E., Akbari, H., 1994. The potential for reducing urban air temperatures and energy consumption through vegetative cooling, in: proceedings of the 1994 Summer Study on energy Effects in Buildings, Pacific Grove, California, 1994.
- Lalic, B., Mihailovic, D.T, 2004. An empirical relation describing leaf area density inside the forest for environmental modelling. Journal of Applied Biometeorology, 43, 641- 645.
- Law B.E., Cescatti A., Baaldocchi D.D., 2001. Leaf area distribution and radiative transfer in open-canopy forests: implication for mass and energy exchange. Tree Physiology, 21(12-13:777-87).
- Meir P., Grace J, Miranda A.C., 2000. Photographic method to measure the vertical distribution of leaf area density in forests. Agriculture for Meteorology, 102 (2-3):105-11.
- Montes, F., Pita, P., Rubio, A., Canellas I., 2007. Leaf area index estimation in mountain even-aged Pinus silvestris L. stands from hemispherical photographs. Agriculture for Meteorology, 145 (3-4):215-28.
- Pierce, L., Running, W., 1988. Rapid estimation of coniferous forest leaf area index using a portable integrating radiometer. Ecology, 69(6), 1762-1767.
- Pokorny, J., 2001. Dissipation of solar energy in landscape – controlled by management of water and vegetation. Renewable Energy, 24, 641-645.
- Robinette, G. O. (1972). Plants/People/and Environmental Quality. Washington D.C: U.S. Department of the Interior.
- Scudo, G., 2002. Thermal comfort in green spaces. Paper presented at the Green Structures and urban planning, Milan.
- Shahidan, M.F., Jones, P., 2008. Plant canopy design in modifying urban thermal environment: theory and guidelines. In: The 25th conference on passive and low energy architecture, Dublin.
- Shahidan, M.F., Shariff, M.K.S, Jones, P., Salleh, E., Abdullah, A.M., 2010. A comparison of Mesua ferrea L. and Hura crepitans L. for shade creation and radiation modification in improving thermal comfort. Landscape and Urban Planning, 97, 168-181.
- Sheweka, Samar and Arch, Nourhan Magdy, 2011. The Living Walls as an approach for a healthy urban environment. Energy Proceedia, 6, 592–599.
- Spangernberg J., Shinzato P, Johansson E, Duarte D., 2008. Simulation of the influence of vegetation on microclimate and thermal comfort in the city of Sao Paulo. In: Rev. SBAU, Piracicaba, v.3, n.2, p 1-19.
- Steven, M. D., Biscoe, P. V., Jaggard, K. W., & Paruntu, J., 1986. Foliage cover and radiation interception. Elsevier Science Publishers, 75-87.
- Wilmers, F., 1990/91. Effects of vegetation on urban climate and buildings. Energy and Buildings, 15-16, 507-514.
- Wong N.H. and Yu, C., 2009. Tropical Urban Heat Islands: Climate, buildings and greenery. New York: Taylor and Francis, USA.
- Wong, N. H., Kardinal Jusuf, S., Aung La Win, A., Kyaw Thu, H., Syatia Negara, T., & Xuchao, W., 2007. Environmental study of the impact of greenery in an institutional campus in the tropics. Building and Environment, 42(8), 2949-2970.
- Yoshida, S., Ooka, R., Mochida, A., Murakami, S., Tominaga, Y., 2006. Development of three dimensional plant canopy models for numerical simulation of outdoor thermal environment. In Proceedings: ICUC6 - The 6th Conference on International Climate and Urban Climatology, Sweden.


