Relative Performance of Plant Cultivars Under Respective Water Deficit Adaptation Strategies: A Case Study
Ranjan Das1 , K. Bhagawati2 * , A. Boro1 , T. Medhi1 , B. Medhi1 and R. K. Bhanisana3
1
Assam Agricultural University,
Jorhat,
Assam,
785013
India
2
ICAR Research Complex for NEH Region,
Arunachal Pradesh Centre,
Basar
India
3
Botany and Plant Pathology Department,
Central Agricultural University,
Imphal Manipur,
India
http://dx.doi.org/10.12944/CWE.10.2.36
All the plants exhibit tolerance to stress due to external environmental factors, but with inter-species variation in intensity. The objective of the study was to comparatively evaluate morphological and anatomical modification in different plant cultivars under similar water stress condition and their possible impact on physiological processes affecting their growth performance. The investigation was done in terms of morphological modifications, change in leaf anatomy, water status and productivity. The experiment was done under rainfed condition in northeastern India in three selected cultivars of Gladiolus. All parameters were measured using standard procedures. Stomatal density was found to decrease with water stress with lowest value in cultivar Aarti (122.2 mm-2) while stomatal size (length=7.3µm and breadth=7.00µm) and pore size (3.66µm2) was found to be highest in cultivar Aarti that account for its better photosynthesis rate and growth. The thickness and number of epidermal cells were found to be highest in Aarti that help them to comparatively better amelioration of moisture stress effect. The cultivar Aarti also had higher numbers and size of xylem and phloem that indicate greater unloading of carbohydrate to sink region following increase of sink size. The highest water saturation deficit was found in cultivar Apollo (36.02%) that account for its decline in stomatal conductance, reduction of stomatal size, transpiration and saturation deficit. Comparatively higher leaf area duration (116 days) and net assimilation rate (1.62 g cm-2day-1x10⁻³) of cultivar Aarti attributed to its higher biomass production with larger spike size with good numbers of flowers. The highest marketable spikes (71111.11 per ha) was found in cultivar Aarti which might be due to its comparatively less deviation, during stress condition, from normal morphological and anatomical characteristics. The tolerant cultivars are those that can adapt to the change without much change in their normal growth. And the responses of those species are commercially acceptable that promote adaptation without compromising much with the plant growth and crop production.
Copy the following to cite this article:
Das R, Bhagawati K, Boro A, Medhi T, Medhi B, Bhanisana R. K. Relative Performance of Plant Cultivars Under Respective Water Deficit Adaptation Strategies: A Case Study. Curr World Environ 2015;10(2) DOI:http://dx.doi.org/10.12944/CWE.10.2.36
Copy the following to cite this URL:
Das R, Bhagawati K, Boro A, Medhi T, Medhi B, Bhanisana R. K. Relative Performance of Plant Cultivars Under Respective Water Deficit Adaptation Strategies: A Case Study. Curr World Environ 2015;10(2). Available from: http://www.cwejournal.org/?p=12623
Download article (pdf) Citation Manager Publish History
Introduction
The performance of cultivars of any crop species has interregional variation under a given set of agro-climatic conditions and was estimated to be reduced by 69% on average when plants are exposed to unfavorable environment.1 Out of various environmental factors effecting the crop production and productivity, available water is the most crucial. Water deficit have negative impact on plant growth and reproduction due to its influence on many cellular and whole plant functions.2 The impact of water deficit on plant physiology, morphology and anatomy were well documented.3,4,5,6,7 Influence of water deficit stress can be seen in various levels of plant growth- micro and macro levels,8,9 inhabiting various physiological and biochemical processes including photosynthesis, respiration, translocation, ion uptake, carbohydrates, nutrient metabolism, and hormones.10,11,12,13 The effect of water stress is most severe during growing season and adversely impact crop production.4
Through some physiological, morphological and anatomical modifications, some plants acclimate itself to the stress to permit survival. These responses may promote adaptation or may indicate an occurrence of injury.2 But the actual identification of the suitable mechanisms that promote adaptation to water deficit is a difficult task. All plants respond to water stress due to environmental factors but with varied intensity among the species.14 Under similar environmental conditions, more deviation from their normal characteristics, less tolerant the cultivar is. The tolerant cultivars are those that can adapt to the change without much change in their normal growth. And the responses of those species are commercially acceptable that promote adaptation without compromising much with the plant growth and crop production.
The objective of the study was to comparatively evaluate morphological and anatomical modification in different plant cultivars under similar water stress condition and their possible impact on physiological processes affecting their growth performance. Gladiolus belonging to the family iridiaceae s known as the queen of the bulbous flower and occupies a prominent position in the international flower trade.15 It emerges as an important commercial ornamental crop of northeastern region of India. However, the erratic climate and water deficit during growing seasons cause serious threat its productivity in the region. The experiment was done on three cultivars of gladiolus viz. Aarti, Suchitra and Apollo under rainfed condition of Assam to study their adaptation strategies with respect to strain due to seasonal water stress, and impact on their growth. However, the erratic climate and water deficit during growing seasons cause serious threat its productivity in the region. The investigation was done in terms of: (i) physiological and morphological modifications, (ii) change in leaf anatomy, (iii) water status and (iv) productivity.
Materials and Methods
Experimental Site
The study was conducted in the year 2010-2014 at the horticultural farm of Assam Agricultural University, Jorhat, Assam. The site is located nearly around 26o45’28.34” N and 94o12’35.36” E in the northeastern part of India.
Experimental Layout
The experiment was designed in Randomized Block Design and consisted of three treatments and replicated thrice. The soil was treated initially with application of half dose of nitrogen and full dose of phosphorus and potassium that was calculated for the area under consideration. The crop was top dressed with remaining half dose of N at 45 days after planting (DAP). Well decomposed farm yard manure @ 6 Kg/m2 was applied at the time of land preparation and 10 days prior to planting. Planting of cultivars was carried out in the first week of November 2010. Corms of three cultivars were dehusked. The experimental site was kept weed-free by periodic hand weeding. Regular irrigation was given at an interval of 7 to 8 period only.
Meteorological Parameters
The meteorological data during the period of investigation with monthly averages were taken at the Meteorological Observatory of Assam Agricultural University, Jorhat. The total rainfall during the crop season (November 2011 to April 2012) was 204.5 mm. The rainfall was found to be lowest in the month of December (10.4 mm) and highest in the month March (76.4mm). The month of November had the highest number of rainy days (13 days) and December, January and February (3 respectively) continuously had the lowest number of rainy days. Temperature was at its maximum in the month of April (28.7oC) and minimum at December (11.8oC). Soil moisture content was measured using gravimetric method16 (Table 1).
Table 1: Average monthly meteorological data of growing months during the period of experiment (2010-2014)
|
Month |
Total rainfall (mm) |
Total rainy days per month |
Soil moisture (%) |
|
November |
20 |
13.1 |
23.6 |
|
December |
20 |
2.7 |
21.4 |
|
January |
19.5 |
2.8 |
17.7 |
|
February |
28.2 |
2.6 |
18.2 |
|
March |
78.1 |
10.2 |
24.8 |
|
April |
52.02 |
10.5 |
24.0 |
Measurement of Leaf anatomical parameters
Uppermost fully expanded leaves were detached from five different plants from each cultivar at different stages of growth before 12.00 noon when solar photon flux density (PPFD)~500 mmol m-2s-1. Observations were recorded on various anatomical parameters viz. stomatal and other epidermal cells. For microscopic observation, small sections were made using sharp blade and were stained with 0.5% W/V of saffranine diluted in 50% V/V alcohol. Excess stain was rinsed off with clean water. It was mounted in glycerin and observations were made under microscope. The thickness of palisade, mesophyll and combined epidermal layer were made in terms of micrometer (μm),17 stomata of each surface were counted in 1.85 mm2 microscopic field (100X magnification) on both adaxial and abaxial surface,18 stomata size were estimated by measuring exterior guard cell length and breadth of five stomata per sample using 100X magnification.18 Calculation of stomatal density was done by counting the number of stomata per square millimeter based on the entire leaf surface
Water Status Measurement
Leaf water potential (Ψ) and osmotic potential (Ψπ) were measured using a Wescor HR-33T microvoltmeter (H.R. 33, Wescor Inc.). Measurements (10 replications) were made on leaf disks (0.38 cm2) from 3rd and 4th fully expanded leaf counting from the terminal shoot apex and the potentials were expressed in MPa (Mega Pascals).3 The Relative Water Potential (RWC) was determined following standard procedure.3 Measurement were made on six leaf disks, 1cm in diameter, from the same leaf used for the determination of water potential and kept floating at 4-6 oC on water for around 6 hours in dark room. Using standard bloating paper the disks were dried and turgid weight (TW) was determined and placed in oven for 24 hours at 105oC to dry. The dry weight (DW) was taken afterwards. Following standard formula was used for calculation of RWC:
RWC = {(FW-DW) / (TW-DW)} X 100
And Water Saturation Deficit (SWD%) = 100 -RW
Leaf Area Duration and Net Assimilation Rate
The net accumulation of biomass during the observation period was determined as the difference between initial and final dry matter and expressed as g plant-1 (gram per plants).5 Leaf Area Duration (LAD) is an important indicator as it takes into account, both the duration and extent of photosynthetic tissue of crop canopy. LAD correlates dry matter with Leaf Area Index. LAD is given by:
LAD = {(L1 + L2) / 2} / (t2-t1), where L1 and L2 are initial and final leaf area indices during the observation period (t2-t1).
The Net Assimilation Rate (NAR) expressed in gcm-1day-1 was determined as the ratio of total dry matter during the period and LAD19
Statistical Analysis
Analysis was done using analysis of variance with mean comparison using the Duncan’s Multiple Range Test (DMRT). The values are mean ± standard deviation for all samples. P≤ 0.05 were considered as significant.
Results and Discussions
Stomatal Characteristics
The cultivars under rainfed conditions show wide variations in terms of their different respective stomatal characteristics as shown in Table 2. The highest staomatal density was observed in the cultivar Apollo (148.2 mm-2) and lowest in Aarti (122.2 mm-2) under similar water stress conditions. Maximum stomatal diamension (length and breadth) was found in the cultivar Aarti (7.34µm and 7.00µm), which was comparable with that of Suchitra (6.80µm and 5.83 µm), while the values were found to be signigicantly higher than that of cultivar Apollo (4.42 µm and 3.96 µm respectively). In case of pore size, the maximum pore size (3.66µm2) was recorded in the cultivar Aarti followed by Suchitra (3.00µm2), but significantly higher than Apollo (1.43µm2). Previous studies indicate that generally high positive correlation between water stress and stomatal length and pore size.20,21,22,23 Generally it was observed that CO2 diffusion is facilitated by greater stomatal size,24 because of the fact that the conductance was found to be proportional to the square of the effective radius of the stomatal spore, leading to an increased stomatal conductance level.25 Thus higher stomatal size and pore area facilitate cultivar Aarti to perform well compared to other cultivars under comparable water stress conditions. The stomatal density was found to increase under water deficit condition. This might be a possible adaptation mechanism for limiting water losses through better control of transpiration. This is in accordance with the previous finding that reported an increase of stomatal density under water limitation conditions.26,27,28 Studies indicated negative correlation between photosynthetic rate and stomatal density29 leading to marked reduction in photosynthesis rate under water deficit condition. Stomatal density and stomatal conductance varies proportionally with positive correlation which may increase the water use efficiency, but stomatal conductance was found to be not always closely related to photosynthesis rate.25,30 Reports are also there that under water stress condition the number of stomata per leaf decreases.31
Table 2: Variability of stomatal indices of different cultivars of Gladiolus cultivars under
rainfed condition (per unit area of microscopic field)
|
Cultivars |
No. of Stomatal Cells |
Total Epidermal cells |
Stomatal Density (mm-2) |
Length of stomata (µm) |
Breadth of stomata (µm) |
Pore size of Stomata (µm) |
|
Suchitra |
21.00a |
161.66a |
131.6a |
6.80a |
5.83a |
3.00a |
|
Aarti |
23.33a |
169.00a |
122.2a |
7.34a |
7.00a |
3.66a |
|
Apollo |
12.00b |
78.00b |
148.2b |
4.42b |
3.96b |
1.43b |
|
Mean |
15.44 |
129.55 |
134.00 |
6.18 |
5.59 |
2.69 |
|
SE |
2.80 |
26.03 |
7.60 |
0.89 |
0.88 |
0.66 |
The values with same superscripts (a or b) are not significantly different, while with different superscript are significantly different at p<0.05.
Epidermal Cells
Thickness of upper and lower cuticle, upper and lower epidermis and spongy layer are depicted tabulated in Table 3. The thickness of upper cuticle (12.45µm), upper epidermis (36.89µm) and lower cuticle (9.95µm) were recorded to be the highest in the cultivar Aarti, while these parameters were found to be significantly low in the cultivar Apollo (6.73 µm, 15.78µm and 4.23µm, respectively). Similarly, lower epidermis and spongy cells were significantly higher in cultivar Aarti (29.11µm, 20.89 µm, respectively) as compared to cultivar Apollo (10.45µm, and 11.22µm, respectively). The cultivars under study were varying significantly with respect to the number and size of epidermal cells (Table 1 and 2). Thickness of the leaf layer and palisade cells size were found to be high in the cultivar Aarti (107.98µm and 93.74µm2, respectively) and the minimum in Apollo (48.67 µm and 44. 37µm2, respectively). Number of palisade cells and spongy cells is found to be maximum in Aarti (38.16 and 18.00) and lowest in the cultivar Apollo (18.16 and 8.66). Maximum spongy cells size (167.50 µm2) was recorded in the cultivar Aarti and the least was recorded in Apollo (53.14 µm2) (Table 3). Increase in the palisade and spongy layers with that of epidermal cell layer contributed to the total leaf thickness. The increase in epidermal layer was one of the most important strategies of plant for amelioration of moisture stress effect because the thicker epidermis may reduce the rate of transpiration through the accumulation of cuticular wax. These results were in conformity with that of earlier observations.32,33,34 Moreover, increased thickness of palisade parenchyma could lead to a higher number of CO2 assimilation sites and thus contribute to maintain higher rate of photosynthesis and staomatal conductance.35 Also, previous studies show that thick cuticle and dense cell structure are inherently the modifications possessed by plant cultivars for water conservation.36,37
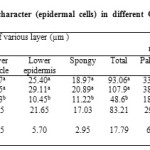 |
Table 3: Variability of anatomical character (epidermal cells) in different Gladiolus cultivars under same stress condition Click here to View table |
Xylem and Phloem
The variation of leaf xylem and phloem number and size of the three cultivars are shown in Table 4. Among the cultivars, leaf xylem and phloem numbers was highest in the cultivar Aarti (15.78 and 17.12 nos. and, respectively) and minimum (8.23 and 10.31 nos.) in cultivar Apollo. The leaf xylem and phloem size was recorded to be highest in cultivar Aarti (38.15μm2 and 77.55 μm2) and lowest in Apollo (24.98 µm2 and 45.47 µm2). The increased radial width of xylem (Meta+proto) and phloem (Meta +proto) indicated more transport of water and nutrient from soil as well as phloem unloading. The proto phloem sieve element solely imports solute for growth.38,33 Meta-phloem functions primarily transport of solute to other developing region of plant.39,40 The increase in the phloem size indicated greater unloading of carbohydrate to sink region following increase of sink size (spike length, spike weight and number of flower in spike). The co-existence of two onto genetically different phloem sieve element types in gladiolus cultivar indicated the possibility of two different transport functions at the same time (a) one may be involved in supplying for the structural development (leaf size, stem girth and root volume) and (b) Another may cater to the need of increased new sinks. Another important consequence of greater phloem size is that it could channelize basipetal movement of the large amount of carbohydrates to the roots leading to the development of more number of corm and cormel with bigger diameter.
LAD, NAR and WSD
There was a significant difference in WSD among the cultivars throughout the growing period (Table 5). Lowest WSD was observed in cultivar Aarti (19.52%) followed by the cultivar Suchitra (24.37%), and were found to be significantly different from cultivar Apollo (36.02%). Maintenance of water status attributed to decline in stomatal conductance, reduction of stomatal size, transpiration and saturation deficit. Cultivars responded differently to rain-fed condition so far as saturation deficit in the crop was concerned. The lowest WSD might have due to the large size of spongy cells. Due to the large spongy layer it may act as a room for large size of vacuole as well as more number of vacuole in this layer and which may help to preserve more amount of water as well as change the osmotic balance inside the cell ultimately maintaining the water potential of the cell and leaf become turgid during growth period. Averaging over all the cultivars, the leaf area duration (LAD) had considerable variations among each other (Table 6). Among the cultivars LAD was highest in cultivar Aarti (116 days) which is significantly higher than that of cultivar Apollo (51 days) (Table 6). NAR had considerable variations among the cultivars, with highest NAR value in cultivar Aarti (1.62 g cm-2day-1x10⁻³), which was found to be statistically comparable with Suchitra cultivar (1.10 g cm-2day-1x10⁻³), but lowest in the cultivar Apollo (0.54 gcm-2day-1 x10⁻³). The decrease in LAD under drought condition is in accordance with previous findings.41,42,43 Also, previous studies indicate that the NAR was relatively lower in drought-stress conditions.44 Increase LAD gave additional advantage to the plant for their development of leaves with large NAR resulting in bolder diameter in corm and large spike with good number of flower. The production of the dry matter or biomasses of any plant are determined by higher value of LAD and NAR.45 As per the previous studies,46 decrease in NAR is indicator of stomatal closure under water stress condition which consequently leads to decline in photosynthesis. It was also observed that the gladiolus cultivar Aarti flowered 4-5 days earlier and sustained flower initiation for longer period (5-6 days) in comparison to other cultivars indicating that the plant has got more time for sink development and utilization for photo assimilates.
Table 4: Variability of leaf xylem and phloem number and size of different Gladiolus cultivars
under rainfed condition at flowering stage
|
Cultivar |
Number |
Size |
||
|
Xylem |
Phloem |
Xylem (µm2) |
Phloem(µm2) |
|
|
Suchitra |
13.33a |
14.23ab |
32.33a |
67.34ab |
|
Aarti |
15.78a |
17.12a |
38.15a |
77.55a |
|
Apollo |
8.23b |
10.31b |
24.98b |
45.47b |
|
Mean |
12.44 |
13.88 |
31.82 |
63.45 |
|
SE |
2.22 |
1.97 |
3.81 |
9.46 |
Table 5: Variability of water potential (WP), osmotic potential (OP) and water saturation deficit (WSD)
in different gladiolus cultivars at different stages of crop growth period under rainfed condition.
|
Cultivar |
WP ( MPa) |
OP ( MPa) |
WSD(%) |
|
Suchitra |
-3.05a |
-1302a |
24.37a |
|
Aarti |
-3.34a |
-1432a |
19.52a |
|
Apollo |
-1.78b |
-1012b |
36.02b |
|
Mean |
-2.72 |
-1248.67 |
26.63 |
|
SE |
0.47 |
124.14 |
4.89 |
Table 6: Variability of leaf area duration (LAD), Net Assimilation Rate (NAR) and Marketable spikes per
hectare in different gladiolus cultivars at different stages of crop growth period under rainfed condition
|
Cultivar |
LAD (Days) |
NAR (g cm-2day-1X10⁻³) |
Marketable spikes ha-1 |
|
Suchitra |
98.00a |
1.10a |
68148.14a |
|
Aarti |
116.00a |
1.62a |
71111.11a |
|
Apollo |
51.00b |
0.54b |
34074.44b |
|
Mean |
88.33 |
1.08 |
57777.89 |
|
SE |
19.37 |
0.31 |
11882.55 |
Marketable Spikes
Significant differences were recorded among the cultivars with respect to marketable spikes (per plant and in hectare area) (Table 6). The maximum number of marketable spikes per hectare area was recorded in the cultivar Aarti (71111.11 spikes/ha) which was statistically comparable with cultivar Suchitra (68148.14 spikes/ha), and were found to be significantly higher than Apollo (34074.44 spikes/ha) (Table 6). Cultivars under present study were varying significantly with respect to the spike length. In a similar type of study, Kamble47 reported that maximum spike length, spike weight, diameter of florets and number of florets per spike in cultivar Summer Sunshine, and cultivar Vedanapali showed maximum spike girth and spike yield per hectare. Accordingly he found a significant variability in terms of these characters in similar condition. Pragya48 also asserted the significant variability among the cultivars of gladiolus in terms of spike length with cultivar Pusa Jyotsna having the longest spike length and cultivar Pusa Jyotsana and Pusa Swarnima recorded maximum number of florets/spike.
Conclusion
The cultivars showed significant differences to rain-fed condition so far as leaf anatomy parameter concerned. These databases on anatomical characterization of gladiolus cultivars in rain fed situation has expected to help in understanding various strategies developed by the plants under the rain fed situation to adjust and adapt in low moisture situation. The cultivar Aarti deviates less from normal characteristics under water deficit condition and performed better compared to cultivar Suchitra and Apollo that deviates comparatively more. So the tolerant varieties must be those that perform well even under water deficit conditions. More adaptive features only do not indicate higher tolerance but the cultivar also must not deviate from its normal growth. Morpho-physiological and anatomical parameters, decreasing osmotic potential in plants with the help of increased non-structural carbohydrates, soluble sugars, secondary metabolite, proline etc. as observed in the present investigation (data not presented). Thus, maintaining higher water status in some cultivar under low moisture conditions there by maintained the yield level.
References
- Boyer, J. S. Science, 218: 443-448. (1982).
- Bray, E. A. Encyclopedia of life sciences. Nature Publishing Group/www.els.net (2001).
- Chartzoulakis, K., A. Patakas, G. Kofidis, A. Bosabalidis and A. Nastau. Scientia Horticulturae, 95:39-50 (2002).
- Jaleel, C.A., P. Manivannan, B. Sankar, A. Kishorekumar, R. Gopi, R. Somasundaram and R. Paneerselvam. Colloids and Surfaces B-Biointerfaces 60: 110-116 (2007)
- Shao, H., L. Chu, C.A. Jaleel and C. Zhao. Comptes Rendus Biologies 331: 215-225 (2008).
- Pompelli, M.F., S.V.V. Martins, E.F. Celin, M.C. Ventrella and F.M. DaMatta. Brazilian Journal of Biology, 4: 1083-1088 (2010).
- Gratani, L., R. Catoni and L. Varone. Botanical Studies 54:35 (2013).
- Colom, M.R. and C. Vazzana. Plant Growth Regulations, 34:195-202 (2001).
- Blumwald, E., G. Anil and G. Allen. New directions for a diverse planet: Proceeding of 4th International Crop Science Congress, 26th September- 1st October 2004, Brisbane, Australia (2004).
- Blum, A. Crop responses to drought and the interpretation of adaptation. Plant Growth Regulations, 20:135-148 (1996).
- Chaitanya, K.V., D. Sundar, P.P. Jutur and A. Ramachandra. Plant Growth Regulations, 40:75-80 (2003).
- Bhatt, R.M. and N.K. Srinivasa Rao. Indian Journal of Plant Physiology, 10:54-59 (2005).
- Jaleel, C.A., P. Manivannan, A. Wahid, M. Farooq, H.J. Al-Juburi, R. Somasundaram and R. Panneerselvam. International Journal of Agriculture and Biology, 11: 100-105 (2009).
- Jaleel, C.A., R. Gopi, B. Sankar, M. Gomathinayagam, M. and R. Panseerselvam. R. Biologies 331:42-47 (2008).
- Bose, T.K. and L.P.Yadav. In: Commercial flowers. (Eds. T. K. Bose and L. P. Yadav). Naya Prakash, Calcutta-7, India (1989).
- Dastane, N.G. A Practical Manual for Water Use Research, Navabharath Prakasan, Poona, India, p. 5 (1967).
- Rahim, M.A. and R. Fordham. Annals of Botany. 67:167-171 (1991).
- Cohen, C.J., D.O. Chilcote and R.V. Frakes. Crop Science, 22 (4); 704-708 (1982).
- Watson, D. J. , Agron., 4, 101 (1952).
- Zakenski and D.G. Clark. An Introduction to Plant Physiology. McGraw Hill, New York, p. 752 (1950).
- Aasamaa, K., A. Sober and M. Rahi. Australian Journal of Plant Physiology, 28:765-774 (2001).
- Yang, H.M. and G.X. Wang. Acta Phytoecologia Sinica, 25:312-316 (2001).
- Zhang, Y.P., Z.M. Wang, Y.C. Wu and X. Zhang. Acta Agronomica Sinica, 32:70-75 (2006).
- Parkhurst, D.F. New Phytologist, 126:449-479 (1994).
- Maherali, H., C.D. Reid, H.W. Polley, H.B. Johnson and R.B. Jachson. Plant, Cell and Environment, 25:556-566 (2002).
- Bosabalidis, A.M. and G. Kofidis. Plant Science, 163:375-379 (2002).
- Xu, Z. and G. Zhou. Journal of Experimental Botany, 59:3317-3325 (2008).
- Laajimi, N.O., O. Boussadia, F.H. Skhiri, F.H., J.A. Teixeria da Silva, S. Rezgui and R. Hellali. Fruit, Vegatable and Cereal Science and Biotechnology, 5:46-51 (2011).
- Meng, L., L. Li, W. Chen, Z. Xu and L. Liu. Journal of Shenyang Agricultural University, 30:477-480 (1999).
- von Caemmerer, S., T, Lawson, K. Oxborough, N.R. Baker, T.J. Andrews and C.A. Raines. Journal of Experimental Botany, 55:1157-1166 (2004).
- Quarries, S.A and H.G. Jones. Journal of Experimental Botany, 28:192-203 (1977).
- Thomas, J.F. and C.N. Harvey. Botanical Gazette, 144:303-309 (1983).
- Das, R. Characterization of responses of Brassica cultivars to elevated CO2 under moisture stress condition. Ph.D. Diss. Indian Agricultural Research Institute, New Delhi (2003).
- Das, R. and P. Kalita. Indian Journal of Plant Physiology, 15: 1, (N.S.) 54-60 (2011).
- Ennajeh, M., A.M. Vadel, H. Cochard and H. Khemira. Journal of Horticultural Science and Biotechnology, 85:289-294 (2010).
- Treshow, M. Environment and plant response. McGraw-Hill Book Company N.Y. St. Louis, San Franscisco, Dusseldort, London, Mexico, Panama, Sydney, Toronto, 421 pp (1970).
- Mooney, H.A. and S.I Gulmon. Environmnetal and Evolutionary constraints on the phosyntheric characteristics of higher plants. In: Solbrig OT, Jonshon GB and Raven PH., (ed) Tropics in Plant population Biology, Columbia University Press, New Work (1979).
- Esau, K. Annals of Botany, 42: 1-13 (1978).
- Hayes, P.M., C.E. Officer and J.W. Patrick. Annals of Botany, 56: 125-138 (1985).
- Wood, R.M. Transfer of photosynthates and potassium in the elongating stem of Phaseolus vulgaris PhD. Diss, University of Newcastle, Australia (1992).
- Thakur, P.S. and H. Kaur. Indian Journal of Plant Physiology, 6:249-253 (2001).
- Shivay, Y.S., R.P. Singh and C.S. Pandey. Indian Journal of Plant Physiology. 7: 126-130 (2002).
- Reddy, A.R., K.V. Chaitanya and M. Vivekananda. Journal of Plant Physiology, 161: 1189-1202 (2004).
- Vyas, S.P., B.K. Garg, S. Kathju and A.N. Lahiri. Indian Journal of Plant Physiology, 6:30-37 (2001).
- Escalante Estrada J., J. Alberto y and Kohashi Shibata. El rendimiento y crecimiento del frijol. Manual para toma de datos. Colegio de Postgraduados (Performance and bean growth, manual data collection. Graduate College). Montecillo. Mpio. De Texcoco Méx. Page 84 (1993).
- Siements, J.A. and J.J. Zwiazek. Plant Science, 165:113-120 (2003).
- Kamble, B.S. Evaluation of gladiolus (Gladiolus hybridus Hort.) varieties, M.Sc. (Hort.) Thesis, University of Agricultural Sciences, Dharwad (2001).
- Pragya, K.V. Bhat, R.L. Misra, and J.K. Ranjan. Indian J. Agril. Sci. 80(9): 766-772 (2010).


