Soil Invertebrates As Bio-Monitors of Toxic Metals Pollution in Impacted Soils
Imaobong I. Udousoro * , I. U. Umoren , J. M. Izuagie , C. U. Ikpo , S. F. Ngeri and E. S. Shai
1
Chemistry Department,
University of Uyo, Uyo,
520001
Akwa Ibom State
Nigeria
http://dx.doi.org/10.12944/CWE.10.2.02
The bio-indicator potentials of two invertebrate species, Eudrilus eugeniae (earthworm) and Pachybolus ligulatus (millipede) in toxic metals impacted soils in Akwa Ibom State, in the Niger Delta region of Nigeria were assessed. The study involved collection of Eudrilus eugeniae and Pachybolus ligulatus, and their site soil samples from different impacted and non-impacted soils in ten locations spread over four Local Government Areas. Toxic metals (Pb, Fe, Zn, Ni and Cd) in soils and in the bio-indicator organisms were analysed using Atomic Absorption Spectrometry, after acid digestion. Geo-accumulation Index (Igeo) was used to measure the extent of soil pollution; Bio-Accumulation Factor (BAF) to compute the metal uptake from soil by bio-indicators; and multivariate statistics to identify interrelationships among metals and the pollution sources. Metals in all soils were higher than the background levels, and were classified as unpolluted to very strongly polluted. Pb, Fe, Zn and Cd were higher in Eudrilus eugeniae, and Ni in Pachybolus ligulatus at 0.05 level. The organisms absorbed all metals (BAF<1), but Eudrilus eugeniae accumulated Cd and Fe and Pachybolus ligulatus, Ni and Fe (BAF>1). Metals were clustered into three (Eudrilus eugeniae) and two (Pachybolus ligulatus) dissimilar groups. Two principal components extracted, each for Eudrilus eugeniae and Pachybolus ligulatus accounted for 64% and 72% of total variations, respectively. The invertebrates exhibited varying levels of affinity in metals uptake. Eudrilus eugeniae appeared to accumulate Pb, Fe and Cd more, and could serve as a better bio-indicator for monitoring these metals. Pachybolus ligulatus accumulated 3-folds more Ni, and could provide a monitoring tool especially in agriculture, in the Niger Delta Region of Nigeria, plagued by crude oil pollution of its land and water bodies.
Copy the following to cite this article:
Udousoro I. I, Umoren I. U, Izuagie J. M, Ikpo C. U, Ngeri S. F, Shaibu E. S. Soil Invertebrates As Bio-Monitors of Toxic Metals Pollution in Impacted Soils. Curr World Environ DOI:http://dx.doi.org/10.12944/CWE.10.2.02
Copy the following to cite this URL:
Udousoro I. I, Umoren I. U, Izuagie J. M, Ikpo C. U, Ngeri S. F, Shaibu E. S. Soil Invertebrates As Bio-Monitors of Toxic Metals Pollution in Impacted Soils. Curr World Environ 2015;10(2). Available from: http://www.cwejournal.org/?p=11626
Download article (pdf) Citation Manager Publish History
Introduction
From the advent of Agricultural to the Industrial revolution, the scale of natural resource exploitation has progressively exerted pressure on the environment, and the signs of ‘weakness’ have become very obvious. Consequently, ‘sustainable development’1, a global concept and panacea, is now in the front burner of all development issues. The concept recognizes the fact that human health and life are inextricably linked to a robust and healthy ecosystem-the soil being an important component. Measurement of the different soil properties or processes provides quality index-indicators that can be used to estimate soil quality; these include visual, physical, chemical and biological processes (micro and macro-organisms, their activities or functions) 2-4.
Terrestrial arthropods (e.g. the diplopods like millipedes) and oligochaetes (e.g. earthworms) are ubiquitous and have great diversity of species. These invertebrates which dwell in the various soil layers and are in contact with the soil and/or litters5, invariably, are affected by deposition of toxic chemicals like metals, organic compounds and other complex substances. Heavy metals have been found to cause reduction in the abundance of soil decomposers, and in the diversity of animal communities6-7.
Heavy metals deposition in terrestrial invertebrates is reported to depend on the extent of environmental pollution5,8-12. Consequently, researchers have used various species of invertebrates including earthworms and millipedes to evaluate contaminated and uncontaminated soils9,13-14. Millipedes, which belong to the class of diplopods, are particularly abundant in the tropics; they are herbivores and predominantly nocturnal. Their importance in recycling of nutrients, aeration and fertilization of soil has been well documented14-19.
The use of terrestrial invertebrates as bio-indicators of soil pollution has however, focused mainly on the toxic metals aspect9,13,18-20. Hopkin21 and Morgan and Morgan22 reported a higher uptake of Cu, Zn and Cd by these organisms from contaminated relative to uncontaminated soils; also, Olayinka et al. 12 recorded higher Pb, Cu, Mn, Zn, Cd and Co around a cement factory compared with the control site. Earthworms from dump site areas in Nigeria have been shown to bio-accumulate high levels of toxic metals11,20,13.
Studies have also been conducted on cytotoxic effects of metals24; the detoxification mechanism25; trait-based approach to depict disturbance impact on soil invertebrate communities26-28 and ecological remediation18,29-31. The histological and histochemical analyses as well as ultrastructural analysis, revealed that chemical substances (both organic and inorganic) are equally toxic to soil invertebrates since the mineralized bodies varied in structural organization within the individual midgut and fat body cells12,14,17.
Most authors have used the earthworms to determine soil health, but information on use of millipedes is scarce; and little or no information is available here in Nigeria despite the abundance of different species of millipedes. The aim of the present study was to compare patterns of metals accumulation in these two invertebrates-earthworms (Eudrilus eugeniae) and millipedes (Pachybolus ligulatus), establish which is a better indicator of soil metal pollution, determine influence of location on bio-accumulation of the toxic metals by indicator organisms, and subject the database to factor analysis to determine the possible source(s) of pollution; also, to establish the similarities and dissimilarities among locations and metals.
Meterials and Methods
Sample collection and preparation of earthworms (Eudrilus eugeniae), millipedes (Pachybolus ligulatus) and soil:
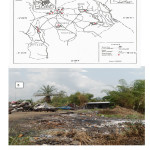
Ten soil samples located in four Local Government Areas (LGAs) in Akwa Ibom State of Nigeria were used for this study. The LGAs were Etinan (around a paint factory, locations 2 and 5), Uyo (the busy state capital, locations 7 [ravine], 6 and 10 [auto-mechanic workshops], 8 [high traffic road] and 9 [agricultural land]), Uruan (an old sea port city, locations 1 and 4) and Ibesikpo (a rural area as control, location 3) (Figure 1).
 |
|
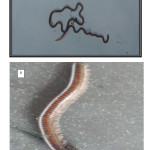
Earthworms (Eudrilus eugeniae) were manually harvested (hand sorted) from soil cores of 100 cm x 100 cm dug to depth of 15 cm with a spade. Each location consisted of four composites in order to obtain enough quantity of Eudrilus eugeniae for analysis. Millipedes (Pachybolus ligulatus) were picked between the leaf litters and surface soil. Eudrilus eugeniae and Pachybolus ligulatus (Figure 2A & B) were thoroughly rinsed with de-ionised water and each composite stored in different transparent rubber bowls lined with wet Whatman No. 1 filter paper, and covered with perforated lid.
 |
|
On reaching the laboratory, Eudrilus eugeniae (soft bobied) and Pachybolus ligulatus (hard bodied) samples were kept in the stored condition for 24 hours, and at laboratory temperature (27oC-30oC) to allow for evacuation of gut content; then oven-dried at 105oC to constant weight. The corresponding soil samples were air-dried at ambient temperature. The dried samples were crushed to fine powder using mortar and pestle, and passed through 0.5 mm sieve.
Determination of metals in Eudrilus eugeniae and Pachybolus ligulatus
To 500 mg of the dried and sieved samples of Eudrilus eugeniae and Pachybolus ligulatus, 5 ml concentrated HNO3 (analar grade Aldrich) was added and kept overnight in Teflon beakers; then heated on a hot plate to near dryness. After cooling, the solution was made up to 25 ml with distilled de-ionised water. Blank solutions were also prepared (without the samples). Metal content was determined using UNICAM 939/959 Atomic Absorption Spectrometer (AAS) for Pb, Zn, Fe, Ni and Cd.
Determination of metals in soils
Five hundred milligrammes of the soil samples were digested with mixture of 15 ml concentrated HNO3:5 ml concentrated HCl mixture in a Teflon beaker. After cooling, the solution was made up to 50 ml with distilled-deionized water. Blank solutions were also prepared and the metal content determined as described above. Soil pH and organic matter were determined using methods by IITA32.
Geological index of soil pollution (Igeo)
This was calculated using geo accumulation index (Igeo) given by
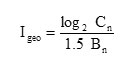
Where = concentration of metal ‘n’ in soil; = background concentration of the metal ‘n’ 33-34; 1.5 = correction factor to take care of possible variations in background values for a given environment as well as small anthropogenic influence.
Igeo was divided into seven classes as by Müller35 as follows: Igeo≤0 (Class 0) - unpolluted; 0geo≤1 (Class 1) - unpolluted to moderately polluted; 1geo≤2 (Class 2) - moderately polluted; 2geo≤3 (Class 3) - moderately polluted to strongly polluted; 3geo≤4 (Class 4) - strongly polluted; 4geo≤5 (Class 5) - strongly polluted to extremely polluted; and Igeo>5 (Class 6) - extremely polluted.
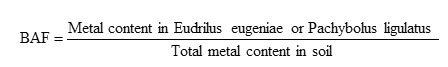
Bio-Accumulation Factor (BAF)
The Bio-Accumulation Factor (BAF) in earthworms and millipedes was calculated using the formula36:
Statistical and data analysis
Statistical analyses were performed using SPSS Version 10, Statgraphies VII and Microsoft Excel. ANOVA was used to evaluate the effect of sample location and LGA on metal content of Eudrilus eugeniae and Pachybolus ligulatus. Factor analysis was performed on the data sets. Principal component analysis (PCA) was carried out using Varimax rotation with Kaiser normalization to determine pollution sources; factor loadings on principal components were classified as strong (>0.75), moderate (0.75-0.50) and weak (0.50-0.30)37. Cluster analysis (CA) performed on the normalized data sets by means of the Ward’s method, using Squared Euclidian distance, was used as a measure of similarity and dissimilarity in patterns of metal accumulation in organisms and soil, and resulted in the dendrogram plots. The analytical quality control measures were the procedural blank measurements, triplicate analysis of indicator organisms and soil samples, and standardization of analytical instruments.
Results
Two types of terrestrial invertebrates namely the soft-bodied earthworms (Eudrilus eugeniae) and hard-bodied amber-banded millipedes (Pachybolus ligulatus), and their corresponding soils were studied in order to determine the suitability of the organisms as bio-indicators of soil pollution in Akwa Ibom State. The results revealed more accumulation of Pb, Fe, Zn and Cd in Eudrilus Eugenia, and Ni in Pachybolus ligulatus.
Metals content in soil at individual locations and Local Government Areas (LGAs)
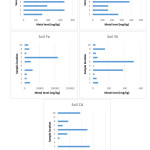
The mean soil metal levels of Pb, Fe, Zn, Ni and Cd in the ten sample locations are presented in Figures 3 and 4, and Table 1; and were in the order Fe>Pb>Zn>Ni>Cd. Analysis of soil samples indicated elevated levels of metals in Uyo (a metropolitan city and State capital with the highest vehicular traffic), the mechanic workshop soil in Uyo and the old sea port city of Uruan. Very high levels (mg/kg) of Pb (735.70), Cd (24.62) and Ni (512.14) in soil were found at location 6 (mechanic village in Uyo). High Pb, Zn and Ni were also obtained around the paint factory (locations 2, 5) and Pb and Cd in location 1 (old sea port) (Figure 3). The highest and lowest mean metal values (mg/kg) in the LGAs were 665.71 (Etinan LGA) and 448.78 (Ibesikpo LGA) for Pb; 32711 (Uyo LGA) and 164.00 (Ibesikpo LGA) for Fe; 381.82 (Etinan LGA) and 196.04 (Uruan) for Zn; 377.10 (Etinan LGA) and 8.19 (Ibesikpo LGA) for Ni; and 18.55 (Uruan LGA) and 1.51 (Etinan LGA) for Cd (Figure 4). Iron (Fe), the most abundant metal had levels in the order: Ibesikpo LGA (control)
 |
|
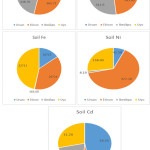 |
Figure 4: Toxic metals in soils from different Click here to View figure |
Geological index of soil pollution (Igeo)
The soil pollution index at each location and LGA are presented in Table 2. The level of soil metal pollution varied from unpolluted to extremely polluted. Table 3 shows the individual locations in the soil pollution classes. Lead (Pb) pollution in soil ranged from class 3 (moderately to strongly polluted) representing 60% of locations-1, 3, 5, 8, 9, 10 and Uruan, Ibesikpo and Uyo LGAs to class 4 (strongly polluted), 40% of the soil locations-2, 4, 6, 7 and Etinan LGA (Table 3). For Fe, 10% of the soil location-5 and Ibesikpo LGA was strongly polluted (class 4), 30% locations-2, 3 and 8 strongly to extremely polluted (class 5) and 60% locations-1, 4, 6, 7, 9, 10 and Uruan, Etinan, and Uyo LGAs extremely polluted (class 6). Soil Zn pollution ranged from class 1 (unpolluted to moderately polluted) in 50% of locations-1, 2, 3, 6, 10 and Uruan LGA to class 2 (moderately polluted) in 50% of locations-4, 5, 7, 8, 9 and Etinan, Ibesikpo and Uyo LGAs. Soil Ni pollution ranged from class 0 (zero) to class 3; 20% of soil locations-3 and 5 were unpolluted (class 0), 50% unpolluted to moderately polluted (class 1, locations 1, 2, 7, 8 and 10), 10% moderately polluted (class 2, location 9) and 20% moderately to strongly polluted (class 3, locations 4, 6). Soils from Ibesikpo LGA were unpolluted with Ni; Uruan LGA revealed unpolluted to moderately polluted; Uyo, moderate pollution and Etinan LGA, strong pollution. For Cd, 20% were unpolluted (class zero, locations 3 and 9), 20% moderately to strongly polluted (class 3, locations 4 and 5), 10% strongly polluted (class 4, location 7), 20% strongly polluted to extremely polluted (class 5, locations 8 and 10) and 30% extremely polluted (class 6, locations 1, 2, and 6). In the LGAs Igeo increased in the following order: Pb, Etinan > Uyo > Uruan > Ibesikpo; Fe, Uyo > Etinan > Uruan >Ibesikpo; Zn, Etinan > Ibesikpo > Uyo > Uruan; Ni, Etinan > Uyo > Uruan > Ibesikpo and Cd, Uruan > Uyo > Ibesikpo > Etinan.
Table1: Summary Statistics of Metals Levels (Mg/Kg) in Soil
|
|
Pb |
Fe |
Zn |
Ni |
Cd |
|
Mean |
505.58 |
22260.30 |
282.43 |
130.32 |
12.12 |
|
Standard Deviation |
168.92 |
31801.00 |
83.64 |
173.25 |
11.53 |
|
Maximum |
735.70 |
109952.00 |
392.76 |
512.06 |
29.00 |
|
Minimum |
259.10 |
164.00 |
160.06 |
8.19 |
0.001 |
|
Median |
480.06 |
13775.50 |
288.76 |
52.20 |
8.35 |
|
Coefficient of Variation |
0.33 |
1.43 |
0.30 |
1.33 |
0.95 |
|
Background Concentration* |
20.00 |
46.00 |
71.00 |
20.00 |
0.098 |
|
Control location (this study) |
385.78 |
7304 |
161.75 |
17.28 |
0.001 |
*Taylor and Mclennan (1995), Lo and Fung (1992)
Table 2: Pollution Index (Igeo) of Soils From Individual Locations and Local Government Areas
|
Pb |
Fe |
Zn |
Ni |
Cd |
|
|
LOCATIONS 1 |
2.32 |
5.56 |
0.92 |
0.77 |
5.28 |
|
2 |
3.10 |
4.60 |
0.41 |
0.41 |
5.20 |
|
3 |
2.55 |
4.66 |
0.42 |
-0.55 |
-4.99 |
|
4 |
3.10 |
5.96 |
1.28 |
2.53 |
2.33 |
|
5 |
2.71 |
3.17 |
1.08 |
-1.30 |
2.06 |
|
6 |
3.20 |
5.68 |
0.85 |
2.84 |
5.12 |
|
7 |
3.09 |
7.37 |
1.21 |
0.68 |
3.29 |
|
8 |
2.62 |
4.42 |
1.30 |
0.20 |
4.08 |
|
9 |
2.16 |
5.40 |
1.07 |
1.62 |
-4.99 |
|
10 |
2.84 |
5.18 |
0.77 |
0.01 |
4.85 |
|
LGA Uruan |
2.72 |
5.05 |
0.61 |
0.35 |
4.84 |
|
Etinan |
3.10 |
5.96 |
1.28 |
2.53 |
2.33 |
|
Ibesikpo |
2.71 |
3.09 |
1.08 |
-1.30 |
4.00 |
|
Uyo |
2.85 |
6.16 |
1.06 |
1.66 |
4.33 |
Table3: Locations In Each Pollution Class
|
Metals |
Pollution Class |
||||||
|
0 |
1 |
2 |
3 |
4 |
5 |
6 |
|
|
Pb |
Locations 1, 3, 5, 8, 9, 10. |
Locations 2, 4, 6, 7. |
|||||
|
Fe |
Location 5. |
Locations 2, 3, 8. |
Locations 1, 4, 6, 7, 9, 10. |
||||
|
Zn |
Locations 1, 2, 3, 6, 10.
|
Locations 4, 5, 7, 8, 9.
|
|||||
|
Ni |
Locations 3, 5. |
Locations 1, 2, 7, 8, 10. |
Locations 9. |
Locations 4, 6. |
|||
|
Cd |
Locations 3, 9. |
Locations 4, 5. |
Locations 7. |
Locations 8, 10. |
Locations 1, 2, 6. |
||
Table4: T-Test (Lsd) Results for Metal Distribution in Eudrilus Eugeniae and Pachybolus Ligulatus from Different Locations
|
Location |
Bio indicator |
Pb |
Fe |
Zn |
Ni |
Cd |
Moisture |
|
1 |
Ee Pl LSD |
4.590a 0.010b 0.134 |
1064.2a 129.2b 2.174 |
129.2a 164.95b 0.9281 |
0.010a 0.010a 0.000 |
0.100a 0.010b 0.0088 |
62.62a 62.40a 0.2356
|
|
2 |
Ee Pl LSD |
29.95a 3.05b 0.0674 |
1303.2a 308.6b 2.0823 |
131.8a 113.7b 0.432 |
0.01a 0.01b 0.00 |
2.50a 0.01b 0.0393 |
60.46a 55.60b 0.3629
|
|
3 |
Ee Pl LSD |
0.01a 0.01a 0.00 |
1565.2a 125.4b 14.08 |
127.5a 98.3b 1.020 |
0.01a 0.01a 0.00 |
0.400a 0.100b 0.0152 |
64.60a 63.46b 0.248
|
|
4 |
Ee Pl LSD |
1.10a 0.10b 0.0393 |
1026.1a 396.6b 2.504 |
110.5a 35.5b 0.6377 |
0.254a 9.00b 0.4128 |
3.15a 0.010b 0.0278 |
76.00a 66.81b 0.3153
|
|
5 |
Ee Pl LSD |
8.90a 14.35b 0.11 |
1696.6a 431.0b 1.6998 |
155.0a 32.15b 1.0435 |
1.00a 9.995b 0.184 |
1.00a 0.010b 0.0633 |
189.4a 59.8a 337.75
|
|
6 |
Ee Pl LSD |
3.25a 0.01b 0.0708 |
1378.2a 562.5b 2.5755 |
141.5a 59.3b 1.7331 |
0.156a 0.010b 0.1088 |
1.96a 0.01b 0.1416 |
56.43a 53.40b 0.3902
|
|
7 |
Ee Pl LSD |
1.25a 8.55 b 0.0576 |
701.2a 365.8b 1.4434 |
94.4a 120.95b 1.0481 |
0.052a 0.010b 0.1166 |
0.01a 0.01a 0.00 |
60.3a 47.8b 0.3539
|
|
8 |
Ee Pl LSD |
0.10a 0.10a 0.00 |
435.1a 83.6b 0.2831 |
35.5a 125.8b 0.8475 |
0.01a 0.01a 0.00 |
0.01a 0.05b 12x10-10 |
65.4a 55.4b 0.2808
|
|
9 |
Ee Pl LSD |
5.60a 9.70b 0.2963 |
1220.6a 649.0b 3.9789 |
149.1a 85.7b 0.3867 |
3.70a 12.6b 0.2261 |
1.50a 0.10b 0.0421 |
60.48a 52.4b 0.5545
|
|
10 |
Ee Pl LSD |
4.50a 0.01b 0.1388 |
1624.4a 507.5b 2.4411 |
118.3a 73.8b 0.1188 |
0.85a 11.90b 0.1188 |
6.89a 0.01b 1.1077 |
53.0a 61.8b 0.4748
|
Means with the same letters are not significantly different; Ee= Eudrilus eugeniae;
Pl=Pachybolus ligulatus; LSD=least significant level
Metals accumulation in potential bio-indicators of soil pollution at different locations
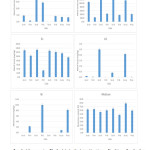
Mean metal levels in Eudrilus eugeniae and Pachybolus ligulatus at the individual locations were significantly different from each other at α=0.05 (Table 4) except for locations 3 and 8 for Pb, 1, 3 and 8 for Ni and 7 for Cd. The highest level (mg/kg) of Pb was found in the paint factory (locations 2 and 5). Pb was generally higher in Eudrilus eugeniae than in Pachybolus ligulatus at all the locations except for locations 5 (paint factory), 7 and 9 (Uyo, a busy city) where Pb was more in Pachybolus ligulatus samples. Eudrilus eugeniae accumulated more Fe (2-24-folds) at all locations than Pachybolus ligulatus (Tables 4 and 5). The paint factory (location 5 in Etinan) followed by mechanic village (location 10 in Uyo) had the highest levels of Fe in Eudrilus eugeniae (Tables 4 and 5). Seventy percent (70%) of the locations recorded higher values of Zn in Eudrilus eugeniae while Pachybolus ligulatus recorded higher levels of Zn at locations 1, 7 and 8 (30%). Ni accumulated much more (greater than 3-folds) in Pachybolus ligulatus, ranging 0.01-12.6 mg/kg, while Eudrilus eugeniae ranged 0.01-3.70 mg/kg. Cadmium (Cd) was much higher in Eudrilus eugeniae (6.89 mg/kg) than in Pachybolus ligulatus (0.10 mg/kg). Lead (Pb), Fe, Zn and Cd levels were higher in Eudrilus eugeniae (feeds on soil), and Ni higher in Pachybolus ligulatus (herbivore, feeds on litters) (Table 5). Moisture content of Eudrilus eugeniae was higher for most locations except location 10 with higher values for Pachybolus ligulatus. However, moisture content in the body of Eudrilus eugeniae (73.25%) though higher than in Pachybolus ligulatus (59.52%), was not significant at α=0.05 (Table 6). The areas of the paint factory, mechanic workshop and Uyo city high vehicular traffic roads had the greatest impact on soil as evidenced in the higher levels of metals in the bio-indicators. ANOVA results indicated a significant influence of location (p<0.0001) on accumulation of metals by the indicator organisms (p<0.0001). Interaction between these two factors were significant at α = 0.05, implying that there are differences in Pb, Fe, Zn, Ni and Cd accumulation pattern of the two indicator organisms, Eudrilus eugeniae and Pachybolus ligulatus. Variations among the LGAs are presented in Figure 5. Cadmium (Cd) in Eudrilus eugeniae and Ni in Pachybolus ligulatus in Etinan and Uyo LGAs were significantly different from those in Ibesikpo Asutan and Uruan LGAs.
Table 5: Locations With Maximum And Minimum Metals Distribution In Bio Indicators
|
Metal |
Bio indicator |
Maximum (mg/kg) |
Location |
Minimum (mg/kg) |
Location |
|
Pb |
Eudrilus eugeniae Pachybolus ligulatus |
21.95 14.35 |
2 5 |
0.01 0.01 |
3, 8 3, 4, 6, 8
|
|
Fe |
Eudrilus eugeniae Pachybolus ligulatus |
1696.6 649 |
5 9 |
435.13 83.60 |
8 8
|
|
Zn |
Eudrilus eugeniae Pachybolus ligulatus |
155.05 164.95 |
5 2 |
35.5 32.5 |
8 5
|
|
Ni |
Eudrilus eugeniae Pachybolus ligulatus |
3.70 12.6 |
9 9 |
0.01 0.01 |
1, 2, 3, 8 1-3, 6, 7, 8
|
|
Cd |
Eudrilus eugeniae Pachybolus ligulatus
|
6.89 0.10 |
10 3 |
0.01 0.1 |
1, 5, 7, 8 1, 2, 4, 5, 6, 7, 9, 10 |
Table 6: Anova-Lsd Results Of Metals In Bio-Indicators At All Locations
|
Bio indicators |
Pb |
Fe |
Zn |
Ni |
Cd |
Moisture content |
|
Eudrilus eugeniae (n=50) Pachybolus ligulatus (n=50) |
5.12a 3.57b |
1201.5a 345.97b |
119.3a 91.03b |
0.61a 4.35b |
1.75a 0.023b |
73.25a 59.52b |
|
LSD |
0.027 |
1.100 |
0.201 |
0.039 |
0.080 |
24.23 |
Means with same letters are not significantly different at α=0.05.
 |
|
Bio-Accumulation Factor (BAF) of metals in Eudrilus eugeniae and Pachybolus ligulatus
Bio-Accumulation Factors (BAFs) are presented in Table 7. Generally, BAFs were <1 for the selected metals in both Eudrilus eugeniae and Pachybolus ligulatus at the different locations, with the exceptions of Fe (1.031) and Cd (2.086) in Eudrilus eugeniae from locations 5 (paint factory) and 4 (a defunct old sea port), respectively; and Ni (1.215) in Pachybolus ligulatus from location 5 (paint factory), showing the impact of locations on metal bio-accumulation in the organisms. At the LGAs, BAF values of Pb, Fe, Zn and Cd in Eudrilus eugeniae were higher than those in Pachybolus ligulatus except for Pb in Ibesikpo LGA; Ni on the other hand was higher in Pachybolus ligulatus in all LGAs except for Ibesikpo (the control LGA/location). BAF>1 was obtained for Fe in both Eudrilus eugeniae (9.543) and Pachybolus ligulatus (2.232) in Ibesikpo LGA, and Cd in Eudrilus eugeniae (1.656) in Etinan LGA. BAF values (mean metal ±SD, range) mg/kg at all locations followed the pattern: Zn (0.480±0.225, 0.09-0.824)> Fe (0.189±0.302, 0.006-1.031)> Cd (0.430±0.740, 0.001-2.086)> Pb (0.038±0.102, 2.4E-05-0328)> Ni (0.017±0.035, 1.5E-04-0.112) for Eudrilus eugeniae, and Zn (0.362±0.214, 0.093-0.710)> Ni (0.172±0.386, 2.0E-05-1.215)> Fe (0.048±0.076, 0.003-0.262)> Pb (0.009±0.014, 1.4E-05-0.037)> Cd (0.013±0.031, 3.4E-4-0.100) for Pachybolus ligulatus.
Table 7: Bio-Accumulation Factor (Baf) Of Metals At Different Locations and Lgas
|
|
Pb |
Fe |
Zn |
Ni |
Cd |
|||||
|
BAF- Ee |
BAF-Pl |
BAF-Ee |
BAF-Pl |
BAF- Ee |
BAF-Pl |
BAF- Ee |
BAF-Pl |
BAF- Ee |
BAF-Pl |
|
|
Locations |
||||||||||
|
I |
0.016 |
3.3E-05 |
0.059 |
0.007 |
0.485 |
0.619 |
1.5E-04 |
1.5E-04 |
0.003 |
3.4E-04 |
|
2 |
0.328 |
0.005 |
0.190 |
0.045 |
0.824 |
0.710 |
2.2E-04 |
2.2E-04 |
0.094 |
3.8E-04 |
|
3 |
2.6E-05 |
2.6E-05 |
0.214 |
0.017 |
0.789 |
0.608 |
5.8E-04 |
5.8E-04 |
0.040 |
0.100 |
|
4 |
0.002 |
1.5E-05 |
0.038 |
0.015 |
0.289 |
0.093 |
6.7E-04 |
0.025 |
2.086 |
0.007 |
|
5 |
0.020 |
0.032 |
1.031 |
0.262 |
0.496 |
0.103 |
0.112 |
1.215 |
0.125 |
0.001 |
|
6 |
0.004 |
1.4E-05 |
0.068 |
0.028 |
0.568 |
0.238 |
3.1E-04 |
2.0E-05 |
0.08 |
4.1E-04 |
|
7 |
0.002 |
0.013 |
0.006 |
0.003 |
0.264 |
0.339 |
8.8E-04 |
1.7E-04 |
0.003 |
0.003 |
|
8 |
2.4E-05 |
2.4E-05 |
0.076 |
0.015 |
0.090 |
0.320 |
2.7E-04 |
2.7E-04 |
0.001 |
0.006 |
|
9 |
0.002 |
0.037 |
0.08 |
0.042 |
0.479 |
0.276 |
0.024 |
0.083 |
1.50 |
0.010 |
|
10 |
0.009 |
2.0E-05 |
0.132 |
0.041 |
0.512 |
0.319 |
0.028 |
0.394 |
0.368 |
5.3E-04 |
|
Mean |
0.038 |
0.009 |
0.189 |
0.048 |
0.480 |
0.362 |
0.017 |
0.172 |
0.430 |
0.013 |
|
SD |
0.102 |
0.014 |
0.302 |
0.076 |
0.225 |
0.214 |
0.035 |
0.386 |
0.740 |
0.031 |
|
Min |
2.4E-05 |
1.4 E-05 |
0.006 |
0.003 |
0.09 |
0.093 |
1.5 E-04 |
2.0 E-05 |
0.001 |
3.4E-04 |
|
Max |
0.328 |
0.037 |
1.031 |
0.262 |
0.824 |
0.710 |
0.112 |
1.215 |
2.086 |
0.100 |
|
Median |
0.003 |
3.0E-05 |
0.078 |
0.022 |
0.490 |
0.319 |
6.2E-04 |
4.2E-04 |
0.087 |
0.002 |
|
CV |
2.66 |
1.63 |
1.59 |
1.61 |
0.47 |
0.59 |
2.10 |
2.24 |
1.72 |
2.39 |
|
Local Government Areas (LGAs) |
||||||||||
|
Uruan |
0.01 |
0.002 |
0.099 |
0.022 |
0.659 |
0.526 |
2.3E-04 |
0.053 |
0.005 |
0.002 |
|
Etinan |
0.323 |
0.001 |
0.049 |
0.009 |
0.343 |
0.27 |
2.6E-05 |
0.006 |
1.656 |
0.021 |
|
Ibesikpo |
2.2E-05 |
0.01 |
9.543 |
2.232 |
0.409 |
0.387 |
0.001 |
0.001 |
0.950 |
0.001 |
|
Uyo |
0.007 |
0.006 |
0.035 |
0.013 |
0.373 |
0.308 |
0.005 |
0.052 |
0.185 |
0.002 |
|
Mean |
0.085 |
0.005 |
2.431 |
0.569 |
0.446 |
0.373 |
0.002 |
0.028 |
0.699 |
0.006 |
|
SD |
0.158 |
0.004 |
4.741 |
1.108 |
0.144 |
0.113 |
0.002 |
0.028 |
0.758 |
0.009 |
|
Min |
2.2E-05 |
0.001 |
0.035 |
0.009 |
0.343 |
0.27 |
2.6 E-05 |
0.001 |
0.005 |
0.001 |
|
Max |
0.323 |
0.010 |
9.543 |
2.232 |
0.659 |
0.526 |
0.005 |
0.053 |
1.656 |
0.021 |
|
Median |
0.008 |
0.004 |
0.074 |
0.017 |
0.391 |
0.347 |
0.0006 |
0.029 |
0.567 |
0.002 |
|
CV |
1.86 |
0.86 |
1.94 |
1.94 |
0.32 |
0.30 |
1.48 |
1.01 |
1.08 |
1.48 |
Ee= Eudrilus eugeniae Pl=Pachybolus ligulatus
Factor Analysis
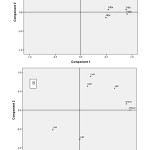
Principal Component Analysis (PCA) of metals in Eudrilus eugeniae and Pachybolus ligulatus after Varimax rotation with Kaiser normalization resulted in the extraction of two Principal Components (PCs), each of which was used in interpreting the sources of pollution of the indicator organisms and the corresponding soil. PCs with Eigen values >1 are considered significant38. Table 8 shows the variance explained by the PCs for metals in Eudrilus eugeniae and Pachybolus ligulatus. Two PCs obtained with Eigen values >1 explained more than 64.116% of the total variance of metals in Eudrilus eugeniae. PC1 and PC2 accounted for 34.212% and 29.904% of variation, respectively. PC1 showed strong positive factor loading on Fe and Zn, and moderate positive factor loading on Cd; while PC2 showed strong positive factor loading on soil organic matter and soil pH, and moderate positive factor loading on Pb (Figure 6A). On the other hand, two PCs with Eigen values >1 obtained for metals in Pachybolus ligulatus, explained 71.863% of the total variance with PC1 accounting for 37.558% of the variance, and PC2 34.304%. PC1 showed strong positive factor loading on Ni, soil pH and soil organic matter (OM); and PC2 strong positive factor loading on Pb and Fe, and strong negative factor loading on Cd (Figure 6B).
 |
|
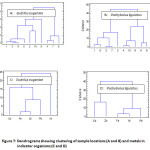
Cluster analysis (CA) performed on Eudrilus eugeniae and Pachybolus ligulatus data sets grouped similar sampling sites (spatial variability) in the ten locations across the four Local Government Areas (LGAs) (Figures 7A and B), and the variables (metals) within the bio-indicators (Figures 7C and D). The spatial variability, that is, similarity and dissimilarity between locations where bio-indicators were collected, showed four clusters for Eudrilus eugeniae and three for Pachybolus ligulatus. For Eudrilus eugeniae data set, cluster one was made of locations 1, 3, 6 and 5; cluster two, locations 2 and 10; cluster three, location 9 only; and cluster four contained locations 4, 7 and 8 (Figure 7A). Pachybolus ligulatus data set contained in cluster one, locations 1, 8, 2, 7 and 3; Cluster two, locations 4, 10 and 6; and cluster three, locations 5 and 9 (Figure 7B). Cluster one had more locations in both dendrograms. Metals in bio-indicator organisms showed three clusters for Eudrilus eugeniae: Cluster one with Cd only, cluster two had Fe, Zn and Pb and cluster three Ni only (Figure 7C). For Pachybolus ligulatus, two clusters emerged: Cluster one contained Cd and Zn and cluster two, Fe, Ni and Pb (Figure 7D).
 |
|
Pearson’s product moment correlations between significant pairs of variables at α = 0.05 were: Fe/Zn in Eudrilus eugeniae (r = 0.8160, P = 0.0040); Cd in Eudrilus eugeniae/soil organic matter (r = 0.6646, P = 0.0360); and Fe/Ni (r = 0.6639, P = 0.0363) in Pachybolus ligulatus. Positive correlations were found between Fe in Pachybolus ligulatus/Ni in Eudrilus eugeniae (r = 0.6586, P = 0.0384); and Ni in Eudrilus eugeniae/Ni in Pachybolus ligulatus (r = 0.7258, P = 0.0175). Soil organic matter correlated positively with soil pH (r = 0.8800, P = 0.0008); Zn in soil correlated negatively with Fe in Eudrilus eugeniae (r = -0.672, P = 0.0330); while Ni in soil correlated positively with Fe in soil (r = 0.7580, P = 0.0110).
Discussion
The soil ecosystem is in equilibrium between its abiotic and biotic components; any change in one adversely affects the other14, 26,39,40. Toxic metals on release into the soil (the ultimate sink of pollutants) disrupt this equilibrium. Their accumulation in soils is as a result of anthropogenic activities-from rapid industrialization, agriculture and urbanization.
The mean soil metal (Zn, Pb, Cd, Ni, and Fe) levels in the study areas were higher than the background levels33-34. High levels were especially recorded in the urban city of Uyo (with higher vehicular emissions), the mechanic workshops and the paint factory. This confirms reports by previous researchers5,41-43 that most areas near busy cities, industries and road systems have high concentration of toxic metals. Heavy metals may persist in the soil for up to a hundred decades; and can directly pollute soil and endanger the ecosystem by availability to flora and fauna, transfer to food chain and contamination of surface and ground water26,39,40,44,45. Soil characteristics such as pH and organic matter content affect the heavy metals adsorbed in soil46. According to Souza et al. 47, decreasing the pH made available metals that were strongly adsorbed in organic matter of the soil. Trace elements are generally more solubilized in acid soil conditions. The present study revealed high positive correlations between soil organic matter and/soil pH (r = 0.8800); also, between soil Zn/Fe (r = 0.7580), Cd in Eudrilus eugeniae/soil organic matter (r = 0.6646, P = 0.0360). The total soil Pb and Cd were higher than values reported by Olayinka et al.12 and Iorungwa et al.48 from a cement factory area and waste dump site in a mechanic village, respectively both in Nigeria, and Spurgeon and Hopkin13 in a smelter plant area in the UK; but lower than from a mine in the UK13. Fe had values higher than reported by Iorungwa et al.48; Cd was higher than values reported in soil from a smelter plant but lower than from a mine, both in the UK13 (Table 9).
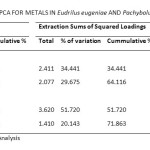 |
Table 8: Total Variance Explained By Pca for Metals in Eudrilus Eugeniae and Pachybolus Ligulatus Click here to View table |
Igeo values for Pb, Fe, Zn, Ni and Cd metals in soil were generally higher in soils around the paint factory and Uyo (a metropolitan city). The study areas soil quality varied from strongly polluted (soils from the paint factory, auto-mechanic village, and high traffic areas) to unpolluted (in the control). Qingjie et al.35 reported soil quality varying from polluted to unpolluted in Beijing Parks, from the center to the outskirts of Beijing City (Table 9).
Table 9: Comparison Of Metals Levels (Mg/Kg) In Impacted Soils With The Present Study
|
Pb |
Fe |
Zn |
Ni |
Cd |
Sites |
|
27.8 - 82.3 |
- |
60.4 - 110.6 |
- |
- |
Beijing parks, China35 |
|
7.85 - 50.32 |
- |
14.3 - 107.2 |
- |
2.82 - 10.35 |
Cement factory, Ewekoro, Nigeria12 |
|
38.0 - 120.0 |
0.28 - 4.10 |
35.0 - 112.0 |
- |
0.01 - 3.00 |
Mechanic village, Makurdi, Nigeria48 |
|
21.83 ± 1.82 |
- |
31.48 ± 2.28 |
- |
0.05 ± 0.02 |
Clean (campus)- Control, UK13 |
|
291 ± 54 |
- |
408 ± 22 |
- |
5.93 ± 0.24 |
Smelter (Hallen Hull) UK13 |
|
10,200 ± 690 |
- |
6,050 ± 416 |
- |
60.8 ± 3.1 |
Mine (Shipham) UK13 |
|
259 - 736 |
164 - 109952 |
160 - 393 |
17.28 - 512 |
0.001 - 29.00 |
This study |
Regular exposure of soil invertebrates to metals in the superficial layers of soil causes them to accumulate metals in their tissues49, hence the organisms can be used for monitoring soil pollution. Heikens et al.49, further reported that the concentration of metals in terrestrial invertebrates were in the order Pb > Cd > Cu; which is closely similar to the trend observed in this study with Eudrilus eugeniae (Pb > Cd). Our results also, are in line with findings that earthworms in impacted areas-near road sides, factories, mechanic villages and recreational areas agro-ecosystem and dump sites areas accumulate much more metals11-13,19,23,35,48 (Table 10). The variation in metals levels in the two organisms may be due to factors including pathway of metal uptake-dermal and/or oral, the body composition/metabolism and feeding habit50. Diplopods have been reported to metabolize and/or accumulate various types of metal ions in the midgut, and the fat body8 which is distributed throughout the body cavities. Accumulation of more Pb, Fe, Zn and Cd in Eudrilus eugeniae tissues than Pachybolus ligulatus may be explained in their feeding habits. Pachybolus ligulatus species are herbivores and live between the soil surface and litters, feeding mainly on decayed plants materials very rich in organic matter, while Eudrilus eugeniae species are burrow animals that feed on soil particles with lesser organic matter down the soil profile. Soil being a sink for pollutants, could be responsible for the higher concentrations of metals in earthworms (Eudrilus eugeniae) than in millipedes (Pachybolus ligulatus).
Bio-accumulation in terrestrial invertebrates often has been the sum of the metals adsorbed to the body wall and absorbed into the body. However, Vijver et al.51, in their work on earthworm and isopod reported that adsorption of Cd and Zn to surface of the organisms were negligible. They further showed that the metal uptake levels in the organisms were mainly the internalised metals with little or no external component; contrary to previous report52. Issues of variation and/or affinity of metals therefore could reside in the internal mechanisms/processes of the organism. The highest concentration of Cd (6.89mg/kg) in Eudrilus eugeniae compared with 0.10 mg/kg in Pachybolus ligulatus may result from its localization in the chloragogenous tissue9,50 which is unique to oligochaetes, and has a function in metal storage and trafficking53; and essential metals e.g. Zn when involved, also function as buffer for the coelomic fluid and blood. On the other hand, for arthropods, the hepatopancreas appears to be the most important storage organ for metals. The hepatopancreas is packed with different types of granules like the chloragogenous tissue in earthworms. Metals are precipitated in different chemical forms in these granules21,54. The binding chemicals of the hepatopancreas in millipedes may have more affinity for Ni (12.60mg/l) than the chloragogenous tissue of earthworms (3.70 mg/l), hence the higher concentration of Ni in Pachybolus ligulatus than Eudrilus eugeniae. Other factors that could influence uptake of metals in the bio-indicators include the solubility of the soil metal bearing mineral41,55. The higher the solubility, the higher the accumulation of metals in invertebrates. This study revealed high positive correlations between soil organic matter/soil pH (r = 0.8800); also, between Cd in Eudrilus eugeniae/soil organic matter (r = 0.6646). Another important factor in bio-accumulation of metals in terrestrial invertebrates is their ability to eliminate/excrete excess of metals. For the xenobiotic metals e.g. Cd and Pb, it is reported that the excretion is slow or absent9, which could also be responsible for higher accumulation of Pb, Cd in Eudrilus eugeniae and Ni in Pachybolus ligulatus.
Soils, and consequently the indicator organisms are impacted by activities of the paint factory, auto-mechanic workshop and the municipal city. PCA revealed that for Eudrilus eugeniae Eigen values >1 obtained explained more than 64.116% of the total variation of metals. PC1 showed strong positive factor loading on Fe and Zn, and moderate positive factor loading on Cd; and PC2, strong positive factor loading on soil organic matter and soil pH, and moderate positive factor loading on Pb. For metals in Pachybolus ligulatus, PC1 accounted for 37.558% of the total variation and showed strong positive factor loading on Ni, soil organic matter (OM) and soil pH; which could also explain the preferential accumulation of organically bound metal (Ni) by Pachybolus ligulatus while Eudrilus eugeniae appears to be indicator for the inorganic species of metals. On the other hand, PC2 explained 34.304% of the total variation, with strong positive factor loading on Pb and Fe; and strong negative factor loading on Cd. These suggest anthropogenic input of metals from waste from the paint factory, mechanic workshop, agricultural activities, decomposed organic wastes and acid precipitation.
Table10: Accumulation (MG/KG) in Bio-Indicators with the Present Study Comparisms Of Metals
|
Pb |
Fe |
Zn |
Ni |
Cd |
Sites (bio-indicator) |
|
10.07 - 25.13 |
- |
42.45 - 216.9 |
- |
7.67 - 21.89 |
Cement factory, Ewekoro Nigeria (Eudrilus eugeniae)12 |
|
0.0081 - 0.0327 |
0.0052 - 0.9899 |
0.0336 - 0.0746 |
- |
0.01 0.045 |
Dumpsite, Zaria, Nigeria (Lumbricus terrestris)23 |
|
0.0025 - 0.0689 |
0.015 - 0.8985 |
0.0070 - 0.0489 |
- |
0.0001 - 0.0410 |
Dumpsite, Kaduna, Nigeria (Lumbricus terrestris)23 |
|
0.0017 |
- |
1.07 |
- |
0.0009 |
Groundnut field, India (Earthworms)19 |
|
0.0011 |
- |
1.76 |
- |
0.0011 |
Sugar cane field, India (Earthworms) 19 |
|
0.0002 |
- |
- |
- |
0.0012 |
Paddy field, India (Earthworms) 19 |
|
5.01 - 265.4 |
- |
105.8 - 380.9 |
- |
0.55 - 8.13 |
Dump sites Zaria, Nigeria (Lumbricus terrestris)11 |
|
0.01 - 21.95 |
435.1 - 1697 |
35.5 - 155.0 |
0.01 - 3.70 |
0.01 - 6.89 |
This Study (Eudrilus eugeniae) |
|
0.01 - 14.35 |
83.6 - 649 |
32.15 - 164.95 |
0.01 - 12.60 |
0.01 - 0.10 |
This Study (Pachybolus ligulatus) |
Conclusion
The invertebrates exhibited (preferential) levels of affinity in metals uptake. Eudrilus eugeniae (soil feeder) appears to accumulate the inorganic metals species - Pb, Fe and Cd more, and could serve as bio-indicator of these metals; while millipede (decayed litter feeder) accumulated 3-folds more Ni (organically bound metal), thus presenting the organism as a suitable indicator of Ni-polluted soils. The endowment of Pachybolus ligulatus for accumulation of nickel makes the invertebrate both suitable and choice bio-indicator of crude oil pollution. This could provide a monitoring tool for agriculture in the Niger Delta, a region of Nigeria that is plagued by decades-long oil pollution of its water bodies and land.
We are of the opinion that despite other possible factors, preference in metals uptake/storage in the organisms may reside largely at the level of the chloragogenous and hepatopancreas tissues of the earthworm (Eudrilus eugeniae) and millipede (Pachybolus ligulatus), respectively. A more detailed research on the affinity of the tissues for metals would be required.
In the overall, the activities in the areas studied clearly contributed to the pollution of locations.
Acknowledgments
The authors thank the technical Staff of Soil Science Department, Faculty of Agriculture, University of Uyo, Uyo, Nigeria, for their help with analytical work. Identification of our bio-monitors were provided by Dr. Jude Obi of the Department of Soil Science, University of Uyo, Uyo and Dr. Esther Oden of Zoology Department, University of Calabar, Cross River State, Nigeria. Finally we are thankful to the anonymous reviewers and the editor for their valuable contributions.
References
- WCED (United Nations Conference on Environment and Development). Our Common Future, Chapter 2: Towards Sustainable Development. (1987). Retrieved December 15, 2014, from www.un-documents.net/ocf-02.htm
- Karlen, D., Mausbach, M., Doran, J., Cline, R., Harris, R., and Schuman, G. Soil Sci. Soc. Am. J., 61, 4-10 (1997).
- Breure, A. Soil Biodiversity: Measurements, Indicators, Threats and Soil Functions. 1 International Conference SOIL AND COMPOST ECO-BIOLOGY, September 15th-17th 2004 (pp. 83-96). Leon-Spain: soilACE, (2004).
- Martinez-Salgado, M., Gutierrez-Romero, V., Jammsens, M., & Ortega-Blu, R. Current Research, Technology and Education Topics in Applied Microbiology and microbial Biotechnology, 1, 319-328 (2010).
- Paoletti, M. G. , Ecosystems and Environ., 74, 137-155 (1999).
- Haimi, J., and Siira-Pietikainen, A. J. Anal. Chem., 354, 672-675 (1996).
- Grelle, C., Fabre, M., Lepretre, A., and Descamps, M. J. Soil Sci., 51, 425-433 (2000).
- KÓ§hler, H., Kortje, K., and Alberti, G. Biometals, 8, 37-46 (1995).
- Spurgeon, D., and Hopkin, S. Soil Ecol., 11, 227-243 (1999).
- Nakamura, K., Taira, J., and Higa, Y. Entomol. Zool., 40, 283-288 (2005).
- Uba, S., Uzairu, A., and Okunola, O. J. Environ. Res., 3(3), 353-358 (2009).
- Olayinka, O., Idowu, A., Dedeke, G., Akinloye, O., Ademolu, K., and Bmagbola, A. Proceedings of the Environmental Management Conference, Federal University of Agriculture, Abeokuta, Nigeria, pp. 489-496. (2011). Retrieved from http://www.unaab.edu.ng
- Spurgeon, D., and Hopkin, S. Environ. Contam. Toxicol., 37, 332-337 (1999).
- Fontanetti, C., Nogarol, L., de Souza, R., Perez, D., and Maziviero, G. Bioindicators and Biomarkers in the Assessment of Soil Toxicity: Soil Contamination. (M. S. Pascucci, Ed.) InTech. (2011). Retrieved from http://www.intechopen.com/books/soil-contamination/bioindicators-and-biomarkers-in-the-assessment-of-soil-toxicity
- Dengerfield, Pedobiologia, 37, 159-166 (1993).
- Wolters, V. Fertility Soils, 31, 1-19 (2000).
- Fontanetti, C., Tiritan, B., and Camargo-Mathia, M. J. Morphol. Sci., 23(3-4), 487-493 (2006).
- Haeba, M., Kuta, J., Arhouma, Z., and Elwerfalli, H. Anal. Toxicol., 3(6), 189-191 (2013).
- Vinoth, A., Kalaivani, R., and Selvasundaram, R. J. Current Microbiol. Appl. Sci., 3(7), 745-748 (2014).
- Bamgbose, O., Odukoya, O., and Arowolo, T. Biol. Trop., 48(1), 229-234 (2000).
- Hopkin, S., and Martin, M. Oecologia, 54, 227-232(1982).
- Morgan, J., and Morgan, A. Soil Biol. Biochem., 24, 1691-1697 (1992).
- Elaigwu, S., Ajibola, V., and Falaranmi, F. J. Environ. Sci., 1(5), 244-250 (2007).
- Odendaal, J., and Reinecke, A. Environ. Safety, 56(2), 319-325 (2003).
- KÓ§hler, H., and Triebskorn, R. Biomarkers, 3(2), 109-217 (1998).
- Hedde, M., van Oort, F., and Lamy, I. Pollut., 164, 59-65 (2012).
- Decaëns, T., Margerie, P., Aubert, M., Hedde, M., and Bureau, F. Soil Ecol., 39, 321-335 (2008).
- Giovanetti, A., Fesenko, S., Cozzella, M., Asencio, L., and Sansone, U. Environ. Radioact., 101, 509-516 (2010).
- Gao, Y., and Luo, Y. Acta Pedologica Sinica, 42(1), 140-148 (2005).
- Snyder, B., and Hendrix, P. Restoration Ecol., 16(4), 629-636 (2008).
- Ameh, A., Mohammed-Dabo, I., Ibrahim, S., Ameh, J., Azienge, C., and Tanimu, Y. J. Biol. Chem. Sci., 5(3), 923-929 (2011).
- IITA (International Institute for Tropical Agriculture). (1981). Manual Series. No. 7. Ibadan: International Institute for Tropical Agriculture .
- Taylor, S., and McLennan, S. Geophy., 33, 241-265 (1995).
- Lo, C., and Fung, Y. Water Res., 26(12), 1605-1619 . (1992).
- Qingjie, G., Jun, D., Yunchuan, X., Qingfie, W., and Liqiang, Y. China Univ. Geosci., 19(3), 230-241 (2008).
- Cortet, J., Vauflery, A., Balaguer, N., Gomot, L., Texier, C., and Cluzaeu, D. J. Soil Biol., 35, 115-134 (1999).
- Liu, C., Lin, K., and Kuo, Y. Total Environ., 313(1-3), 77-89 (2003).
- Juahir, H., Zain, S., Khan, R., Yussoff, M., Mokhtar, M., and Toriman, M. Maejo Intl. J. Sci.Technol., 3(01), 26-42 (2009).
- Nahmani, J., and Lavelle, P. J. Soil Biol., 38, 297-300 (2002).
- Banat, K., Howari, F., and Al-Hamada, A. Res., 97, 258-273 (2005).
- Alloway, B. Heavy Metal in Soils (2nd ed.). (B. Alloway, Ed.) New York, London: Blackie Academic and Professional (1995).
- Umoren, I., Udoh, A., and Udousoro, I. Environmentalist, 27, 241-252 (2007).
- Umoren, I., and Udousoro, I. Environmentalist, 29, 280-286 (2009).
- Pekey, H., Karakas, D., Ayberk, S., Leyla, T., and Bakoglu, M. Pollut. Bull., 48, 946-953 (2004).
- Ali, M., and Al-Qahtani, K. Egyptian J. Aqua. Res., 38, 31-37 (2012).
- Jones, K. Pollut., 69(4), 311-326 (1991).
- Souza, T., Hencklein, F., Angelis, D., Goncalves, R., and Fontanetti, C. Environ. Safety, 72, 1363-1368 (2009).
- Iorungwa, M., Wuana, R., and Yiase, S. J. Sci.Technol., 2(4), 320-325 (2013).
- Heikens, A., Peijnenburg, W., and Hendriks, A. Pollut., 113(3), 385-393 (2001).
- Morgan, J., & Morgan, A. Oecologia, 84(4), 559-566 (1990).
- Vijver, M., Wolterbeck, H. T., Vink, J. P., and van Gestel, C. Total Environ., 340, 271-280 (2005).
- Fleming, T., and Richards, K. Pedobiologia, 23, 415-418 (1982).
- Sturzenbaum, S., Winters, C., Galay, M., Morgan, A., and Kille, P. Biol. Chem., 276(36), 34013-34018 (2001).
- Hopkin, S., & Hames C. A. C. and Dray, A. Microscopy and Analysis, 14, 23-27 (1989).
- Weltje, L. Chemosphere, 36, 2643-2660 (1998).


