A Study on Energy Consumption Pattern in Developing Areas of Western Himalayan State
Lalit Kumar1 , Rajeev Kumar Aggarwal1 * and Parminder Kaur Baweja1
1
Department of Environmental Science,
Dr Y S Parmar University of Horticulture and Forestry,
Nauni (Solan),
173230
HP
India
http://dx.doi.org/10.12944/CWE.10.3.20
A study was carried out on energy consumption and carbon emission in growth oriented Dharmpur block of Solan district of Himachal Pradesh. The energy consumption pattern revealed that fuelwood consumption contributed highest (80.43%) proportion of total energy mix followed by electricity (11.55%), kerosene (2.87%), dung cake (2.79%), LPG (2.31%) and diesel (0.08%). The daily energy consumption pattern in kg of coal equivalent for fuelwood, electricity, kerosene, dung cake, LPG and diesel was worked to be as 10.09, 1.45, 0.36, 0.35, 0.29 and 0.01, respectively. The per capita annual energy consumption of electricity was estimated to be 160 kWh, kerosene (1.29 liters), dung cake (0.07 tonnes) and fuelwood (0.76 tonnes). Annual CO2 emission from households in Dharmpur block was estimated as 86,603 tonnes out of which 74,275 tonnes (80.64%) was emitted from the fuelwood consumption only. The annual per capita energy consumption from all sources for Dharmpur block was estimated to be 12.5 tonnes of coal equivalent. The per capita CO2 emission from different energy sources in Dharmpur block was 1.1 tonnes.
Copy the following to cite this article:
Kumar L, Aggarwal R. K, Baweja P. K. A Study on Energy Consumption Pattern in Developing Areas of Western Himalayan State. Curr World Environ 2015;10(3) DOI:http://dx.doi.org/10.12944/CWE.10.3.20
Copy the following to cite this URL:
Kumar L, Aggarwal R. K, Baweja P. K. A Study on Energy Consumption Pattern in Developing Areas of Western Himalayan State. Available from: http://www.cwejournal.org/?p=13174
Download article (pdf)
Citation Manager
Publish History
Introduction
India is a country with 1.21 billion people and total land area of 3,287,263 km2.1 About 68 per cent of India’s population still live in rural areas and depend largely on non-commercial sources of energy such as fuelwood, biomass, and agricultural residue for their energy requirements for cooking and heating. In India, the domestic sector has been one of the largest consumers of energy accounting for 40 to 50 per cent of the total energy consumption.2 Primary energy consumption in India on an average has increased from of 525.5 Million tonnes of oil equivalent (Mtoe) in 2010 to 595 Mtoe in 2013, indicating a rise of about 13 per cent. Its average percentage has declined from 51 per cent in 2010 to 48 per cent in 2013.3 The per capita energy consumption in India was 800 kg of oil equivalent per year in 2013 compared to global consumption of 1,818 kgoe per year. Consumption of USA was 7,778 kgoe, Russia 4,745 kgoe and 1,700 kgoe by China per year.
The high consumption of fossil fuels has resulted increase in greenhouse gases (GHGs) which are mainly responsible for global warming. The carbon dioxide (CO2) concentration in the atmosphere has been rising alarmingly, according to Desai4 CO2 concentration in atmosphere has already reached 400 parts per million (ppm) compared to 274 ppm earlier (pre-industrialization).
According to Ministry of New and Renewable Energy, Government of India,5 the total cumulative installed capacity (MW) of renewable energy in the country as on April 2015 was 35,503 MW. The National Action Plan on Climate Change (NAPCC), which was released in June 2008 with the aim of promoting development goals while addressing greenhouse gases mitigation and climate change adaptations, suggested that upto 15 per cent of India’s energy could come from renewable resources by 2020. India’s climate modeling studies shows that its per capita emission will be around 2-2.5 tonnes of carbon dioxide equivalent by 2020 and around 3-3.5 tonnes of carbon dioxide equivalent by 2030, compared to around 1-1.2 tonnes of carbon equivalent presently. The Environmental Performance Index (EPI) a metric developed for 132 countries, placed India in the category of weakest performers at the 126th position overall and last in the terms of air quality.6
Himachal Pradesh is one of the lowest densely populated state having population of 6,864,602 and of which 6,176,050 are of rural areas and 688,552 are of urban areas.7 Agriculture is the major source of livelihood for more than 70 per cent of the population, which contributed about 20 per cent of the Gross State Domestic Product (GSDP). Himachal Pradesh has 487 medium and large scale industries and 38,220 small scale industries registered with the Department of Industries, which contributed 12 per cent to GSDP during 2010-11.8
Dharmpur development block is one of the growth oriented block of Solan district in Himachal Pradesh, located in lower Shivalik range. The block has been selected purposely for study because it consists of rural areas, semi urban areas and industrial areas and is also important from tourism point of view. Dharmpur development block has an area of 286.96 Km2 with population of 90,324 and population density of 279 Km-2. The elevation ranges from 300 meter to1500 meter above mean sea level, average annual temperature is 18°C and average annual rainfall is 1253 mm. Keeping in view of diversified energy consumption in the block, the present study was carried out on energy consumption and carbon emission in Dharmpur block of Solan district of Himachal Pradesh.
Methodology
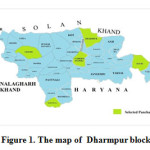
A multistage random sampling procedure was adopted for the selection of respondents from the study area. Dharmpur development block of district Solan of Himachal Pradesh was selected for study as it is one of the growth oriented block in Solan district and not much investigation for energy consumption pattern has been undertaken in this area. In the first stage, list of Panchayats falling in this block was obtained from Dharmpur development block office. Around 14 per cent of the total Panchayats, aggregating to 5 Panchayats were randomly selected. The map of Dharmpur block has been presented in Fig.1.
 |
|
In the second stage, list of villages falling under the selected Panchayats was prepared from the records of Dharmpur development block office. A sample of 20 per cent of the villages from the selected Panchayats aggregating to 14 villages was selected for study. In the final stage sampling, a complete list of households was prepared from the selected villages in Dharmpur development block and 10 per cent of selected households were selected randomly. In total 122 respondents were selected from the whole development block for the present study. Thereafter, the selected respondents were classified into different categories on the basis of APL & BPL, land holding, family income and family size as per details given below;
The households were categorized on the basis of land holding as per norms fixed by the Agriculture Census Department:
Marginal : < 1 hectare
Small : 1 to ≤ 2 hectare
Semi medium : 2 to ≤ 4 hectare
Medium : > 4 hectare
The households were categorized on the basis of monthly income as:
Very low income : < Rs. 5000
Low income : Rs. 5,000 to Rs. 10,000
Middle income : Rs. 10,000 to Rs. 15,000
High middle income : Rs. 15,000 to Rs. 20,000
High income : >Rs. 20,000
The households were categorized on the basis of family size as:
Small : < 4 members
Medium : 4 to 6 members
Large : 7 to 8
Very large : > 8
List of industrial units registered in Dharmpur development block was collected from District Industries Centre, Solan and District Industries Centre, Baddi. A sample of around 7 per cent of total registered industrial units (aggregating to 40 registered industrial units) was randomly selected for the study. The selected industries were categorized according to Micro, Small & Medium Enterprises Development (MSMED) Act, 2006:
Manufacturing Sector
Enterprises Investment in plant & machinery
Micro Enterprises Does not exceed Rs. 2.5 million
Small Enterprises More than Rs. 2.5 million but does not exceed Rs. 50 million
Medium Enterprises More than Rs. 50 million but does not exceed Rs. 100 million
Seasons were classified as:
Summer season: March - June
Rainy season: July – October
Winter season: November – February
Primary data were collected on well designed, pre-tested survey schedule (in Hindi) through personal interview method. Participatory techniques were also utilized for the collection of the relevant information on socioeconomic variables like households income, land holding and family size. Information on different energy sources viz. fuelwood, kerosene, electricity, Liquefied Petroleum Gas and dung cake used by selected households was collected.
The secondary data were collected from office of development block. The list of households and land holding were collected from Dharmpur block office. List of industrial units registered in Dharmpur development block was collected from District Industries Centre, Solan and District Industries Centre, Baddi. Socio-economic and other related data were analyzed through tabular analysis, average and percentage as and when required. Total annual energy consumption for selected households and industrial units was calculated as:
Monthly consumption of energy source * 12 * total number of respondents
Carbon Emission
The carbon emissions from the burning of conventional fuels were estimated by the product of total fuel consumption and their factors. Various fuels viz. fuelwood, kerosene, LPG, dung cake and diesel were converted into Coal Equivalent by conversion factors8 as presented in Table 1. The conversion factors used to translate various energy uses into CO2 emissions [10] have been presented in Table 2. For hydroelectricity, the emission factor is 0.5-151 kg CO2eq/MWh.11
Table 1: Coal equivalent values of various fuels
|
Fuel |
Coal Equivalent (kg per unit) |
|
Electricity |
0.70 |
|
Kerosene |
6.00 |
|
Diesel |
0.20 |
|
LPG |
1.19 |
|
Fuelwood |
0.82 |
|
Dung cake |
0.30 |
Table 2: Conversion factors used to translate various energy sources into CO2 emissions
|
Fuel category |
CO2 emitted per unit (kg) |
|
Electricity (kWh ) |
0.87 |
|
Kerosene (liter) |
2.41 |
|
Diesel (liter) |
2.46 |
|
LPG (kg) |
2.78 |
|
Fuelwood (kg) |
1.07 |
|
Dung cake (kg) |
1.07 |
Results and Discussion
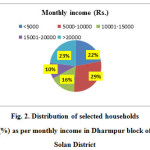
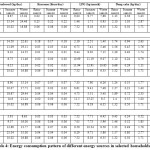
The study revealed that per household daily fuelwood consumption in BPL families was 15.14 kgce (Kilogram coal equivalent), whereas in APL families it was 8.85 kgce (Table 3) shows that pooper people consume more fuelwood. In case of kerosene consumption, it was 0.12 kgce in APL families and 1.32 kgce in BPL families as the BPL families get kerosene from public distribution system on subsidized rates. For dung cake, per household daily consumption was 0.29 kgce in APL families and 0.60 kgce in BPL families. In case of LPG and electricity consumption per household, the overall consumption was 0.29 kgce and 1.49 kgce, respectively. In case of monthly income per household, consumption of fuelwood and dung cake decreased with increase in income, while LPG and electricity consumption increased with increase in income (Fig.2). It showed that as income increased people switch over towards cleaner source of energy. In terms of overall average, it revealed that per household daily energy consumption in kg of coal equivalent of various energy sources in selected households was fuelwood (10.09), electricity (1.45), kerosene (0.36), dung cake (0.35), LPG (0.29) and diesel (0.01).
Table 3: Energy consumption in selected households of Fatehpur development block (%).
|
Particulars |
Fuelwood |
Kerosene |
Dung cake |
LPG |
Diesel |
Electricity |
|
APL |
8.85 |
0.12 |
0.29 |
0.35 |
0.02 |
1.60 |
|
BPL |
15.14 |
1.32 |
0.60 |
0.05 |
0.01 |
0.84 |
|
Overall average |
10.09 |
0.36 |
0.35 |
0.29 |
0.01 |
1.45 |
|
Monthly income (|?|) |
||||||
|
Very low |
14.11 |
1.02 |
0.53 |
0.08 |
0.00 |
0.94 |
|
Low income |
11.35 |
0.30 |
0.38 |
0.26 |
0.03 |
1.40 |
|
Middle income |
8.76 |
0.01 |
0.34 |
0.33 |
0.01 |
1.62 |
|
High middle income |
6.81 |
0.00 |
0.21 |
0.41 |
0.00 |
1.78 |
|
High income |
6.74 |
0.12 |
0.21 |
0.47 |
0.00 |
1.80 |
|
Overall average |
10.09 |
0.36 |
0.35 |
0.29 |
0.01 |
1.45 |
|
Land holding(ha) |
||||||
|
Marginal |
9.06 |
0.42 |
0.35 |
0.28 |
0.01 |
1.34 |
|
Small |
10.18 |
0.12 |
0.30 |
0.34 |
0.00 |
1.55 |
|
Semi medium |
18.27 |
0.24 |
0.50 |
0.18 |
0.09 |
1.78 |
|
Medium |
13.43 |
0.00 |
0.29 |
0.44 |
0.00 |
2.30 |
|
Overall average |
10.09 |
0.36 |
0.35 |
0.29 |
0.01 |
1.45 |
|
Family size (no.) |
||||||
|
Small |
4.52 |
0.18 |
0.12 |
0.29 |
0.00 |
1.23 |
|
Medium |
9.60 |
0.36 |
0.38 |
0.27 |
0.01 |
1.35 |
|
Large |
12.89 |
0.48 |
0.36 |
0.38 |
0.01 |
1.80 |
|
Very large |
22.21 |
0.24 |
0.51 |
0.32 |
0.09 |
2.28 |
|
Overall average |
10.09 |
0.36 |
0.35 |
0.29 |
0.01 |
1.45 |
 |
|
 |
|
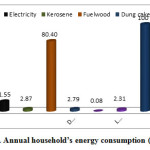
It was revealed that the electricity use for lighting was 100 per cent in both APL and BPL families, while kerosene use for lighting was 45% in BPL families than 7% in APL families. Study revealed that as land holding of families increased, electricity consumption for agriculture also increased. Monthly electricity consumption was found highest (15 kWh) in medium land holding families and lowest (2.33 kWh) in families having marginal land holding. Annual consumption of fuelwood in selected household was 545 tonnes, electricity (91 MWh), kerosene (2,643 liters), dung cake (52 tonnes), LPG (10,760 Kg) and diesel (2,672 liters). Estimated annual consumption of energy sources for whole block was calculated as fuelwood (69,399 tonnes), electricity (14.5 GWh), kerosene (117,317 liters), dung cake (6,293), LPG (1,874,257 Kg) and diesel (452,593 liters). The annual fuelwood consumption was calculated highest (80.40%), followed by electricity (11.55%), kerosene (2.87%), dung cake (2.79%), LPG (2.31%) and diesel (0.08%) (Fig.3). Aggarwal 12 has reported fuelwood consumption of 95.2% in his study conducted in Himachal Pradesh. Total annual consumption pattern of energy sources for households of Dharmpur block in million tonnes of coal equivalent was estimated as fuelwood (57.25), electricity (10.18), kerosene (0.70), dung cake (1.89), LPG (2.23) and diesel (0.09).
Present investigation revealed that annual per capita consumption of electricity was estimated to be 160 kWh, LPG (20.75 kg), kerosene (1.29 liters), dung cake (0.07 tonnes) and fuelwood consumption was 0.76 tonnes which was comparable to 0.795 tonnes reported by Sharma13 for low hills of Himachal Pradesh.
 |
|
Study also revealed that in Dharmpur block use of non conventional energy resources was not found prominent except solar water heaters and biogas plants. Solar water heaters were found in use in the block, whereas 35 families had installed solar water heater. Biogas plants (20) were found installed in Chandi Panchayat of Dharmpur block, but these biogas plants were non functional from last 3 years. Respondents were of the view that the biogas they were getting from the biogas plant was only available for 20 to 30 minutes per day during summer and rainy season. During winter season they were not getting any gas from the biogas plant and to making slurry from raw materials take too much time.
The present study indicated that in study area, medium enterprises comprised higher (55%) proportion of industries followed by micro (30%) and small (25%) enterprises. The study revealed that the monthly electricity consumption in micro enterprises was 154 kgce, in small enterprises it was 9,731 kgce and in medium enterprises it was 341,443 kgce, whereas monthly diesel consumption in micro enterprises (7.8 kgce), in small enterprises (86.8 kgce) and in medium enterprises (110.6 kgce). For industrial units, electricity use was found to be prominent (99.9%) than diesel (0.1%). However, it was found that COâ‚‚ emission proportion from diesel consumption in comparison of its consumption proportion was much higher than emission from electricity consumption, as electricity used is generated from hydro-projects which are a clean source of energy. Theodoru14 had indicated that hydropower life cycle emissions of CO2 were relatively low and are comparable to geothermal, nuclear, biomass, wind, and solar photovoltaic (PV) life cycle emissions. Annual energy consumption by selected industrial units in million tonnes of coal equivalent was worked to be 127.07. Annual electricity consumption in selected industries was 107 GWh and diesel consumption was 177,120 liters. Estimated annual energy consumption in coal equivalent for all industries in block was worked to be 10,547 Mtce.
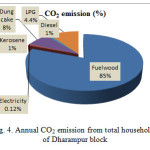
Investigation revealed that annual CO2 emission from selected households was 681.55 tonnes. Annual CO2 emission from selected industries was 488.5 tonnes. Total estimated annual CO2 emission in study area from households and industries was 93,488 tonnes, out of which households contributed 86,603 tonnes and remaining 6,885 tonnes from industrial sector. In total households of block annual CO2 emission in tonnes from fuelwood consumption was found highest 74,257 (85.47%) followed by dung cake 6,733 (8,13%), LPG 5,210 (4.40%), diesel 113 (0.96%) and electricity 7.25 (0.12%) (Fig. 4.). Present investigation also revealed that per capita CO2 emission from different energy sources in Dharmpur block was 1.1 tonnes which was comparable to 1.14 tonnes as reported by Parikh.15
 |
|
Conclusions
Investigation revealed that per household daily energy consumption in kg of coal equivalent from various energy sources was fuelwood (10.09), electricity (1.45), kerosene (0.36), dung cake (0.35), LPG (0.29) and diesel (0.01). Fuelwood contributed highest (80.40%) proportion of total energy mix, followed by electricity (11.55%), kerosene (2.87%), dung cake (2.79%) and diesel (0.08%). Total annual consumption of energy from different sources for households of Dharmpur block in million tonnes of coal equivalent was estimated as fuelwood (57.25), electricity (10.18), kerosene (0.70), dung cake (1.89), LPG (2.23) and diesel (0.09). The highest (35.7%) solar water heaters were in use mainly by APL families and 16.4 per cent of total households have biogas plants which were non functional. Total annual energy consumed in block both by domestic and industrial sector was estimated as 1,127.04 million tonnes of coal equivalent.
Investigation revealed that total estimated annual CO2 emission in study area from households and industries was 93,885 tonnes, out of which households contributed 86,603 tonnes and remaining from industrial sector. In total households of block, annual CO2 emission in tonnes from fuelwood consumption was found highest 74,257 (80.64%) followed by dung cake 6,733 (8.13%), LPG 5,210 (4.40%), diesel 1,113 (0.96%) and electricity 7.25 (0.12%), whereas annual CO2 emission from industrial sector in study area was 6,603 tonnes. Therefore remedial measures are urgently required prior to situation may get worse. In this context some of the suggestions are given below:
Acknowledgement
The assistance provided by Dr Ravinder Sharma, Dr R K Gupta and Prof & Head, Department of Environmental Science, Dr Y S Parmar University of Horticulture & Forestry, Nauni, HP, India in the present study is highly acknowledged.
References
- Census of India, office of Registrar General and Census Commission, Government of India, New Delhi, (2011).
- TERI Energy Data Directory and Yearbook, An Overview: The Energy Resource Institute, New Delhi, India, (2003).
- Das, A., and Paul, S.K. Change in energy requirement of residential sector in India. Energy Policy, 53: 27-40 (2013).
- Desai, B G. Energy in India and the world: 2013-14. Current Science. 106(1): 31-33 (2014).
- Ministry of New and Renewable Energy, Renewable energy at a glance: India. Akshay Urja, 8(5): 52 (2015).
- Quasir Shadman Hussain and Ahmad Md Aquil, Production, consumption and future challenges of coal in India, International Journal of Current Engineering and Technology, 4(5): 3437-3440 (2014).
- Himachal Pradesh Population Census data (2011).
- Knowledge Attitude and Practice survey on energy conservation for Directorate of Energy, Government of Himachal Pradesh, National Productivity Council, New Delhi, pp 25-27 (2012).
- Wright, L., Kemp, K., and Williams, I. Carbon foot printing: towards a universally accepted definition, Carbon Management, 2(1): 61–72 (2011).
- Ananthapadmanabham, G., Srinivas, K., and Vinuta, Gopal. A report on climate injustice: an Indian perspective. Greenpeace India: Jyothi Prints, Banglore, (2007).
- Steinhurs, W., Knight, P., and Schultz, M. Hydropower greenhouse gas emission: State of the Research.http://www.clf.org/wp-content/uploads/2012/02/Hydropower-GHG-Emissions (2012).
- Aggarwal, R. K. Fuel consumption pattern for policy intervention and integrated planning in rural areas. Journal of the Solar Energy Society of India, 19(1&2): 82-91 (2009).
- Sharma, B. S. K. Forests for fuel. Indian Forester, 107(12): 808-812 (1981).
- Theodoru, I., Radal, H., and Ole, J. H. Life cycle greenhouse gas emissions from the generation of wind and hydro power. Renewable and Sustainable Energy Review, 15(7): 3417-3422 (2010).
- Parikh, J., Panda, M., Kumar, A.G., and V. Singh. CO2 emissions structure of Indian economy. Energy, 34: 1024-1031 (2009).


