Algae as Bio-monitors for Damodar River Water Pollution
S. Lata Dora1 * , S K Maiti2 , R. K.Tiwary1 and Anshumali Singh2
http://dx.doi.org/10.12944/CWE.10.3.25
Damodar is an important tributary of Ganga river basin and cater the needs of industries and growing human population in the eastern part of India. Assessment of algal diversity was carried out to understand the impact of coal mining and allied industrial activities on the ecological condition of Damodar river basin. Surface water and algal samples were collected in the summer (2009) from ten sites along the Damodar River. Bio-monitoring of algal diversity showed high organic pollution load in the Damodar River. These observations were confirmed by statistical analysis. Algal community analysis and multivariate analysis showed influence of organic pollution in the river. Cluster analysis (CA) identified the similarity and dissimilarity among sampling sites and discriminate the reference site from rest of the impacted sites in the Damodar river basin.
Copy the following to cite this article:
Dora S. L, Maiti S. K, Tiwary R. K, Singh A. Algae as Bio-monitors for Damodar River Water Pollution. Curr World Environ 2015;10(3) DOI:http://dx.doi.org/10.12944/CWE.10.3.25
Copy the following to cite this URL:
Dora S. L, Maiti S. K, Tiwary R. K, Singh A. Algae as Bio-monitors for Damodar River Water Pollution. Available from: http://www.cwejournal.org/?p=13288
Download article (pdf) Citation Manager Publish History
Introduction
Population pressure, urbanization, industrialization by a long way, added up the huge amount of waste which is toxic and non-toxic to the aquatic ecosystems. These Pollutants alters the physico-chemical quality of water which eventually upset the biotic components of the aquatic system. Physico-chemical analyses show different concentrations of chemical pollutants, but they do not reflect its effect on ecological condition of water, as they do not integrate ecological factors.17 Biomonitoring and bioindicational methods are useful alternative for assigning the ecological changes of aquatic ecosystems as biological communities shows overall effects of chemical, physical and geomorphological characteristics of water39
Algae being a primary source of food in aquatic food web, therefore even small changes in the in the algal community can show a wide alteration tropic status of any aquatic system 34 Therefore, algae can be used as important bio-indicators in the monitoring of streams and rivers.19 A wide verity of work has been done by various researchers, using algae as bioindicator for biomonitoring of rivers to see the effect of water pollutants on biota.21,3,33,14,35.
The effect of pollution on algal species can be evaluated by using diversity index (H´) and Saprobic index (S). Several researchers have used the S for the evaluation of water quality.4,5 Bioindicators and biotic indices have been adopted as technical standards in Germany11 and in Austria.26 These methods have also been used in Europe for more than a decade16
Damodar River flows through mineral rich areas of the eastern India. Therefore mining is one the most significant industry in this region. Water from Damodar River and its tributaries are mainly used to meet the ever growing urban water demand, industrial activities and agricultural requirements. The important factors that pose threat to the water quality of Damodar River are, coal mines, washeries, coke oven plants, Thermal Power Plants, Steel Plants and sponge iron industries etc.
Impact of Industrial effluent and domestic waste on Damodar River is well documented by.40 Physico-chemical assessment and bio-monitoring has been conducted only in the lower stretch of Damodar river i.e the stretch falling in the West Bengal.10,9 A systematic study on assessment including bio-monitoring throughout the stretch affected by mining and allied industrial activity is lacking. Therefore present work was undertaken to study the effect of anthropogenic activities on algal assemblage in relation to its water quality. We tried to implement the two bioindicational and statistical methods, which represent some new approaches in water quality and algal diversity analysis of Damodar River.
Study Area
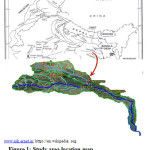
Damodar River basin area extends from 22045’ N to 24030’ N and 84045’ to 88000’ E. The length and catchment area of Damodar river is 542 km and 23,170 km,2 respectively. It flows through the industrial cities mainly Ramgarh, Bokaro, Dhanbad, Asansol, Durgapur, Bardwan and Howrah, before joining the lower Ganga (Hooghly estuary). The Damodar river is fed by number of tributaries at different reaches; the major ones are the Bokaro, Konar, Jamunia, Garga, Katri and Barakar (Figure 1). The basin is characterized by tropical climate with the annual rainfall of about 127cm10 most of which occurs during monsoon.
 |
|
Material and Methods
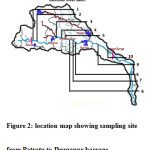
Damodar river water samples were collected from ten different sites during the summer. These locations were downstream to different mines and industrial discharges between Patratu to Durgapur covering 300 km of river stretch (figure 2, table 1).
 |
|
Table 1: Location of water sampling stations in the river
|
Sampling site code |
Name of sampling Site |
Description of Sampling Site |
|
Site1 |
Urimari |
Location falls near to the origin point of Damodar River. |
|
Site2 |
Bhurkunda |
Downstream (D/s) to the confluence of Nalkari River, carries the effluent discharged from the Patratu Thermal Power Plant. |
|
Site3 |
Konar |
D/s to the confluence of Konar River pouring the effleuent from Bokaro Thermal Power Plant. |
|
Site4 |
Kargali |
D/s to the confluence of Kargali River carries the effluent from Kargali coal washery. |
|
Site5 |
Phusro |
D/s to an industrial area. |
|
Site6 |
Moonidhi Kapat ghat |
D/s to effluent discharge from the Moonidih coal washery. |
|
Site7 |
Mohalbani ghat |
D/s to effluent discharge from an industrial area |
|
Site8 |
Domgarh ghat |
D/s to effluent discharge from Patherdih, Sudamdih and Chasnalla coal washery. |
|
Site9 |
Burnpur |
D/s to the confluence of Burnpur steel plant effluent |
|
Site10 |
Durgapur Barrage |
D/s to the confluence of mixed effluents from Industries at Durgapur. |
Algal samples were obtained by dragging a bottle across the water surface to collect the floating community.7 Uniform sized stones or pebbles covered with algal mass were scraped carefully with a scalpel and brush.4 Samples were preserved using 4% of formalin.15 Three replicate slides were prepared for each sample and cells were measured by drop count method.15 Counting and identification of species, was done using the digital microscope (Olympus Bx 60 fitted with digital camera). Identification of algae was done with help of standard keys in Standard books and monographs.32,1,6,42,8,29
Statistical Analysis
Biodiversity indices were calculated using following formula:
H’ = ∑[pi (ln pi)],37 (i)
Where, pi= proportion of each species in the sample.
Saprobic Index : S = ∑ s.h/ ∑h ,27 (ii)
Where, s = value of each species according to Liebmann’s list of indicator organisms,20
H = frequency of each species found.
Cluster Analysis (CA) was also conducted to find out the (dis)similarity between the sampling sites.12 The levels of (dis)similarity at which observations are merged used to construct a Dendrogram. To perform CA, an agglomerative hierarchical clustering (AHC) was used in combination of the Ward’s linkage method and Euclidean distances as a measure of (dis)similarity. All the statistical analysis was performed using XLSTAT version 6.05.2014.
Results and Discussion
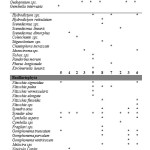
Algal species composition of Damodar River during the sampling period is given in Table 3. A total of 71 species belonging to 9 phyla were indentified during summer season in the Damodar River. Phytoplankton was observed high during summer season, supported by finding of different researchers,18, 36. Chlorophyta and Bacillariophyta were the richest taxonomic group with 27 and 21 species respectively, followed by Cyanophyta (12 species) and Euglenophyta (4 species), Heterokontophyta (3 species), Charophyta (2 species), Rhodophyta and Cryptophyta with 1 species each.
 |
|
Damodar River at Moonidih (Site6) showed maximum number of species during the study period. 27 species were found at site6 followed by site5 and site7 with 24 and 18 species respectively. Maximum number of Cyanophyta (6 species) and Chlorophyta (9 species) was found at site5. Maximum number of Bacillariophyta (11 species) was found at site 6. All the sites were subjected to some form of pollution; hence the species distribution was strongly biased towards those that are tolerant of heavy or slightly elevated level of pollution. Among Cyanophycean, species of Oscillatoria showed maximum occurance. Among Chlorophyacean, species of Spirogyra, Cladophora and Oedogonium species showed maximum occurrence. Among Bacillariophyta, Synedra ulna, species of Gonphonema, Nitzschia and Navicula showed maximum occurrence.30,28,15,24 has shown that species of Oscillatoria, Euglena, Nitzschia, Navicula, Synedra, Fragilaria, Closterium, Microcystis and Scenedesmus are species present in the organically polluted water with high pollution indicative values. Similar genera are also found in the present study. Stigeoclonium is considered to be a pollution (organic and heavy metal) tolerance species by22,13 which is also recorded in the present study at site 6.
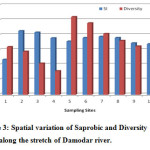
The saprobic index (S), which was based on the specific saprobic zone of algal species used in this study, distinguished the levels of water quality conditions in the Damodar River. The sampling stations along the stretch of Damodar River can be classified, on the basis of physico-chemical characteristics as well as the specific tolerance of algal species (S) as clean, moderate and highly polluted. The physico-chemical values and saprobic condition can be related, and S values provide an excellent refinement of the general picture obtained by chemical analysis.23 The S calculated for each of the sampling sites that reflects organic pollution, varies from 1.18 to 2.14 (figure 3). The amplitude of variation falls in the rank of the Oligosaprobic to β-mesosaprobic, showing polluted water quality. Minimum S was calculated for Urimari which was the least disturbed area. The S value started increasing down the river, peaking at Bhurkunda (site 2) (2.14) d/s to Nalkari river (tributary of Damodar River) carrying effluent from Patratu Thermal Power Plant. Next peak value was observed at Damodar River d/s to Konar (site 3). This sampling site falls at the d/s to the tributaries that, apart from carrying industrial effluent may also carry large amount of domestic discharge from the residential area through which they passes and ultimately drains into Damodar River. The S value increases at Moonidih (site 6) and Mohalbani (site 7). May be because these sampling sites fall under wide industrial and residential area. S value at Burnpur (DR9) and at Durgapur (site 10) showed lower saprobic values i.e. 1.73 and 1.7 respectively.
 |
|
Diversity Index showed wide variation during summer (figure 3). High H´ is observed at the middle stretch of Damodar River. Damodar River at Phusro (site 5) showed maximum value (2.61) followed by Moonidih (site 6) (2.40) and Mohalbani (site 7) (2.04). Lower H´ values was observed at Kargali (0.79) followed by Konar (1.05) and at Bhurkunda (1.45). Sampling site like Urimari (site 1) shows good algal diversity with low saprobic value. Maximum diversity was observed at site 6 (1.98). Sampling site 5, 6, 7 showed moderated pollution with high H´. Most probably, the occurrence of organic matter, especially during drier months at these stations, favored certain species that can thrive in the environment. As a result, sufficient sensitive species remain together with increasing numbers of tolerant species, to maintain a fairly high H´ in the population. Increase in H´ under moderate stress in the present study has also been supported by.2,31,41,38,25,14
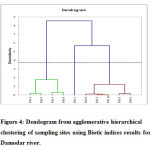
Ten sampling sites were assessed using cluster analysis to determine the correspondence between the sampling sites on the basis of biotic indices (figure 4). The final dendograms exhibit a compact visualization of the dissimilarity matrix that classifies the ten sampling site into three statistically significant clusters. Cluster/class 1, 2 & 3 corresponds to relatively low pollution, moderate pollution and high pollution region of the river respectively.
 |
|
Spatial cluster analysis based on Saprobic and Diversity Index generated a dendogram which is shown in figure 4. With regards to the dendogram the ten sampling sites were grouped into three clusters. Cluster 1 includes sampling site 1 corresponding to low pollution; Cluster 2 includes Sampling site 2-4 and 9 showing moderate pollution, whereas cluster 3 includes sampling site 5-8 and 10 corresponding to high pollution. The variance decomposition for the optimal classification values were 33.25% for within class variation and 66.75% for between class variations (table 3). Boitic indices clustering separated the reference site 1 from the other sampling sites indicating that the reference site was relatively clean in terms of water quality. Cluster analysis done using biotic indices classified site 2 as moderately and site 5 & 10 to be highly polluted site (figure 4).
The above observations classify Damodar River into three zones. Patratu to Tenughat as zone 1; Tenughat to Panchet as zone 2 and Panchet to Durgapur as zone 3. Zone 1 falls into relatively polluted zone as comparatively less industrial activity in this region; Zone 2 falls into highly polluted zone as it is an intensive and active coal mining & allied industrial zone with high population; Zone 3 falls into moderately polluted zone, may be because of dilution factor of the pollutants in Panchet dam and Barker River, one of the main tributary that joins Damodar River upstream to sampling site 9 (Burnpur)
Table 3: Variance decomposition for the optimal classification:
|
Absolute |
Percent |
|
|
Within-class |
0.134 |
33.25% |
|
Between-classes |
0.270 |
66.75% |
|
Total |
0.404 |
100.00% |
Conclusion
Physico-chemical, bacteriological and phytoplankton community analysis were carried out to understand the overall ecological health of Damodar River at ten sampling sites affected by mining and allied industrial activities from Patratu to Durgapur during summer. The study depicted that Damodar River is affected by point and non point pollution sources from coal mines, allied industries and surrounded residential areas. A total of 71 algal species were indentified during the study period. The major taxonomic divisions in Damodar River were dominated by Chlorophyceae followed by Bacillariophyceae, Cyanophycaea and Euglenophyceae. Saprobitic index showed that water quality of the Damodar River water falls between oligosaprobic to β-mesosaprobic zone. S ranged from 1.18 to 2.14 during the study period. Urimari (Site1) was found to be the only site where water quality falls under oilgosaprobic zone and have high diversity the in the upper stretch of the river which shows minimum stress level. The entire sampling site down the stretch falls under β-mesosaprobic zone, with few sampling site showing high diversity. Multivariate technique was useful in providing support to the data obtained by biotic indices. Cluster analysis showed sampling site 5, 6, 7, 8, and 10 to be organically polluted. On the basis of present study, it is concluded that biological study using algal community should be used to get the overall picture of ecological health of river, as it provide an integrated measurement of water quality as experienced by the aquatic biota, and therefore offers a useful addition to physico-chemical water quality monitoring strategies. It is also found that algal community study are very helpful in indicating sources and degree of pollution as well as discriminating reference site from the impacted sites of the study area. Therefore it is preferable and recommended to use algae for water quality monitoring that will support sound management decision regarding Damodar River water quality.
References
- Standard Methods for the Examination of Water and Wastewater. American Public Health Association/Water Environment Federation, 21st Ed. New York. (2005)
- Archibald, R. E. M. Diversity in some South African diatom associations and its relation to water quality. Res., 6: 1229 – 1238. (1972)
- Barinova, S.; Medvedeva, L. A and Anissimova,O. V. Diversity of Algal Indicators in Environmental Assessment. Pilies Studio Tel Aviv (Rus). (2006) http://herba.msu.ru/algae/materials/book/title.html 2008.
- Barinova, S.; Tavassi M.; Glassman H and Nevo E. Algal Indicator of Pollution in the lower Jordan River, Israel. Ecology and Environ. Res., 8(1), 19-38. (2010)
- Bere, T and Tundisi, J.G. Applicability of borrowed diatom-based Water Quality Assessment indices in Streams around Sao Carlos-SP, Brazil. Hydrobiol., 673, 179-192. (2011)
- ; Edward G and David C.- siqee. Fresh Water Algae – Identification and use as bioindicators. 1st ed. A John Wiley & Son’s L.t.d. U.K. (2010)
- Brake, S.S.; Dannelly, H.K and Connors, K.A. Controls on the nature and distribution of an alga in coal mine-waste environments and its Potential Impact on Water quality. Geol., 40, 458-469. (2001)
- Bold, H.C and Wynne, M. J. Introduction to Algae: structure and reproduction. Prentice-Hall, Englewood Cliffs, New Jersey. (1978)
- Chakraborty, D and Konar, S K. Ecological study on the status of pollution by steel plant waste on river Damodar at Barnpur, West Bengal. J Environ Health., 44(1), 5-7. (2002)
- Chatterjee, S K.; Bhattacharjee, I and Chandra, G. Water quality assessment near an industrial site of Damodar River, India. Monit. Assess., 161(1-4), 177-189. (2009).
- DIN (Deutsches Institut für Normung) 38410-1. German standard methods for the examination of water, waste water and sludge—Biological–ecological analysis of water (group M) Part 1: Determination of the saprobic index in running waters (M1) (80 pp). Berlin: DIN. (2004)
- Danielsson A., I. Cato, R. Carman and L. Rahm, “Spatial Clustering of Metals in the Sediments of the Skager- rak/Kattegat,” Applied Geochemistry, Vol. 14, No. 6, 1999, pp. 689-706. doi:10.1016/S0883-2927(99)00003-7
- Gunale, V R and Balakrishnan, M. S. Biomonitoring of eutrophication in the Pavana, Mula and Mutha Rivers flowing through Poona. Indian J. Environ. Hlth., 23 (4), 316-322. (1981)
- Hill, B H., Herlihy, A T.; Stevenson, R J.; Kaufmann, P R.; McCormic, F J and Johnson, C. B. The use of Periphyton Assemblage Data in an Index of Biotic Integrity N. Am. Benthol. Soc., 19, 50-67. (2000)
- Jafari, N. G and Gunale, V. R. Hydrobiologcal Study of Algae of an Urban Freshwater River. of Appl. Sci and Environ. Mangt., 10(2), 153-158. (2006)
- Junqueira, M.V.; Friedrich G.; de Araujo P.R.P. A saprobic index for biological assessment of River water quality in Brazil (Minas Gerais and Rio de Janerio states). Monit. Assess., 163, 545-554.(2010)
- Karr JR, Allen JD, Benke AC. River conservation in the United States and Canada. In: Boon PJ, Davies BR, Petts GE, eds. Global Perspectives on River Conservation. Science, Policy and Practice. Chichester: Wiley, 2000.
- Kamat, S.V. Hydrobiological studies of two temple ponds in Ponda taluka Goa. Environ. Cons., 6, 361-362. (2000)
- Kolkwitz, R.; Marson, M. Okologie der tierischen Saprobien. Revue gesamten Hydrobiol 2.,126-152 (in German). (1908)
- Liebmann, H. Handbuch der Frischwasser-und Abwasserbiologie. I. 2nd Oldenbourg, Munich. (1962).
- Lipkovsky, E.; Barinova, S. S.; Nevo, E. Algal Diversity Dynamics and Ecological Mapping of Streams in the Upper Jordan River, Northern Israel. Proceeding of the First International Conf. “Bio-indicators in Monitoring of Freshwater Ecosystems”23-27 October 2006, St. – Petersburg., pp 128-132. (2007).
- Mclean, R O. Tolerance of Stigeoclonium tenue to heavy metals in south wales. Bri. J Phyco., 9, 91-98. (1974)
- Maznah, W. O. Wan and Mansor, M. Aquatic pollution assessment based on attached diatom communities in the Pinang River basin, Malaysia. , 487, 229-241. (2002)
- Nandan, S.N.; Aher, N.H. Algal community used for assessment of wate rquality. Environ. Biol., 26(2), 223-227. (2005)
- Nather Khan, I.S.A. Effect of urban and industrial wastes on species diversity of the diatom community in a tropical river, Malaysia. Hydrobiol, 175–184. (1991)
- Ö-Norm M 6232 (Österr. Normungsinstitut) Richtlinien für die ökologische Untersuchung und Bewertung von Fließgewässern(38 pp). Wien. (1995)
- Pantle, R.; Buck H. Die biologische uberwachung der gewasser und die darstellung der Ergebnisse. Gas und Wasswerfach 96., 604. (1955)
- Palmer, C. M. A composite rating of algae tolerating organic pollution. Phyco. 5:78-82. (1969)
- Palmer C. M.. The identification, significance, and control of Algae in water supplies and in polluted water. Algae and water pollution. Castle House Publication, London. (1980)
- Patrick, R. Algae as indicator of pollution. In biological problems in water pollution. 3rd seminar Bot.A. Tuft Sanitory Eng. Centre Cincinati Ohio., pp 223-232. (1965)
- Patrick, R. Use of algae, especially diatoms, in the assessment of water quality. In Cairns, J. Jr. & K. L. Dickson (eds), Biological Methods for the Assessment of Water Quality. Special Technical Publication 528. American Society for Testing and Materials, Philadelphia, Pennsylvania., 76–95. (1973)
- Philipose, M.T. Ecology and Physiology of Chlorococcales. Pub. Indian Council of Agricultural Research, New Delhi, India. (1967).
- Potapova, M and Charles, D F. Distribution of Benthic Diatoms in US Rivers in Relation to Conductivity and ionic Composition. Freshwater Bio., 48, 1311-1328. (2003)
- Porter, S.D.. Upper Midwest river systems – Algal and nutrient conditions in steras and rivers in upper Midwest region during seasonal low flow condition, in Nutrient Criteria. Technical Guidance Manual, Rivers and Streams: Washington, D.C., U.S. Environmental Protection agency, Office of Water, Office of science and Technology, EPA-822-B-00-002, p. A-25 – A42. ,(2000)
- Ramakrishnan, N. Bio-monitoring approaches for water quality assessment in two waterbodies at Tiruvannamalai, Tamil Nadu, India. Proceedings of the Third International Conference on Environment and Health, Chennai, India. 15th -17th pp 374- 385. (2003)
- Singh, S.P.; Pathak D. and Singh, R. Hydrobiological studies of two ponds of Satna (M.P) India. Environ. Cons., 8, 289-292. (2002)
- Shannon C.E and Weaver, W. The Mathematical Theory of Communication. Univ.Illiois Press, Urbana, Chicago, London., 125. (1949)
- Stevenson, R. J. Epilithic and epipelic diatoms in the Sandusky River, with emphasis on species diversity and water pollution. , 114, 161–175. (1984).
- Steven RJ, Pan Y. Assessing environmental conditions in rivers and streams using diatoms. In: Stoermer EF, Smol JP, eds. The Diatoms. Applications for the environmental and Earth Sciences. Cambridge: Cambridge University Press., 11-40. (1999).
- Tiwary, R. K and Abhishek. Impact of Coal Washeries on Water Quality of Damodar River in Jharia Coalfield. Indian J. Environ. protection., 25, 518 -522. (2005).
- van Dam, H. On the use of measures of structure and diversity in applied diatom ecology. Nova Hedwigia., 73, 97–115. (1982)
- Vashishta, B.R. Botany for Degree Students-Algae/Part I. 7th ed.; press S. Chand and sons pub, New Delhi. (1986)


