Assessing Environmental Sensitivity Areas to Desertification in North of Iran
Ameneh Sobhani1 and Hassan Khosravi2 *
http://dx.doi.org/10.12944/CWE.10.3.19
The sensitivity map to desertification of Chehel-chai basin (North of Iran) has been elaborated by the crossing of fives criteria including climate, water erosion, soil, vegetation, and management, which have the main impact on the evolutionary process of desertification. The methodology is resulted from the desertification model of MEDALUS, which use qualitative index to define the land sensitive area to desertification. According to the factorial scaling technique, score-ranging from 1(good condition) to 2(deteriorated condition) is assigned to each indicator. Each index was assessed based on selected indicators, which resulted in qualitative mapping of each index based on geometric average of the indicators. Thematic databases, with a 1:50000 scale resolution, were integrated and elaborated in GIS software based on arc view3.2, Ilwis3.1 and ArcGIS9.3. The obtained results indicate that 39.39% of Chehel-chai basin is highly sensitive to desertification, 2.13 % has moderate sensitivity, only 2.43% has low sensitivity and 56.05% is non-sensitive. Studying the mean weight of numerical value, it is distinguished that the intensity of desertification for the total area is 1.32 which is classified as fragile (2).
Copy the following to cite this article:
Sobhani A, Khosravi H. Assessing Environmental Sensitivity Areas to Desertification in North of Iran. Curr World Environ 2015;10(3) DOI:http://dx.doi.org/10.12944/CWE.10.3.19
Copy the following to cite this URL:
Sobhani A, Khosravi H. Assessing Environmental Sensitivity Areas to Desertification in North of Iran. Available from: http://www.cwejournal.org/?p=13155
Download article (pdf) Citation Manager Publish History
Introduction
Defined as the change of fertile and productive lands into non-productive desert areas, desertification remains as a major environmental concern in most arid, semiarid, and sub-humid areas of the world (Dregne, 1977; UNCCD, 1994; Herrmann and Hutchinson, 2005). Desertification may results from various natural and human-associated factors such as wind or/and water erosion, destruction of vegetation covers and water resources, water logging, soil salinization and alkalization, etc. (Kassas, 1977; Mainguet, 1994; Blum, 1998; Krishan et al., 2009). Among these factors, unsustainable human activities, such as urbanization, overgrazing, over-cultivation, poorly drained irrigation systems, deforestation, etc. are currently considered as the most important factors accelerating the process of desertification (Barbero-Sierra et al., 2013; Bo et al., 2013). In addition to these direct effects, human activities may also indirectly contribute to desertification, for example through affecting environmental factors such as climate (Kassas, 1977; Khosravi, 2004).
The United Nations Convention to Combat Desertification (UNCCD), which is the only internationally legally organization, offers strategies to combat desertification and mitigate the effects of drought through national action programs that incorporate long-term strategies supported by international cooperation and partnership arrangements. Several models have been developed and a large number of studies have been carried out to assess the risk of desertification in different areas most of which are specialized to particular geographic areas (Santinia et al., 2010). To develop these models to local areas of interest, it is necessary to re-investigate and adjust them to local environments (Geeson et al., 2002).
During the last decades, many areas of Iran have been subjected to intense desertification because of drought, unsustainable land use, and increasing pressures on land and water resources (Amiraslani and Dragovich, 2011). In this study, we used the Mediterranean Desertification and Land Use (MEDALUS) project to assess and map desertification sensitivity in a watershed located at north of Iran. In this project, the focus is primarily on Mediterranean environments where physical loss of soil by water erosion, and the associated loss of soil nutrient status are identified as the dominant problem (Brandt and Thornes, 1996; Geeson et al., 2002; Arar et al., 2009). The MEDALUS project is a popular GIS-based technique which computes an index, such as the Environmentally Sensitive Areas (ESAs) index containing several environmental (e.g. climate, soil vegetation) and anthropogenic (e.g. management) parameters (Kosmas et al., 1999). The indicators selected to evaluate the sensitivity to desertification can provide an overview for evolution of ecosystems and environments, which can be applied as efficient tools for decision-making and planning (Basso et al. 2000). Results of this study would provide a map of desertification sensitivity exhibiting the area of degraded land, process type, dominant indicator involved, and intensity classes of desertification.
Materials and methods
Study Area
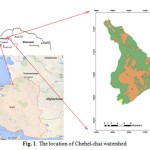
The Chehel-chai River is one of the largest branches of the Gorganrood River located at Golestan province, northeastern part of Iran. This river drains an area of about 250 km2 across geographic coordinates ranging from 55°23´ E to 55°38´ E and from 36°59´ N to 37°13´ N (Figure 1).
 |
|
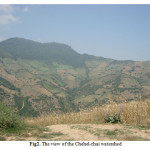
The elevation of this watershed ranges from 190 to 2570 m (a.s.l) and the mean slope is 45.82%. Limestone formations, alluvial deposits near the streams and quaternary sedimentary formations, loess, dominate the underlying geology in the lowlands of the study area. The region has a Mediterranean climate with warm and dry summers and temperate and rainy winters. Falling occurs mainly in winter and spring with the mean annual precipitation is about 750 mm. Therefore, the river has a relatively high discharge during winter and spring, but low during summer and autumn. Forests (60%) and croplands (40%) are predominant land uses in the watershed (Figure 2).
 |
|
Methodology
We used the MEDALUS methodology, with slight modifications, to map vulnerable areas to desertification using means of environment-state and response indices (Geeson et al., 2002, Kosmas et al., 1999). This methodology has been presented as a manual of key indicators of desertification and mapping environmentally sensitive area to desertification (Kosmas et al., 1999).
Based on their applicability and susceptibility to environmental processes, the risk of desertification in Chehel-Chai watershed was evaluated on a regional scale by defining levels on the basis of some parameters or indices of five categories including climate, vegetation, soil, water erosion, and management trough field investigations and spatial data. Each parameter was weighted in relation to its impact and contribution to desertification process.
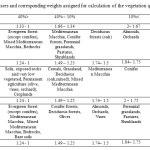
All data required for this method were elicited from previous studies or calculated or collected from field samplings (Table 1). These data were then introduced to GIS system to calculate required indices and visualize a desertification map for the study region (Rafiei Emam, 2003).
To establish the relative scale of severity, those threshold values with critical conditions were selected to normalize outputs, and the results were then weighted using lands in the study area (Al-Adamat et al., 2003). Finally, a single index obtained via integrating all of these indices was selected as a representative of the desertification risk in the study area.
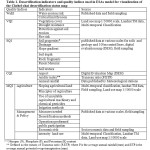 |
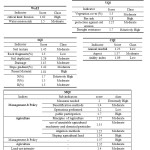
Table 1: Desertification indicators and quality indices used in ESAs model for visualization of the Chehel-chai desertification status map Click here to View table |
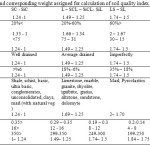
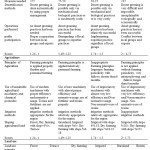
Five general indices (Quality indices) were considered by the model each containing various parameters (indicators) (Table 1). To calculate the individual indices, detailed studies were conducted on hydrologic, geomorphologic, erosion, and soil and vegetation cover characteristics of the region. The detailed information of the individual indicators and their scores has been summarized in Tables 2, 3, 4, 5, and 6.
 |
|
 |
|
 |
|
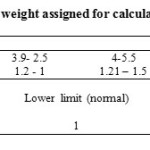
Table 5: Classes and corresponding weight assigned for the calculation of the climate quality index
|
Annual rainfall |
280 mm> |
650 – 280 mm |
650 mm< |
||||
|
Scores |
2–1.67 |
1.66–1.34 |
1.33– 1 |
||||
|
Aspect |
S |
SE - SW |
E |
NE |
W |
NW |
N |
|
Scores |
2 |
1.85 |
1.7 |
1.6 |
1.4 |
1.2 |
1 |
|
Aridity index (P/ETP) |
0.05> |
0.2 – 0.05 |
0.45– 0.19 |
0.65– 0.44 |
0.65< |
||
|
Scores |
2 – 1.80 |
1.79 – 1.60 |
1.59– 1.40 |
1.39– 1.20 |
1.19- 1 |
||
 |
|
The risk of desertification in the final indices was classified into different classes (Table 7).
Table 7: Quantitative scores and qualitative classes of five major indices
|
Scores |
2 (high) |
1.5 (moderate) |
1 (low) |
|
|
WaEI -Classes |
>1.6 |
1.6-1.3 |
1.3> |
|
|
Scores |
2 (high) |
1.6(moderate) |
1.3 (low) |
1( non-threatened) |
|
VQI -Classes |
1.75< |
1.74 - 1.5 |
1.49-1.25 |
1.24> |
|
Scores |
2 (high) |
1.5 (moderate) |
1 (low) |
|
|
Classes-SQI |
1.46< |
1.13-1.45 |
1.13> |
|
|
Scores |
2 (high) |
1.5 (moderate) |
1 (low) |
|
|
Classes-CQI |
1.81< |
1.15-1.80 |
1.15> |
|
|
Scores |
2 (high) |
1.6 (moderate) |
1.3 (low) |
1 ( non-threatened) |
|
Classes-MQI |
1.75< |
1.74 - 1.5 |
1.49-1.25 |
1.24< |
For each index, a score ranging between 1, as good condition, and 2, as deteriorated condition, was assigned based on factorial scaling technique. Additionally, A zero value was assigned when the measure was not appropriate for an area or where that area was not classified. In most cases, a linear function ranging from 1 to 2 (extreme values) represents the variation of the indicators (score). Although in some particular cases, a non-linear variation is possible. The value of quality index for each elementary unit within a layer was obtained as geometric average of scores of single indices according to the following formula:
Index – X = [(Layer – 1) × (Layer – 2) … (Layer – n)]1/n
Where Index-X is a given index, Layer is the indicators of each index and N is the number of indicators for each index.
The five quality indices were computed using ArcGIS software v. 9.3 as the geometric mean of the indicators related to each single index. The importance of each index in desertification was determined using the following formula:
1. Water Erosion Index (WaEI) = (Erosion critical limit × Water erosion risk)1/22. Vegetation Quality Index (VQI) = (Vegetation cover × Fire risk × protection against soil erosion × Drought resistance)1/4
iii) Soil Quality Index (SQI) = (Soil texture × Rock fragments × Soil depth × Drainage × Slope × Parent Material × Soil properties)1/7
1. Climate Quality Index (CQI) = (Annual rainfall × Aspect × Aridity index)1/32. Management Quality Index (MQI) = (managerial policies × agriculture × land use intensity × economic risk)1/3
The maps of abovementioned indicators were obtained based on modified model and a final desertification map was provided by multiplying the prepared maps. Here, the value of each index was calculated from geometric mean of its indicators. Finally, the desertification intensity was determined by calculating the geometric average of the five indices as follow:
DM = WaEI × VQI × SQI × CQI × MQI)1/5
Where DM is desertification mapping and the other abbreviations are the same as the above five formula.
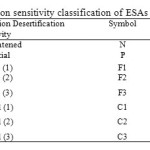
The intensity ranges of desertification sensitivity for each class have been shown in Table 8.
In order to better clarify the boundaries between each fragile and critical classes, they were divided by three sub-groups ranging from 1 as low sensitivity to 2 as high sensitivity.
 |
|
Results
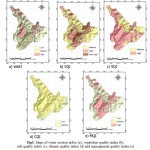
The maps of sensitivity to desertification of different indices, provided by the ESAs model, have been shown in Figure 3.
 |
|
The geometric average and qualitative classes of indicators of each index have been also summarized in Tables 9 and10.
 |
|
Analysis of desertification indices in Chehel-chai basin showed that soil quality index was the major problem of desertification in the study area with a geometric average of 1.57, which shows very high desertification class. The vegetation quantity index with a weighted average of 1.53 was the second major factor underlying desertification in the studied area.
Table 10: Geometric averages of the quantitative values and qualitative classes of indices
| Index | Scores | Class |
| WaEI | 1.46 | High |
| SQI | 1.32 | High |
| CQI | 1.32 | Moderate |
| VQI | 1.53 | High |
| MQI | 1.48 | Moderate |
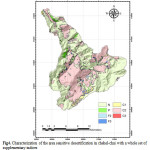
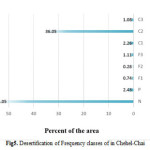
Based on five studied indices, the assessment of frequency distribution classes in terms of desertification risk for current statues showed that mean weight of quantitative values was 1.32 for all study area compared to ESAs table (Table 9) implying that this area has a desertification class of fragile (class 2) (Figure 4).
 |
|
In addition, the result showed that 56.05% of the area fits into “absent class” of no sign of desertification. 2.43% of the region was allocated in low class, which means that land degradation has some little effect on it. This area should be considered as a sensitive area. 2.43% of the region was allocated in the medium class where desertification has obvious effects. Finally, 39.39% of the region was allocated to high classes of desertification. These areas, mainly located in the south and southwestern part of the region, are critically sensitive to desertification (Figure 5).
 |
|
Discussion
In this study, we used the MEDALUS method to assess risk of desertification in Chehel-Chai watershed. The ESAs model is very advantageous and user-friendly model for determination of different classes of vulnerable areas to desertification (Arar et al. 2009; Brandt and Thornes 1996). This model has been frequently proposed to be more helpful than other methods because of its accuracy, particular weighting of layers, use of geographical information systems in overlaying of maps, use of geometric mean instead of arithmetic one or sum to compute indices and representation of the final desertification map (Brandt and Thornes 1996; Basso et al. 2000).
This Chehel-Chai watershed is believed to be exposed to high rates of desertification, such that more than 57% of the total surface had an ESAs value of more than 1.5. This has been attributed to a combination of factors including land weakening and degradation as a result of unprincipled human activities, low qualities of vegetation surfaces, and low quality soils. The low-quality vegetation surfaces occur predominately in southern part of the region, but move upward to northern parts representing ongoing decline of vegetation in the study area. Factors such as growing population, environmental pollutions, forest fire, exploitation of natural lands for agriculture and overgrazing which represents human activities are the main factors underlying desertification and land degradation (Brandt & Thornes 1996; Breckle et al. 2002; Hostert et al. 2003; Geist and Lambin 2004; Yassoglou and Kosmas 1997). Although, in recent decades, climate change has been also considered as a predominant factor causing rapid decline of ecosystem biomass and leading to desertification in semi-arid ecosystems (Nicholson 2002; Allen et al. 2003).
Results of this study showed that the use of GIS is helpful in assessing areas at risk of desertification because of saving time, providing precision, and reliability in future studies. This system provided a general overview of desertification status as a map of desertification vulnerability (Chenchouni et al., 2010). This approach will be worth for decision makers for developing the best guidelines to combat against desertification in sensitive lands. Of course, some other detailed studies are still required to recognize the most sensitive areas to desertification. Human-related factors seem to be currently the most important factors influencing desertification in Chehl-Chai basin, since environmental limitation such as rainfall inadequacy, prolonged dry periods, extreme temperature and evaporation, salinity and soil alkalinity do not exist in this area. The role of climate changes in desertification is more evident in arid and semi-arid regions. Deforestation and conversion of forests to rain-fed lands is one of the main causes for starting the process of land degradation and desertification in the study area. Of course, other natural factors such as climatic factors like storms, early cold, drought, geological factors like landslides (mass erosion) also plays a role in the destruction of the forest of basin.
Improper management of land use in a watershed has undesirable effects on the available resources. Optimization of land use is one of the most useful strategies for achieving sustainable development and reducing wasted resources (Jalili et al., 2007). Use of lands based on their potential in proper managerial planning can reduce destruction and losses of land (Chapi, 1997).
References
- Al-Adamat, R. A. N., Foster, I. D. L. and Baban, S. M. J. “Groundwater vulnerability and risk mapping for the Basaltic aquifer of the Azraq basin of Jordan using GIS”. Remote sensing and DRASTIC. Appl Geogr. 23: 303–324 (2003).
- Allen, C. D., Macalady, A. K., Chenchouni, H., Bachelet, D., Mcdowell, N., Vennetier, M., Kitzberger, T., Rigling, A., Breshears, D. D., Gonzales, P., Hogg, E. H. T., Fensham, R., Zhang, Z., Castro, J., Lim, J. H., Allard, G., Running, S. W., Semerci, A. and Cobb, N. “A Global Overview of Drought and Heat-Induced Forest Mortality Reveals Emerging Climate Change Risks”. Ecol Manage, 259: 660-684 (2010).
- Amiraslani, F., Dragovich, D. “Combating desertification in Iran over the last 50 years: An overview of changing approaches”. J Environ Manage. 92: 1-13 (2011).
- Arar, A., Chenchouni, H. and Benabderrahmane, M. C. “Climate Change and Desertification Risks assessment in Aurès Region (Eastern of Algeria) by Using of Geomatic Data”. Montreal, Canada: Presented at the Int. Joint Assembly of IAMAS-IAPSO-IACS “MOCA, (2009).
- Barbero-Sierra, C., Marques, M. J. and Ruíz-Perez, M. « The case of urban sprawl in Spain as an active and irreversible driving force for desertification”. J Arid Environ. 90: 95-102 (2013).
- Basso, F., Bove, E., Dumontet, A., Ferrara, A., Pisante, M., Quaranta, G. and Taberner, M. “Evaluating environmental sensitivity at the basin scale through the use of geographic information systems and remotely sensed data: an example covering the Agri basin (Southern Italy)”. Catena. 40: 19-35, (2000).
- Blum, W. H. “Basic concepts: degradation, resilience and rehabilitation”. Lal, R., Blum, W. H., Valentine, C. and Stewart, B. A., editors. Methods for Assessment of Soil Degradation. Boca Ratón: CRC Press, p. 1-16 (1998).
- Bo, T. L., Fu, L. T. and Zheng, X. J. “Modeling the impact of overgrazing on evolution process of grassland desertification”. Aeolian Res, 9: 183-189 (2013).
- Brandt, J. C. and Thornes, J. B. “Mediterranean Desertification and Land Use”. London: John Wiley & Sons (1996).
- Breckle, S. W., Veste, M. and Wucherer, W. “Deserts, land use and desertification”. In: Breckle, S. W., Veste, M. and Wucherer, W., editors. Sustainable Land Use in Deserts. New York: Springer Verlag; 3-13 (2002).
- Chapi, K. “Type and amount of erosion in relation to land management and operation of deposition determine contributions to optimize land use” M.Sc. thesis, Department of Natural Resources, Tarbiat Modarres University, Iran, 185p (1997).
- Chenchouni, H., Benabderrahmane, M. C. and Arar A. “Modeling and Mapping Desertification Risk in Eastern Algeria with Geomatic Data”. Proceedings of the IECHAR conference, 213-217 (2010).
- Dregne, H. E. “Desertification of arid lands”. Econ Geogr. 53: 322-331(1977).
- Geeson, N. A., Brandt, C. J. and Thornes, J. B. “Mediterranean desertification: a mosaic of processes and responses”. Ed. Wiley, (2002).
- Geist, H. J. and Lambin, E. F. “Dynamic causal patterns of desertification”. Bioscience. 54: 817-829 (2004).
- Herrmann, S. M. and Hutchinson, C. F. “The changing contexts of the desertification debate”. J Arid Environ. 63: 538-555 (2005).
- Hostert, P., Röder, A., Hill, J., Udelhoven, T. and Tsiourlis, G. “Retrospective studies grazing induced land degradation: a case study in central Crete, Greece”. Int J Remote Sens. 24: 4019-4034 (2003).
- Jalili, K. H., Sadeghi, S. H. R. and Nikkami, D. “Land Use Optimization of Watershed for Soil Erosion Minimization Using Linear Programming (a Case Study of Brimvand Watershed, Kermanshah Province)”. J Sci Technol Agric Nat Resources; Water Soil Sci, 10: 15-27 (2007).
- Kassas, M. “Arid and semi-arid lands: problems and prospects”. Agro-Ecosyst, 3: 185-204 (1977).
- Khosravi, H. Application of MEDALUS model on desertification in Kashan Region (in Persian) [M.Sc. thesis]. Department of Range and Watershed Management. College of Agriculture & Natural Resources, University of Tehran, Karaj, Iran, 151p, (2004).
- Krishan, Gopal,; Kushwaha, S.P.S and Velmurugan, A Land degradation mapping in upper catchment of river Tons. J Indian Soc Remote; (2009). 37: 49-59.
- Kosmas, C., Ferrara, A., Briasouli, H. and Imeson, A. “Methodology for mapping Environmentally Sensitive Areas (ESAs) to Desertification”. In: Kosmas, C., Kirkby, M. and Geeson, N., editors. The MEDALUS project: Mediterranean desertification and land use. Manual on key indicators of desertification and mapping environmentally sensitive areas to desertification. Eur Union; 31-47 (1999).
- Mainguet, M. “Desertification: Natural background and human mismanagement”. Berlin: Springer Verlag; 314p (1994).
- Nicholson, N. E. “What are the key components of climate as a driver of desertification? In: Reynolds JF, Stafford Smith DM”, editors. Global Desertification: Do Humans Cause Deserts? Berlin: Dahlem University Press, 41–57 (2002).
- Rafiei Emam, A. “The study of desertification with emphasis on soil and water problem (Case study: Vramin plain)”. M.Sc. thesis, Department of Range and Watershed Management, University of Tehran, Karaj, 167p (2003).
- Santinia. M., Caccamo, G., Laurenti, A., Noce, S. and Valentin, R. A multi-component GIS framework for desertification risk assessment by an integrated index. Appl Geogr, 30: 394-415 (2010).
- UNCCD. “United Nations Convention to Combat Desertification in Those Countries Experiencing Serious Drought and/or Desertification Particularly in Africa”. Final Text. United Nations, (1994).
- Yassoglou, N. J. and Kosmas, C. “Desertification in the Mediterranean Europe, A case in Greece. In: RALA (Eds.): Rangeland Desertification Report”. RALA Eds, Report 200: 27-33 (1997).


