Assessment of Environmental Behaviour Among the Urban Poor of Panjtirthi Slum, Jammu, India
Shehnaz Khan1 * , Arvind Kumar1 and Piyush Malaviya1
http://dx.doi.org/10.12944/CWE.10.3.10
The present study is an attempt to evaluate environmental awareness and attitude among the slum dwellers. Results based upon dwellers responses to various questions on environmental issues revealed that majority of the respondents (76.19%) had score indicating high level of basic environmental awareness. Among the gender groups, significant difference between the basic environmental awareness level among male and female respondents was observed but no significant difference was shown among different educational and age groups. Similarly, majority of respondents showed a high level (86.81%) of environmental attitude.
Copy the following to cite this article:
Khan S, Kumar A, Malaviya P. Assessment of Environmental Behaviour Among the Urban Poor of Panjtirthi Slum, Jammu, India. Curr World Environ 2015;10(3) DOI:http://dx.doi.org/10.12944/CWE.10.3.10
Copy the following to cite this URL:
Khan S, Kumar A, Malaviya P. Assessment of Environmental Behaviour Among the Urban Poor of Panjtirthi Slum, Jammu, India. Curr World Environ 2015;10(3). Available from: http://www.cwejournal.org/?p=12861
Download article (pdf) Citation Manager Publish History
Introduction
Rapid urbanization growth has caused accelerating rate of urban poverty. This happens due to uncontrolled migration from rural areas to urban areas as well as from small urban centres to large urban centres. In this process, the poor settle in informal sector of economy inhibiting areas for their own convenience and affordability, resulting into mushrooming of slums in general. Slums are considered as illegally occupied houses and creating a nuisance of environmental pollution and degradation of urban living conditions.1
The pervasion of anthropogenic environmental problems have been attributed to maladaptive human behaviour by some environmental psychologists and assert that the solution to these depend on a proper examination and understanding of human attitudes towards the environment.2 Environmental attitudes encompass the beliefs, affective responses and behavioural intention that people hold concerning environment-related activities and issues.3 To better understand environmental attitudes, the level of knowledge possessed by the sample population concerning the severity of environmental problems, their reaction to and their interaction with nature must be ascertained by assessing environmental awareness.4 Hence, in the exploration of an alternative approach to the influencing human interaction with the environment, the present study aims to measure the awareness of environmental issues and attitude regarding the natural environment with a particular focus on the effects of factors such as age, sex and education on the distribution of environmental knowledge among the inhabitants of Panjtirthi slum, Jammu (J&K) India.
Study Area and Methodology
The study area a slum known as Dhountly Dhaki was located at Panjtirthi area of Jammu city (J&K). It was situated on a public land near Jammu old city circular road, approximately 4 km away from the bus stand of Jammu city. This unplanned settlement was more than fifty years old and consisted of 115 houses. The main approach road to the slum was at a higher elevation while the interior regions were low lying.
The questionnaire was used to measure the environmental awareness among the slum dwellers which can be defined as responsibility and concern for what is happening in the environment. The environmental awareness was examined with a series of questions inquiring about the local environment. Another questionnaire was used to measure environmental attitude which can be defined as acquisition of values, feelings, and motivation towards the environment.5 The questionnaire which was used to measure the environmental awareness contained twenty five multiple choice questions, each question represented score of one so that total score became twenty five. If the respondents had selected the correct answer they were given one score, otherwise they got zero (correct answer=1 and incorrect answer=0). Respondents who scored between 0 to 8 were considered to have a low awareness level, those having 9 to 16 were considered to have moderate awareness, and respondents having score between 17 to 25 were presumed to have high awareness about environment.
In the questionnaire about environmental attitude measurement, the Likert scale measurement was used for every statement on environmental attitude on a five point scale. For the purpose of counting score, score 5 (strongly agree) to 1 (strongly disagree) was assigned to each positive statement (agreement with the statement was considered as favourable response), while for negative statements (agreement with the statement was considered as unfavourable response) the scoring was reversed i.e. 1 for strongly agree and 5 for strongly disagree. According to the composite score of responses out of twenty questions, level of environmental attitude was classified in three categories viz., low, modern and high. Each statement was having score of 5 and there were five levels of agreements in each question, thus the total score was 100. Respondents who scored between 0 to 33.33 were considered as having low attitude, those who scored between 33.34 to 66.66 had moderate attitude and respondents having score between 66.67 to 100 were interpreted as having high attitude towards environment.6
The collected data was entered in to a research database utilizing the Statistical Package for the Social Sciences (SPSS, version 17.0) under the windows computer operating system for the purpose of analysis. Each case was entered into database assigning a code to identify each participant, the significance level was 0.05. Independent samples t-test was used as a test of statistical significance. The procedure was applied to compare the means of the two independent groups of variables (males and females). If the observed t-test value exceeded the critical value of the results of the table, the null hypothesis (Ho) was rejected, which inferred that there was a significant difference between the two variables. For more than two groups, One Way ANOVA was applied.
Results and Discussion
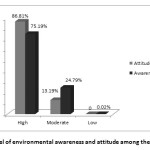
Environmental awareness is defined as understanding of the natural system combined with how they interact with man’s social system. In the present study, basic environmental awareness among the slum dwellers was measured on the basis of dweller’s responses to twenty five questions on various environmental issues. Based on the individual responses, the score of the respondents was compared and on the basis of scores obtained, the level of awareness among the respondents was analyzed. Majority of the respondents (75.19%) had score indicating high level of basic environmental awareness (17-25), 24.79% of the individual had moderate level (9-16), while 0.02% in the study area had shown low level (1-8) of basic environmental awareness (Figure 1). The mean basic environmental awareness score of the slum dwellers was 17.85. On the contrary, the study conducted by Kumar and Malaviya (2015)6 revealed that majority of the respondents (85.79%) had moderate level of environmental awareness.
 |
|
The difference between the gender groups (males and females) regarding the basic environmental awareness level was evaluated with the help of an independent t-test. The results showed that mean score of male respondents (19.07) was more than the mean score of female respondents (16.64). Significant difference between the basic environmental awareness level among male and female respondents (t= 5.44 (218), p= 0.000) was observed (Table 1). As the value of p was less than 0.05 so we accepted the null hypothesis (Ho) and thus there was significant difference between the gender groups. As far as the awareness was concerned the males scored higher because they may encounter environmental information more frequently. Women are most often occupied with domestic tasks including management of household resources, taking care of offspring and supplementary income generation. These socio-cultural restrictions strongly influence the awareness of females in comparison to the males whose activities are carried out outside the home environment. On the contrary, Zelezny et al. (2000)7 in their work “Elaborating in gender differences in environmentalism”, found that women have stronger environmental awareness than men. In another study, Aminrad et al. (2010)5 found that there was no significant difference between the gender groups about environmental awareness among Iranian students in Malaysian Universities while Ogunbode and Arnold (2012)8 found that males scored higher than females in the measure of environmental awareness.
Table 1: T-Test for comparing environmental awareness between gender groups
|
Total Awareness score |
Gender |
N |
Mean |
Std. deviation |
t |
df |
p |
|
|
Males |
110 |
19.07 |
2.45 |
5.44 |
218 |
0.00 |
|
|
Females |
110 |
16.64 |
3.98 |
Level of significance (p<0.05)
The relationship of education with the level of environmental awareness was evaluated with the help of one way ANOVA. The respondents were categorized into different educational groups (illiterate, up to middle and above middle level). Table 2 shows that the mean basic environmental awareness score of the illiterate respondents was 17.67 (n=92), respondents who studied up to middle level showed environmental awareness score of 17.77 (n=88) and those respondents whose educational qualification was above middle level had mean environmental awareness score of 18.47 (n=40). No significant difference was found in the environmental awareness score among the three different level of educational groups {F (2,217) =0.766, p=0.466}. The environmental awareness score of respondents having above middle level education was more than those having middle level education. Increase in the education level leads to environmental awareness while sending school increase the literacy. Thus it was found that the awareness is attributed to the higher level of exposure to the education.
Table 2: One way ANOVA for comparing environmental awareness among educational groups
|
Educational level |
N |
Mean |
Std. deviation |
df |
f |
Sig. |
|
Illiterate (group I) |
92 |
17.67 |
3.29 |
2,217 |
0.766 |
0.466 |
|
Upto middle (group II ) |
88 |
17.77 |
4.02 |
|||
|
Above middle (group III) |
40 |
18.47 |
2.71 |
Level of significance (p>0.05)
By comparing the basic environmental awareness between different age groups using one way ANOVA, we found that there was no significant difference (p>0.05) in basic environmental awareness scores of the three age levels {F (2,217) 2.456, p= 0.088} (Table 3). For the age group I (15-30 years, n=110) mean score was 17.61, for age group II (30-45 years, n=94) the mean score was 17.82 and for the age group III (above 45 years, n=16) the mean environmental awareness score was 19.68. The awareness can be attributed to the electronic media such as television, which was among the most common item possessed by 96% of the respondents, and helped the common masses in the most accessible way using different languages and culture in attaining the awareness about the environment by using the audio-visual means of communication.
Table 3: One way ANOVA for comparing environmental awareness among age groups
|
Total environment awareness |
Age(years) |
N |
Mean |
Std. deviation |
t |
df |
P |
|
|
15-30 (group- I) |
110 |
17.61 |
3.42 |
2,217 |
2.456 |
0.088 |
|
|
30-45 (group II)
|
94 |
17.82 |
3.70 |
|||
|
|
45 and above (group III) |
16 |
19.68 |
2.414 |
Level of significance (p>0.05)
Environmental attitudes encompass the belief, affective responses and behavioral intentions that people hold concerning environment related activities and issues. The dimension of environmental attitude includes environmental world view, environmental concern and environmental commitment. The analysis of composite scores based on the responses to twenty questions on the environmental attitude showed that the majority of respondents achieved a high level (86.81%) of environmental attitude; others (13.19%) had a score that indicated a moderate level (Figure 1). The mean basic environmental attitude score of the slum dwellers was 76.04. To compare the environmental attitude between the gender groups (males and females) t-test was used. The t-test showed that mean attitude score for males (n=110) and females (n=110) was 78.06 and 73.51, respectively, indicating no significant difference between the group of males and females {t=4.843(218), p=0.000} (Table 4). Thus it has been found that social desirability has no relationship with gender to act pro-environmentally.
Table 4: t-test for comparing environmental attitude between gender groups
|
Total Attitude score |
Gender |
N |
Mean |
Std. deviation |
t |
df |
P |
|
|
Males |
110 |
78.06 |
5.99 |
4.843 |
218 |
0.00 |
|
|
Females |
110 |
73.51 |
7.808 |
Level of significance (p<0.05)
To investigate whether there was any difference in environmental attitude score among the different educational groups, one way ANOVA was conducted. Table 5 shows that the average environmental attitude score of group I (illiterate, n=92) was 75.08, of group II (up to middle class, n=88) 75.72 and of Group III (above middle class, n=40) was 77.55 {F (2,217) =1.59, p=0.205}. The average score between the literate groups varied slightly. Thus sending children to the school makes them literate but increase in the educational level leads to positive environmental attitudes. On the same line, a study carried by Aminrad et al. (2010)5 reported that although there was no significant difference in the environmental attitude of Iranian Students, the average score of environmental attitude improved with increase in the level of education.
Table 5: One way ANOVA for comparing environmental attitude among educational groups
|
Educational level |
N |
Mean |
Std. deviation |
df |
f |
Sig. |
|
Illiterate (group I) |
92 |
75.08 |
6.76 |
2,217 |
1.59 |
0.205 |
|
Upto middle (group II ) |
88 |
75.72 |
8.03 |
|||
|
Above middle (group III) |
40 |
77.55 |
6.69 |
Level of significance (p>0.05)
In environmental attitude score for the three age groups {F (2,217) =0.040, p= 0.0960}, Table 6 shows the statistically insignificant difference at p>0.05 level. Average environmental attitude score of the age group I (15-30 years, n=110) was 75.66. Age group II (30-45, years, n= 94) had average environmental attitude score of 76.88, while age group III (above 45 years, n=16) had score of 76.12. It was found that the respondents irrespective of their age were concerned about the environmental issues which had the most direct impact on their daily lives. On the contrary, findings of Carlsson and Johansson (2000)9 reported a lack of willingness to contribute to environmental protection among old people in Sweden.
Table 6: One way ANOVA for comparing environmental attitude among age groups
|
Total environmental attitude |
Age(years) |
N |
Mean |
Std. deviation |
t |
Df |
P |
|
|
15-30 (group I) |
110 |
75.66 |
6.86 |
2,217 |
0.040 |
0.0960 |
|
|
30-45 (group II)
|
94 |
76.88 |
8.09 |
|||
|
|
45 and above (group III)) |
16 |
76.12 |
5.56 |
Level of significance (p>0.05)
Conclusion
The study was an attempt to evaluate environmental awareness and attitude among the slum dwellers. Results based upon dweller’s responses to various questions on environmental issues revealed that majority of the respondents (76.19%) showed high level of basic environmental awareness. Among the gender groups, significant difference between the basic environmental awareness level among male and female respondents was observed but no significant difference was shown among different educational and age groups. Likewise, bulk of respondents demonstrated a high level (86.81%) of environmental attitude. The study concluded that the exposure to information promote the adoption of pro-environmental attitudes.
Acknowledgement
The first author (SK) duly acknowledges Maulana Azad National Fellowship (MANF), UGC for financial assistance.
References
- Hina, Poorest of the poor: A comparative study of two slums of central and north east Delhi, India. Global Advanced Research Journal of Geography and Regional Planning, 2(5): 085 -096 (2013).
- Milfont, L.T., and Duckitt, J., The structure of environmental attitudes: A first and second order Confirmatory factor analysis. Journal Environment Psychology, 24: 289-303 (2004).
- Schultz, P.W., Shriver, C., and Tabanico, J.J., Implicit connection with nature. Journal of Environment Psychology, 24:31-42 (2004).
- Ziadat, A. Major factors contributing to environmental awareness among people in Third world countries/ Jordan. Environment Development and Sustainability, 12, 135-145 (2009).
- Aminrad, Z., Azizi, M., Wahib, M., Huron, R., and Nwawi, M., Environmental awareness and attitude among Iranian students in Malaysian Universities. Environment Asia, 3(special issue), 1-10 (2010).
- Kumar, A., and Malaviya, P., Assessment of environmental awareness and attitude among the inhabitants of Transport Nagar slum (Narwal) Jammu (J&K). International Journal of Recent Scientific Research, 6 (6): 4910-4914 (2015).
- Zelzeny, L. C., Chua, P. P., and Aldrich, C., Elaborating on Gender differences in Environmentalism. Journal of Social Issues, 56 (3): 443-457 (2000).
- Ogunbode, .C. A., and Arnold, K., A study of environmental awareness and attitudes in Ibadan, Nigeria. Human & Ecological risk assessment, An International Journal, 18: 669-684 (2012).
- Carlsson, F., and Johansson-Stenman, O., Willingness to pay for improved air quality in Sweden. Applied Economics, 32: 661-669 (2000).


