Development of an Overall Water Quality Index (OWQI) for Surface Water in Indian Context
Surjeet Singh1 , N. C. Ghosh1 , Gopal Krishan1 , Ravi Galkate2 , T. Thomas2 and R. K. Jaiswal2
1
National Institute of Hydrology,
Roorkee,
247667
Uttarakhand
India
2
National Institute of Hydrology, Ganga Plains South Regional Centre,
Bhopal,
462042
India
http://dx.doi.org/10.12944/CWE.10.3.12
A number of water quality indices based on classification criteria, sub-indices and aggregation function have been developed by the researchers for categorizing the water quality for different uses. In the present study, a general Overall Water Quality Index (OWQI) is developed to classify the surface water into five categories, viz. excellent, good, fair, poor and polluted. For this purpose, the concentration ranges have been defined on the basis of the Indian Standards (IS) and Central Pollution Control Board (CPCB) standards also taking into account other International standards of World Health Organization (WHO) and European Commission (EC). Sixteen parameters are selected based on social and environmental impact and weights are assigned on their relative importance to impact the quality of water. The proposed index improves understanding of water quality issues by integrating complex data and generates a score which describes the status of water quality. The proposed index will be very useful for the water management authorities to maintain good health of surface water resources.
Copy the following to cite this article:
Singh S, Ghosh N. C, Krishan G, Galkate R, Thomas T, Jaiswal R. K. Development of an Overall Water Quality Index (OWQI) for Surface Water in Indian Context. Curr World Environ 2015;10(3) DOI:http://dx.doi.org/10.12944/CWE.10.3.12
Copy the following to cite this URL:
Singh S, Ghosh N. C, Krishan G, Galkate R, Thomas T, Jaiswal R. K. Development of an Overall Water Quality Index (OWQI) for Surface Water in Indian Context. Available from: http://www.cwejournal.org/?p=12994
Download article (pdf) Citation Manager Publish History
Introduction
The quality of water is defined in physical, chemical, biological forms in each category and the water quality parameters are selected on the basis of their intended use. A number of sites for the water quality monitoring create voluminous information and results in complexity to categorize the quality of water for various purposes. Such classifications are generally used for comparison of quality of water on individual parameter basis as per the national and international standards. Even after comparison, it is extremely difficult to arrive at any conclusion due to a number of parameter values in different ranges. In order to overcome such difficulties an Overall Water Quality Index (OWQI) is developed in this paper based on sixteen parameters that are generally used for drinking purpose under the surface water category. These parameters include turbidity, colour, total dissolved solids (TDS), pH, dissolved oxygen (DO), biochemical oxygen demand (BOD), secchi depth, hardness, chloride, fluoride, nitrate, total phosphate, iron, sulphate, arsenic and total coliform.
In general, the major objective of water quality assessment is to determine the fulfillment of defined objectives; to describe water quality at regional, national or international scales, and also to investigate trends in time1 so that it can be classified within the respective regulatory standards2 for various intended purposes such as potable water, agricultural, recreational and industrial water uses3. A number of water quality indices have been developed by various researchers but many of them have some kind of flaws. Bharti and Katyal (2011)4 reviewed a number of water quality indices for surface water vulnerability assessment. A comparison of various water quality indices was made by Abbasi (1999)5 and an overview of various types of sub-indices, aggregation functions and flaws is presented in Table 1.
Table 1: Comparison of various water quality indices (Abbasi, 1999)5
|
S. N. |
Index |
Sub-Indices |
Aggregation Function |
Flaws |
|
1 |
Horton (1965)6 |
Segmented linear (step functions) |
Weighted sum multiplied by 2 Dischotomous term |
Eclipsing region |
|
2 |
Brown et al. (1970)7 |
Implicit non-linear |
Weighted sum |
Eclipsing region |
|
3 |
Landwehr (1976)8 |
Implicit non-linear |
Weighted product |
Non-linear |
|
4 |
Parti et al. (1971)9 |
Segmented non-linear |
Weighted sum (arithmetic mean) |
Eclipsing region |
|
5 |
Mc Duffie & Haney (1973)10 |
Linear |
Weighted sum |
Eclipsing region |
|
6 |
Dinius (1972)11 |
Non-linear |
Weighted sum |
Eclipsing region |
|
7 |
Dee et al. (1973)12 |
Implicit non-linear |
Weighted sum |
Eclipsing region |
|
8 |
O’Connor’s (1972)13 |
Implicit non-linear |
Weighted sum |
Eclipsing region |
|
9 |
Deininger & Landwehr (1971)14 |
Implicit non-linear |
Weighted sum & geometric mean |
Eclipsing region & non-linear |
|
10 |
Walski & Parker (1974)15 |
Non-linear |
Weighted product Geometric mean |
Non-linear |
|
11 |
Stoner (1978)16 |
Non-linear |
Weighted sum |
|
|
12 |
Nemerow & Sumitomo (1970)17 |
Segmented linear |
Root mean square of max. & arithmetic mean |
- ve value |
|
13 |
Smith (1987)18 |
Multiple types |
Minimum operator |
- ve value |
|
14 |
Viet & Bhargava (1998)19 |
Multiple types |
Weighted product |
- ve value |
Sargaonkar & Deshpande (2003)3 and Boyacioglu (2007)1 have developed two water quality indices in the exponential form and in linear form, respectively during the last decade but the coliform index developed by Boyacioglu (2007)1 gives erroneous value of index in the parameter range of 5000 to 50000, while in case of Sargaonkar & Deshpande (2003),3 some eclipsing problem occurs in the indices of DO, hardness, nitrate and coliform.
Keeping in view, the flaws in the above indices, an Overall Water Quality Index (OWQI) is developed by considering sixteen water quality parameters which covers physical, chemical and biological aspects of water. The concentration ranges, for this purpose, have been defined in Indian Standards (IS) and Central Pollution Control Board (CPCB) standards also taking into account International standards of World Health Organization (WHO) and European Commission (EC). This OWQI helps in understanding the quality of water by integrating the complex voluminous data and generates a score to describe the status of water quality. Such indices will prove very helpful for environmentalists, decision makers and field engineers in maintaining good health of surface water resources.
Methodology
The general methodology for the development of a water quality index can be summarized in the following four steps:
Parameter Selection - Selection of suitable/concerned water quality parameter.
Development of Sub-indices Function - Transformation of concentration of water quality parameters into mathematical equations.
Assignment of Weights - Deciding suitable weights of various selected water quality parameters.
Aggregation of Sub-indices to Construct an Overall Index – Construction of an overall water quality index (OWQI).
Selection of Water Quality Parameters
In India, Indian Standards (IS 10500: 1991) and Central Pollution Control Board (CPCB) standards govern the quality of water for various uses. Based on Indian and other standards, total sixteen parameters, viz. turbidity, colour, TDS, pH, DO, BOD, secchi depth, total hardness, chloride, fluoride, nitrate, total phosphate, iron, sulphate, arsenic and total coliform are considered significant to affect the surface water quality. For all these parameters, a class classification criterion has been devised to categorize the quality of water into five classes. These classes include excellent, good, fair, poor and heavily polluted. The proposed water quality classification criteria along with class and index score are given in Table 2.
Table 2: Proposed water quality classification criteria
|
S.N. |
Parameters |
Unit |
Classes |
||||
|
Excellent |
Good |
Fair |
Poor |
Heavily Polluted |
|||
|
Index Score |
95-100 |
75-94 |
50-74 |
25-49 |
0-24 |
||
|
1 |
Turbidity |
NTU |
5 |
10 |
25 |
250 |
>250 |
|
2 |
Colour |
Hazen Unit |
10 |
15 |
50 |
175 |
>175 |
|
3 |
Total Dissolved Solids |
mg/L |
500 |
1000 |
1500 |
3000 |
>3000 |
|
4 |
pH |
- |
6.5-8.5 |
6.0 - 6.4 & 8.6 - 9.0 |
5.5 - 5.9 & 9.1 - 9.5 |
< 5.5 & > 9.5 |
< 5.5 & > 9.5 |
|
5 |
DO |
mg/L |
8 |
6 |
4 |
2 |
<2 |
|
6 |
BOD |
mg/L |
2 |
3 |
5 |
7 |
>7 |
|
7 |
Secchi Depth |
m |
>=10 |
8.5 |
5 |
2.5 |
<0.85 |
|
8 |
Total Hardness |
mg/L |
< 300 |
400 |
500 |
600 |
>600 |
|
9 |
Chloride |
mg/L |
200 |
250 |
600 |
800 |
>800 |
|
10 |
Fluoride |
mg/L |
0.7-1.5 |
1.6 |
1.7 |
2 |
>2 |
|
11 |
Nitrate |
mg/L |
10 |
20 |
50 |
100 |
>100 |
|
12 |
Total Phosphate |
mg/L |
0.02 |
0.16 |
0.4 |
0.65 |
>0.65 |
|
13 |
Iron |
mg/L |
0.1 |
0.3 |
0.5 |
1 |
>1 |
|
14 |
Sulphate |
mg/L |
25 |
150 |
250 |
400 |
1000 |
|
15 |
Arsenic |
mg/L |
0.005 |
0.01 |
0.05 |
0.1 |
0.2 |
|
16 |
Total Coliform |
MPN |
50 |
500 |
5000 |
50000 |
>50000 |
Development of Sub-Indices Function
Sub-indices functions are basically the equations that transform the concentration ranges into the index score through mathematical equations. These scores are then further converted to a common scale based on their relative importance to impact the quality of water. These sub-indices function are developed based on the water quality standards and their concentrations to meet in particular range. For this purpose, mathematical expressions were fitted for each parameter to obtain the sub-index equations as given in Table 3. In this index, the corresponding variation between the range of parameter and index is kept uniform to provide more accurate value of indices.
Table 3: Development of sub-indices function for various parameters
|
S. N. |
Parameter |
Range of Parameter |
Sub-Index Function |
|
1 |
Turbidity |
0 - 5 |
Y=100 |
|
6 - 10 |
Y=-4*X+115 |
||
|
11 - 25 |
Y=-1.667*X+91.67 |
||
|
26 - 250 |
Y=-0.111*X+52.78 |
||
|
> 250 |
Y=-0.1*X+50 |
||
|
2 |
Colour |
0 - 10 |
Y=100 |
|
11 - 15 |
Y=-4*X+135 |
||
|
16 - 50 |
Y=-0.7143*X+85.71 |
||
|
> 50 |
Y=-0.2*X+60 |
||
|
3 |
TDS |
0 - 500 |
Y=100 |
|
501 - 1000 |
Y=-0.2*X+195 |
||
|
1001 - 1500 |
Y=-0.0278*X+91.67 |
||
|
1501 - 3000 |
Y=-0.0167*X+75 |
||
|
> 3000 |
Y=-0.0083*X+50 |
||
|
4 |
pH |
6.5 - 8.5 |
Y=100 |
|
6.0 - 6.4 & 8.6 - 9.0 |
Y=50 |
||
|
5.5 - 5.9 & 9.1 - 9.5 |
Y=25 |
||
|
< 5.5 & > 9.0 |
Y=0 |
||
|
5 |
DO |
8 and above |
Y=100 |
|
6 - 7.9 |
Y=10*X+15 |
||
|
0 - 5.9 |
Y=12.5*X |
||
|
6 |
BOD |
< 2 |
Y=100 |
|
2 - 2.9 |
Y=-20*X+135 |
||
|
3 - 7 |
Y=-12.5*X+112.5 |
||
|
> 7 |
Y=-5*X+60 |
||
|
7 |
Secchi Depth |
10 and above |
Y=100 |
|
< 10 |
Y=100*LOG(0.90*X+1) |
||
|
8 |
Total Hardness |
100 - 300 |
Y=100 |
|
301 - 400 |
Y=-0.2*X+155 |
||
|
> 400 |
Y=-0.25*X+175 |
||
|
9 |
Chloride |
200 and below |
Y=100 |
|
201 - 250 |
Y=-0.4*X+175 |
||
|
251 - 600 |
Y=-0.0714*X+92.86 |
||
|
> 800 |
Y=-0.125*X+125 |
||
|
10 |
Fluoride |
0.7 - 1.2 |
Y=100 |
|
1.6 - 2.0 |
Y=-260.8*LN(X)+205.38 |
||
|
< 0.7 & > 2.0 |
Y=0 |
||
|
11 |
Nitrate |
10 and below |
Y=-0.5*X+100 |
|
11 - 20 |
Y=-2*X+115 |
||
|
21 - 50 |
Y=-0.8333*X+91.67 |
||
|
51-100 |
Y=-0.5*X+75 |
||
|
> 100 |
Y=-0.25*X+50 |
||
|
12 |
Total Phosphate |
0.020 and below |
Y=-250*X+100 |
|
0.021 - 0.160 |
Y=-142.857*X+97.86 |
||
|
0.161 - 0.40 |
Y=-104.1667*X+91.67 |
||
|
0.40 - 0.65 |
Y=-100*X+90 |
||
|
> 0.65 |
Y=-250*X+187.5 |
||
|
13 |
Iron |
0.10 and below |
Y=-50*X+100 |
|
0.11 - 0.30 |
Y=-100*X+105 |
||
|
0.31 - 0.50 |
Y=-125*X+112.5 |
||
|
0.50 - 1.0 |
Y=-50*X+75 |
||
|
> 1.0 |
Y=-25*X+50 |
||
|
14 |
Sulphate |
0 - 25 |
Y=100 |
|
26 -150 |
Y=-0.16*X+99 |
||
|
151 - 250 |
Y=-0.25*X+112.5 |
||
|
251 - 400 |
Y=-0.1667*X+91.67 |
||
|
401 - 1000 |
Y=-0.0156*X+31.25 |
||
|
15 |
Arsenic |
0 - 0.005 |
Y=100 |
|
> 0.005 - 0.01 |
Y=-4000*X+115 |
||
|
> 0.01 - 0.05 |
Y=-625*X+81.25 |
||
|
> 0.05 - 0.1 |
Y=-500*X+75 |
||
|
> 0.1 - 0.2 |
Y=-20.833*X+27.08 |
||
|
16 |
Total Coliform |
0 - 50 |
Y=-0.1*X+100 |
|
51 - 500 |
Y=-0.0444*X+97.22 |
||
|
501 - 5000 |
Y=-0.0056*X+77.78 |
||
|
5001 - 50000 |
Y=-0.0006*X+52.78 |
||
|
> 50000 |
Y=-0.0005*X+50 |
Assignment of Parameter Weights
Selection of parameter weight is one of the most important tasks. Therefore, due emphasis should be given to decide the weight of each parameter. The parameter which greatly impacts the quality of water shall be given higher weight and vice-versa. These weights have been decided based on the judgment of the authors and the experience gained from the literature. The weight factors of all the sixteen parameters range from 1 to 4 and are presented in Table 4.
Table 4: Assignment of significance weight to the water quality parameter
|
Sl. No. |
Parameter |
Weight Factor |
|
1 |
Turbidity |
1 |
|
2 |
Colour |
2 |
|
3 |
Total Dissolved Solids |
3 |
|
4 |
pH |
1 |
|
5 |
DO |
4 |
|
6 |
BOD |
2 |
|
7 |
Secchi Depth |
3 |
|
8 |
Total Hardness |
1 |
|
9 |
Chloride |
1 |
|
10 |
Fluoride |
3 |
|
11 |
Nitrate |
3 |
|
12 |
Total Phosphate |
2 |
|
13 |
Iron |
3 |
|
14 |
Sulphate |
2 |
|
15 |
Arsenic |
4 |
|
16 |
Fecal Coliform |
4 |
|
|
Total weight |
39 |
Aggregation of sub-indices - Overall Water Quality Index (OWQI)
In order to gauge the influence of each individual parameter on a common single scale, the score generated by each parameter was averaged-out. The following weighted average aggregation function is used for this purpose.
where wi = weight of the ith water quality parameter
Yi = sub-index value of the ith parameter
Based on the status of water quality, the index value range from 0 to 100 and is classified into five categories: heavily polluted (0-24), poor (25-49), fair (50-74), good (75-94) and excellent (95-100). The status of water corresponding to different OWQI values is presented in Table 5. If the index goes down, then it indicates that some of the water quality parameters are being affected due to any particular reason and suitable measures are needed to further improve the quality of water. Thus this index may be used as a guiding rule in management of quality of surface water resources.
Table 5: OWQI and corresponding class and status of water quality
|
Class |
OWQI Value |
Status of Water |
|
Heavily Polluted |
0 - 24 |
Unsuitable for All Purposes |
|
Poor |
25 - 49 |
Special Treatment (Special Treatment) |
|
Fair |
50 - 74 |
Needs Treatment (Filtration & Disinfection) |
|
Good |
75 - 94 |
Acceptable |
|
Excellent |
95 - 100 |
Pristine Quality |
Results and Discussion
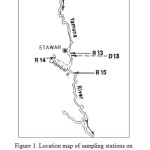
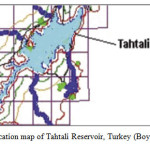
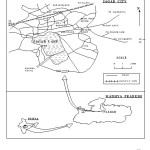
The proposed OWQI is used as an application for the estimation of the index of water quality of sampling sites at Etawah on Yamuna River and Sagar Lake in India and Tahtali Reservoir in Turkey. The data of these sampling locations is taken from the published literature1,3,20 in which the study area are well described as shown in Figures 1 to 3. An MS Excel 2007 based computer programme is developed for computation of the water quality indices both individual parameter-wise and an overall index. This programme also suggests the quality class and status of water based on the OWQI.
Applications of OWQI for Assessment of Water Quality of Surface Water Bodies
The OWQI was computed for Etawah sampling location on the Yamuna River, Tahtali Reservoir and Sagar Lake. Yamuna River and Sagar Lake falls in the northern and central part of India, respectively while Tahtali Reservoir falls in City of Izmir in the western part of Turkey (Figures 1 to 3). The water quality indices are first estimated parameter-wise and then OWQI is computed for each location (Table 6 to 8).
 |
|
 |
|
 |
|
Table 6: Observed water quality and corresponding indices at Etawah on the Yamuna River (June, 1997)
|
Parameter |
Value |
Indices |
|
pH |
8.65 |
50 |
|
Turbidity (NTU) |
ND |
100 |
|
Hardness (mg/L) |
270 |
100 |
|
TDS (mg/L) |
828 |
29 |
|
BOD5 (mg/L) |
3 |
100 |
|
DO (mg/L) |
7.9 |
94 |
|
Cl (mg/L) |
213 |
90 |
|
NO3 (mg/L) |
0.03 |
100 |
|
SO4 (mg/L) |
75 |
87 |
|
Total Coliform (MPN/100ml) |
2500 |
64 |
|
OWQI |
79 |
|
Table 7: Observed water quality and corresponding indices for the Tahtali Reservoir
|
Parameter |
Value |
Indices |
|
Arsenic (mg/L) |
0.0058 |
92 |
|
Fluoride (mg/L) |
0.792 |
100 |
|
Nitrate-N (mg/L) |
5.84 |
97 |
|
DO (mg/L) |
9.62 |
100 |
|
BOD5 (mg/L) |
4.16 |
61 |
|
Total Phosphorous as PO4 (mg/L) |
0.098 |
84 |
|
pH |
8.18 |
100 |
|
Total Coliform (CFU/100ml) |
170 |
90 |
|
OWQI |
92 |
|
Table 8: Observed water quality and corresponding indices for the Sagar Lake
|
Parameter |
Value |
Indices |
|
Secchi Depth (m) |
0.23 |
8 |
|
pH |
6.6 |
100 |
|
DO (mg/L) |
4.37 |
55 |
|
Hardness (mg/L) |
178.08 |
100 |
|
Chloride (mg/L) |
63.34 |
100 |
|
Nitrate (mg/L) |
9.76 |
95 |
|
Phosphate (mg/L) |
0.44 |
46 |
|
Iron (mg/L) |
1.71 |
7 |
|
BOD5 (mg/L) |
11.4 |
3 |
|
TDS (mg/L) |
378 |
100 |
|
OWQI |
5 |
|
It is observed from Table 6 that the OWQI is 79 for the Etawah location on Yamuna River which indicates that the water falls in Class “Good” and the quality of water is “Acceptable”. Similar is the case for the Tahtali Reservoir where OWQI is 92 (Table 6) and the quality is relatively better. In case of Sagar Lake, it is seen from Table 7 that the OWQI is 54 and the corresponding quality class is “Fair” and this water needs treatment (filtration and disinfection) before any use.
Conclusions
In this paper an Overall Water Quality Index (OWQI) is developed to provide a simple tool for assessment of quality of surface water resources for drinking water supply. The OWQI is developed based on National and International standards by considering sixteen parameters covering physical, chemical and biological aspects of water. The application of OWQI is demonstrated for three different sampling locations and status of water is described on the basis of computed index. This OWQI provides a simpler means for the water quality assessment and is very useful of decision makers, planners and field engineers for maintaining good health of surface water resources. The proposed index can also be used as a decision support tool for the water quality management.
Acknowledgement
Authors thank Director, National Institute of Hydrology for all the support and encouragement.
References
- Boyacioglu, H., Development of a water quality index based on a European classification scheme. Water SA, 33(1), 101-106 (2007).
- Khan, A. A., Paterson, R. & Khan, H. Modification and Application of the CCME WQI for the Communication of Drinking Water Quality Data in Newfoundland and Labrador. In: 38th Central Symposium on Water Quality Research, Canadian Association on Water Quality, Burlington, Canada (2003).
- Sargaonkar, A. &, Deshpande, V. Development of an overall index of pollution for surface water based on a general classification scheme in Indian context. Environmental Monitoring and Assessment, 89, 43-67 (2003).
- Bharti, N. & Katyal, D. Water quality indices used for surface water vulnerability assessment. International Journal of Environmental Sciences, 2(1): 154-173 (2011).
- Abbasi, S. A. Water quality indices, A state-of-the art. Journal of the Institution of Public Health Engineers, 1: 13-24 (1999).
- Horton, R. K. An index number system for rating water quality. Journal of Water Pollution Control Administration 37(3): 300 (1965).
- Brown, R. M., McClelland, N. I., Deininger, R. A. & Tozer, R. G. A Water Quality Index: Do We Dare?” Water Sewage Works, 117(10): 339-343 (1970).
- Landwehr, J. M. A statistical view of a class of water quality indices. Water Resources Research, 15(2): 460-468 (1976).
- Parti, L., Pavanello, R. & Pesarin, F. Assessment of surface water quality by single index of pollution. Water Research, 5: 741-751 (1971).
- Mc Duffie, B. & Haney, J. T. A proposed river pollution index. American Chemical Society, Division of Water, Air and Waste Chemistry, New York, NY (1973).
- Dinius, S. H. Social accounting system for evaluating water. Water Resources Research, 8(5), 1159-1177 (1972).
- Dee, N., Baker, J., Drobny, N., Duke, K. M., Whitman, I. & Fahringer, D. An environmental evaluation system for water resource planning. Water Resources Research, 9(3), 523–535 (1973).
- O’Cornor, F. M. The application of multi-attribute scaling procedures to the development of indices of water quality. Ph.D. Dissertation , University of Michigan (1972).
- Deininger, R. & Landwehr., J. M. A water quality index for public water supplies. School of Public Health, Univ. of Michigan, Ann Arbor (1971).
- Walski, T. M. & Parker, F. L. Consumers water quality index. Journal of Environmental Engineering Division, ASCE, 593-611 (1974).
- Stoner, J. D. Water quality indices for specific water use. U.S. Geological Survey, Reston, Y.A. Circular, 140-770 (1978).
- Nemerow, N. L., Sumitomo, H. Benefits of water quality enhancement. Syracuse, University, Syracuse, N.Y., Report No. 16110 DAJ (1970).
- Smith, D. G. Water quality indexes for use in New Zealand’s rivers and streams. Water Quality Centre Publication No. 12, Water Quality Centre, Ministry of Works and Development, Hamilton, New Zealand (1987).
- Viet, N. T. & Bhargava, D. S. Water quality and management Saigon river in Hochi Minch city, Indian Journal of Environmental Health, 31, 321 (1998).
- Singh, S., Kumar, B., Thakural, L. N. & Galkate, R. V. A comprehensive study on water balance, sedimentation and physico-chemical characteristics of Sagar Lake in India. Environment Monitoring and Assessment, 148 (1-4), 265-276 (2009).


