Effect of A Nitrogen-Fixing Actinorhizal Shrub on Herbaceous Vegetation in A Mixed Conifer Forest of Central Himalaya
Kiran Bargali1 , Nidhi Rani Maurya1 and S. S. Bargali1
http://dx.doi.org/10.12944/CWE.10.3.27
In this study, we examined the effect of a nitrogen-fixing shrub Coriaria nepalensis Wall on herb species composition, diversity and biomass. The effect was measured in terms of species richness, diversity and biomass of herb species in three sites varying in Coriaria density viz. site 1 (low Coriaria density; 20 ha-1), site-2 (medium Coriaria density; 120 ha-1) and site-3 (high Coriaria density 190 ha-1). Species richness was minimum at Site-1 (16 species), and maximum at site-2 (27 species). G. aparine dominated site-1 and Arthraxon sp dominated site-2 and 3. The individual herb density ranged between 0.40 - 42.40 m-2, and total herb density ranged between 138- 170.4 m-2 and was maximum at site-2. Value for species richness (27) and Shannon Index (3.72) was highest for medium Coriaria density site and lowest for low Coriaria density site. Simpson Index ranged between 0.11 and 0.14 and was lowest for site-2(medium Coriaria density) indicating that at this the dominance was shared by many species. Along the gradient of Coriaria density, maximum biomass was recorded at site-3 with highest Coriaria density and lowest at site-2 with medium Coriaria density. This may be due to the symbiotic nitrogen fixing ability of Coriaria that improve the habitat quality. The facilitative effect of C. nepalensis in terms of soil amelioration and herb growth can be used to regenerate degraded forest ecosystems.
Copy the following to cite this article:
Bargali K, Maurya N R, Bargali S. S. Department of Botany, DSB Campus Kumaun University, Nainital-263001(Uttarakhand). Curr World Environ 2015;10(3) DOI:http://dx.doi.org/10.12944/CWE.10.3.27
Copy the following to cite this URL:
Bargali K, Maurya N R, Bargali S. S. Department of Botany, DSB Campus Kumaun University, Nainital-263001(Uttarakhand). Available from: http://www.cwejournal.org/?p=13223
Download article (pdf) Citation Manager Publish History
Introduction
The herbaceous layer plays an important role in forest ecosystem; it contains the highest number of species and nutrient cycling (Gilliam, 2007; Jhariya et al., 2013, Parihaar et al., 2014). This layer is also responsible for approximately 12% of the Gross Photosynthetic Production (GPP) of a forest ecosystem (Bargali and Bargali, 2000; Muller, 2003). Herbaceous vegetation also affect regeneration of trees therefore, has important implications for the regeneration of trees (Chandra et al., 1989; Kittur et al., 2014; Rana et al., 2015). Species that have impacts on the distribution, amount and composition of resources in the environment either through their own physical structures or the artifacts they created are increasingly recognized as ecosystem engineers (Jones et al., 1994; Bargali et al., 2014, 2015). As reviewed extensively by Jones et al., (1994), ecosystem engineers are a taxonomically diverse group, with representatives including vertebrates, invertebrates, algae, nonvascular plants and higher plants (especially woody species).
Low nitrogen supply is a limiting factor for plant growth in most terrestrial ecosystems. N-fixing plants therefore, have the potential to facilitate surrounding vegetation by increasing soil N levels. Coriaria nepalensis Wall. is a common native shrub/under tree species of the Central Himalayan region between 1200 to 2500m elevations and is a successful colonizer of landslide-affected or freshly exposed rocky and eroded slopes. It is a nitrogen-fixing actinorhizal plant that forms root nodules with actinomycete Frankia (Bargali et al., 2003). The biological N-fixation in this species meets the relatively heavy demand for nitrogen in nutrient-poor degraded soils and can play key roles as ecosystem engineer by altering the physical environment beneath its canopy as well as characteristic of plant populations, communities and ecosystems (Shachak et al., 2008). It can also facilitate growth of associate plants therefore; can change the composition and structure of the forest.
In the present study, we examined whether herb species composition, diversity and biomass differed with increasing density of an actinorhizal shrub Coriaria nepalensis Wall in a mixed conifer forest of Central Himalaya, India.
Materials and Methods
The study area Nainital is located between 29o36’56”-29o36’79” N latitude and 79o46’03”-79o46’19” E longitude between 1600- 1850m above mean sea level in the Central Himalaya. This Site experienced a heavy land slide that occurred about 75-80 year ago (based on information collected from locals). For detailed study the area was divided into three sub sites (each with 1 ha area) varying in Coriaria colonisation in terms of density viz. site-1(low Coriaria density; 20 ind. ha-1), site-2 (medium Coriaria density; 120 ind. ha-1) and site-3 (high Coriaria density; 190 ind. ha-1). The study area was dominated by conifers like Pinus roxburghii, Cupressus torulosa (Fig. 1).
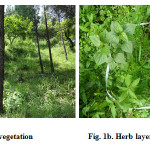 |
Figure 1a: Tree layer vegetation Figure 1b: Herb layer vegetation Click here to View figure |
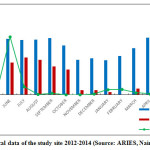
The climate of Nainital is characterized by long-cold often snowy winter and short summer. It is temperate and monsoon type (Singh and Singh, 1992) and the year has four distinct seasons viz., monsoon (July to September), post-monsoon (October to November), winter (December to January) and summer (April to mid-June). Climatic data for 2008–2009 were obtained from the State Observatory at Nainital. The annual average rainfall was 1853 mm of, 60% of which was occur in the rainy season and the mean daily temperature ranged from -2.0°C to 30.5°C (Source: ARIES, Nainital) (Fig. 2).
 |
|
The phytosociological analysis of herb species was conducted by placing 30 quadrats of 1m x 1m size at each site. The size and number of samples was determined following Saxena and Singh, (1980).Grasses were studied through tiller analysis. Each tiller of grass was considered as an individual plant and creeping plants were counted on the basis of presence of functional roots (Saxena and Singh, 1980)). The vegetational data were quantitatively analysed for abundance, density and frequency (Curtis and Mc Intosh, 1950). The Provenance value (PV) of herbs was determined as the sum of the relative frequency and relative density (Curtis, 1959). The ratio of abundance to frequency indicates regular distribution if < 0.025, random distribution between 0.025 to 0.05 and contagious distribution if >0.05 (Cottam and Curtis, 1956). Similarity between pairs of stands was calculated following (Muller – Dombois and Ellenberg, 1974) using species richness in different sites:
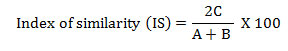
where, C is the common species in comparison sites; A the total number of species in site A and B the total number of species in site B.
Species diversity for each site was determined with the Shannon and Wiener, (1963) index:
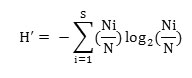
where, Ni is the density of species i and N is the total density of all species in that stand.
Concentration of dominance was measured by Simpson's index (Simpson, 1949),
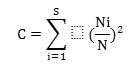
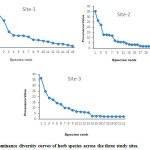
where, Ni and N were the same as for the Shannon-Wiener information function. The calculations of diversity index and concentration of dominance were made separately for herbs. Species richness was determined following Whittaker, (1972) by the total number of species in a given community and the equitability was calculated by Pielou, (1966). Dominance diversity curves (Whittaker, 1975) were employed to interpret the community organization in terms of resource share or niche space.
Results and Discussion
A total of 31 species distributed in 16 families were recorded from the study site. Family asteraceae had the maximum number of species (19.3% of the total species) while 12 families were represented by a single species each (Table 1). Site-1 had 16 species and 10 families, site-2 27 species and 18 families and site site-3 had 22 species and 13 species. Site-2 had the highest number of unique species (07) while site-1 had no unique species (Table 2). Twelve species were common to all the sites and accounted for 38.7% of the total species. G. aparine dominated site-1 and Arthraxon sp dominated site-2 and 3.On the basis of dominant and co-dominant species, site-1 represented G. aparine- C. versicolor community site-2 and site-3 represented Arthraxon -C. rotundus community. On the basis of percent similarity site-1 and site-2 was 34.88% similar, site-1 and site-3 was 36.84% similar and site-2 and site-3 was 34.69% similar in species composition.
The individual herb density ranged between 0.40 - 42.40 m-2, and total herb density ranged between 138- 170.4 m-2. The values are comparable with those reported earlier by Chandra et al., 2010 for forest of Garhwal Himalaya. At site-1 the total herb density was 159.2 m-2and the individual herb density ranged from 0.8 herbs m-2 for J. procumbens to 42 herbs m-2 for G. aprine. A/F ratio varied between 0.03 and 0.29. Nine species (G.nepalense, J. procumbens, A. bidentata, O. corniculata, E. adenophorum, A. annua, C. rotundus, C. dactylon and P. gerardiana) showed the random distribution and remaining species showed the contagious distribution.
Table 1: Provenence value of herbaceous species as affected by Coriaria density.
|
Species |
Family |
Coriaria density |
||
|
Low |
Medium |
High |
||
|
Achyranthes bidentata Blume |
Amaranthaceae |
9.22 |
11.93 |
18.83 |
|
Ajuga bracteosa Wall.ex Benth. |
Lamiaceae |
- |
1.98 |
2.66 |
|
Artemisia annua Linn. |
Asteraceae |
12.84 |
5.74 |
2.08 |
|
Arthraxon sp Thunb. |
Poaceae |
14.39 |
35.49 |
36.85 |
|
Bidens pilosa L. |
Asteraceae |
14.78 |
13.10 |
13.23 |
|
Cardamine impatiens Linn. |
Brassicaceae |
- |
- |
9.95 |
|
Cerastium vulgatum L. |
Rosaceae |
- |
2.22 |
- |
|
Clematis buchananiana D.C |
Ranunculaceae |
- |
1.98 |
2.08 |
|
Craniotome versicolor Reichb. |
Lamiaceae |
32.21 |
22.45 |
17.33 |
|
Cynodon dactylon(L.) Pers. |
Poaceae |
5.49 |
1.98 |
- |
|
Cyperus rotundus L. |
Cyperaceae |
18.97 |
26.55 |
24.92 |
|
Dioscorea deltoidea Kunth. |
Dioscoreaceae |
- |
3.39 |
- |
|
Erigeron bellidiodes L. |
Asteraceae |
- |
1.98 |
10.24 |
|
Eupatorium adenophorum Spreng. |
Asteraceae |
8.96 |
12.85 |
7.97 |
|
Fragaria vesca Linn. |
Rosaceae |
- |
3.50 |
- |
|
Galium aparine L. |
Rubiaceae |
39.54 |
3.39 |
2.08 |
|
Galium elegans Wall. ex Roxb. |
Rubiaceae |
7.10 |
4.80 |
- |
|
Geranium nepalense Sweet |
Geraniaceae |
14.45 |
3.39 |
2.37 |
|
Gerbera gossypina (Royle) Beauv. |
Asteraceae |
- |
1.75 |
2.66 |
|
Justicia procumbens L. var simplex (D.Don) |
Acanthaceae |
2.12 |
7.36 |
5.89 |
|
Lapidagathis cristataNees |
Acanthaceae |
2.87 |
5.85 |
6.23 |
|
Micromeria biflora (Buch.-Ham.ex D.Don Benth. |
Lamiaceae |
4.48 |
1.98 |
2.66 |
|
Oenothera rosea Ait. |
Onagraceae |
- |
1.75 |
- |
|
Origanum vulgare L. |
Lamiaceae |
- |
- |
14.30 |
|
Oxalis corniculata L. |
Oxalidaceae |
8.11 |
13.10 |
2.08 |
|
Potentilla gerardiana Lindl.ex Lehm. |
Rosaceae |
4.48 |
- |
2.37 |
|
Rubia cordifolia L. |
Rubiaceae |
- |
- |
6.47 |
|
Selaginella sp. |
Selaginellaceae |
- |
6.21 |
- |
|
Tridax procumbens L. |
Asteraceae |
- |
1.75 |
6.81 |
|
Veronica beccabunga L. |
Plantaginaceae |
- |
3.50 |
- |
|
Viola canescens Wall.ex Roxb. |
Violaceae |
- |
1.75 |
- |
At site-2 the total herb density was170.40 m-2and the individual herb density ranged from0.40 m-2 for V. canescens, T. procumbens, G.gossypina, and O.rosea to 42.40 m-2 for Arthraxon sp. A/Fratio varied between 0.10 and 2.00, all the species showed the contagious distribution. At site-3 the total herb density was138.0 herbs m-2and the individual herb density ranged from0.40 m-2 for G.aparine, A. annua, C.buchananiana, R. cordifolia and 33.6 m-2 for Arthraxon sp., A/F ratio varied between0.03 and 0.93. L. cristata showed random distribution while remaining species showed contagious distribution. In the present study, maximum number of herb species were contagiously distributed as reported for other Himalyan forest by Singh and Singh, (1992); Pande, (2012); Bargali et al.,(2013).
Dominance diversity curves (on the basis of PV) have been drawn to interpret the community organization in term of resource share and niche space (Fig 3). At each site, two or three species indicated dominance while rest of the species showed relatively greater equitable share of resources.
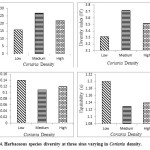
Analysis of variance indicated that the differences in species richness, Shannon index, Simpson index, evenness due to Coriaria density were significant (Table 4). Value for species richness (27) and Shannon Index (3.72) was highest for medium Coriaria density site and lowest for low Coriaria density site (Fig 4). Simpson Index ranged between 0.11 and 0.14 and lowest for site-2(medium Coriaria density) indicating that at this the dominance was shared by many species (Fig 4). Equitability also followed the same trend.
Herb Layer Biomass
At site-1 total herb biomass was 439.22 gm-2 of which 264.04 gm-2 was above ground and 175.18 gm-2 was below ground (Table 4).C. versicolor contributed the highest biomass (102.4 gm-2) while P. girardiana contributed lowest biomass (0.12 gm-2). At site-2 herb layer biomass was 312.57 gm-2 of which 239.39 gm-2 was above ground and 73.06 gm-2 was below ground. Maximum biomass was contributed by Arthraxon sp. (157.72 gm-2) and minimum biomass was contributed by G. gossypina and V. canescens (0.01 gm-2).
 |
|
Herb layer total biomass at site-3 was 443.65 gm-2, of which 329.74 gm-2 was above ground and 130.41 gm-2 was below ground (Table 4). Among species, maximum biomass was contributed by Arthraxon sp. (108.19 gm-2 ) and minimum biomass was contributed G. aparine (0.02 gm-2). Along the gradient of Coriaria density, maximum biomass was recorded at site-3 with highest Coriaria density and lowest at site-2 with medium Coriaria density (Table 4). This may be due to the symbiotic nitrogen fixing ability of Coriaria that improve the habitat quality.
 |
|
Table 2: Biomass (gm-2) of different component of herbs species in mixed conifer forest as affected by Coriaria density.
|
Species
|
Biomass |
Coriaria density |
||
|
Low |
Medium |
High |
||
|
Achyranthes |
D |
4.40 |
10.00 |
11.20 |
|
AGB |
3.61 |
8.40 |
26.99 |
|
|
BGB |
2.99 |
8.30 |
30.46 |
|
|
Total |
6.60 |
16.70 |
57.45 |
|
|
Ajuga bracteosa |
D |
- |
0.80 |
1.20 |
|
AGB |
0.19 |
0.26 |
||
|
BGB |
0.19 |
0.25 |
||
|
Total |
0.38 |
0.51 |
||
|
Artemisia annua |
D |
7.60 |
7.20 |
0.40 |
|
AGB |
9.88 |
2.30 |
0.48 |
|
|
BGB |
18.77 |
0.50 |
0.99 |
|
|
Total |
28.65 |
2.80 |
1.47 |
|
|
Arthraxon sp. |
D |
15.20 |
42.40 |
33.60 |
|
AGB |
13.38 |
157.72 |
108.19 |
|
|
BGB |
4.41 |
21.62 |
17.14 |
|
|
Total |
17.79 |
179.34 |
125.33 |
|
|
Bidens pilosa |
D |
18.40 |
12.00 |
8.40 |
|
AGB |
0.92 |
0.84 |
4.87 |
|
|
BGB |
0.36 |
0.36 |
1.59 |
|
|
Total |
1.28 |
1.20 |
6.46 |
|
|
Cardamine impatiens |
D |
- |
- |
8.80 |
|
AGB |
10.56 |
|||
|
BGB |
7.48 |
|||
|
Total |
18.04 |
|||
|
Cerastium vulgatum |
D |
- |
1.20 |
- |
|
AGB |
0.61 |
|||
|
BGB |
0.41 |
|||
|
Total |
1.02 |
|||
|
Clematis buchananiana |
D |
- |
0.80 |
0.40 |
|
AGB |
0.03 |
1.64 |
||
|
BGB |
0.03 |
0.96 |
||
|
Total |
0.06 |
2.60 |
||
|
Craniotome versicolor |
D |
25.60 |
17.60 |
11.60 |
|
AGB |
102.4 |
21.29 |
17.75 |
|
|
BGB |
106.88 |
19.89 |
23.89 |
|
|
Total |
209.28 |
41.18 |
41.64 |
|
|
Cynodon dactylon |
D |
3.60 |
0.80 |
|
|
AGB |
5.45 |
0.04 |
||
|
BGB |
1.44 |
0.12 |
|
|
|
Total |
6.89 |
0.16 |
|
|
|
Cyperus rotundus |
D |
14.80 |
22.00 |
19.60 |
|
AGB |
6.07 |
24.20 |
39.00 6.82 45.82 |
|
|
BGB |
6.66 |
10.12 |
||
|
Total |
12.73 |
34.32 |
||
|
Dioscorea deltoidea |
D |
- |
3.30 |
- |
|
AGB |
3.52 |
|||
|
BGB |
3.52 |
|||
|
Total |
7.04 |
|||
|
Erigeron bellidioides |
D |
- |
0.80 |
9.20 |
|
AGB |
1.54 |
40.11 |
||
|
BGB |
0.37 |
10.21 |
||
|
Total |
1.91 |
50.32 |
||
|
Eupatorium adenophorum |
D |
4.00 |
6.40 |
3.60 |
|
AGB |
57.44 |
9.98 |
32.65 |
|
|
BGB |
19.84 |
1.60 |
5.51 |
|
|
Total |
77.28 |
11.58 |
38.16 |
|
|
Fragaria vesca |
D |
- |
0.80 |
- |
|
AGB |
0.06 |
|||
|
BGB |
0.02 |
|||
|
Total |
0.08 |
|||
|
Galium aparine |
D |
42.40 |
3.20 |
0.40 |
|
AGB |
30.10 |
0.03 |
0.02 |
|
|
BGB |
5.80 |
0.03 |
0.01 |
|
|
Total (gm-2) |
35.90 |
0.06 |
0.03 |
|
|
Galium elegans |
D |
3.60 |
5.60 |
- |
|
AGB (gm-2) |
30.10 |
1.34 |
||
|
BGB |
5.80 |
0.61 |
||
|
Total |
35.90 |
1.95 |
||
|
Geranium nepalense |
D |
7.60 |
3.20 |
0.80 |
|
AGB |
2.43 |
0.22 |
0.30 |
|
|
BGB |
0.73 |
0.22 |
0.11 |
|
|
Total |
3.16 |
0.44 |
0.41 |
|
|
Gerbera gossypina |
D |
- |
0.40 |
1.20 |
|
AGB |
0.01 |
1.69 |
||
|
BGB |
0.004 |
14.81 |
||
|
Total |
0.014 |
16.50 |
||
|
Justicia simplex |
D |
0.80 |
4.80 |
3.20 |
|
AGB |
0.29 |
2.69 |
1.63 |
|
|
BGB |
0.76 |
2.59 |
1.69 |
|
|
Total |
1.05 |
5.28 |
3.32 |
|
|
Lapidagathis cristata |
D |
2.00 |
4.80 |
1.20 |
|
AGB |
0.72 |
1.00 |
0.80 |
|
|
BGB |
0.40 |
0.67 |
0.46 |
|
|
Total |
1.12 |
1.67 |
1.26 |
|
|
Micromeria biflora |
D |
2.00 |
0.80 |
1.20 |
|
AGB |
0.40 |
0.02 |
1.07 |
|
|
BGB |
0.08 |
0.01 |
0.12 |
|
|
Total |
0.48 |
0.03 |
1.19 |
|
|
Oenothera rosea |
D |
- |
0.40 |
- |
|
AGB |
0.10 |
|||
|
BGB |
0.04 |
|||
|
Total |
0.14 |
|||
|
Origanum vulgare |
D |
- |
- |
14.80 |
|
AGB |
34.04 |
|||
|
BGB |
6.05 |
|||
|
Total |
40.09 |
|||
|
Oxalis corniculata |
D |
5.20 |
12.00 |
0.40 |
|
AGB |
0.73 |
3.00 |
0.08 |
|
|
BGB |
0.16 |
1.56 |
0.004 |
|
|
Total |
0.89 |
4.56 |
0.084 |
|
|
Potentilla gerardiana |
D |
2.00 |
- |
0.80 |
|
AGB |
0.12 |
1.01 |
||
|
BGB |
0.10 |
0.68 |
||
|
Total |
0.22 |
1.69 |
||
|
Rubia cordifolia |
D |
- |
- |
4.00 |
|
AGB |
6.40 |
|||
|
BGB |
1.08 |
|||
|
Total |
7.48 |
|||
|
Selaginella sp |
D |
- |
8.00 |
- |
|
AGB |
0.24 |
|||
|
BGB |
0.24 |
|||
|
Total |
0.48 |
|||
|
Tridax procumbens |
D |
- |
0.40 |
2.00 |
|
AGB |
0.01 |
0.20 |
||
|
BGB |
0.01 |
0.10 |
||
|
Total |
0.02 |
0.30 |
||
|
Veronica beccabunga |
D |
- |
0.40 |
- |
|
AGB |
0.01 |
|||
|
BGB |
0.03 |
|||
|
Total |
0.04 |
|||
|
Viola canescens |
D |
- |
0.40 |
- |
|
AGB |
0.004 |
|||
|
BGB |
0.004 |
|||
|
Total |
0.008 |
|||
Conclusion
The herb layer vegetation is a major component for any forest ecosystem. It is critical to many system ecological processes by altering nutrient cycles, protecting erosion and contributing to the communities diversity and are considered as good ecological indicators of forest health. In the present study, the species richness, density and biomass of herbaceous species were remarkably high in site with medium Coriaria density indicating that Coriaria provide favourable microsites on degraded forests and facilitate the colonization and growth of herb species. This nursing behavior of Coriaria can be used to restore degraded forest ecosystems of Central Himalaya.
Acknowledgment
Financial support from ICSSR (F.No. 02/66/2014-15/RPR), New Delhi is gratefully acknowledged.
References
- Bargali, K., Bisht, P., Khan, A. and Rawat, Y.S. Diversity and regeneration status of tree species at Nainital Catchment, Uttarakhand, India. International Journal of Biodiversity and Conservation. 5(5): 270-280 (2013).
- Bargali, K., Joshi, B., Bargali, S.S. and Singh, S. P. Diversity within Oaks. International Oaks. 25: 57-70 (2014).
- Bargali, K., Joshi, B., Bargali, S.S. and Singh, S. P. Oaks and the Biodiversity They Sustain. International Oaks. 26:65-76 (2015).
- Bargali, S.S. and Bargali, K. Diversity and biomass of the under story vegetation in an age series of Eucalyptus tereticornis International Journal of Ecology and Environmental Sciences. 26: 173-181 (2000).
- Bargali, K., Joshi, B. and Goel, D. Impact on soil characteristics and understorey vegetation of Coriaria nepalensis in natural landslide area. Ecoprint. 10(1): 43-46 (2003).
- Chandra, J., Rawat, V. S., Rawat, Y. S. and Ram, J. Vegetational diversity along an altitudinal range in Garhwal Himalaya. International Journal of Biodiversity and Conservation. 2(1):14-18 (2010).
- Chandra, R., Upadhyay, V. P. and Bargali, S. S. Analysis of herbaceous vegetation under oak and pine forests of Central Himalaya. Environment & Ecology. 7: 521-525 (1989).
- Cottom, G. and Curtis, J. T. The use of distance measures in phytosociological sampling. 35:451-460 (1956).
- Curtis, J. T. and McIntosh, R. P. The interrelations of certain analytic and synthetic phytosociological characters. 31:434-455 (1950).
- J. T. The Vegetation of Wisconsin. An ordination of plant communities. The University of Wisconsin Press, Madison.WI (1959).
- Gilliam, F.S. 2007. The ecological significance of the herbaceous layer in temperate forest ecosystems. Bioscience. 57: 845-858.
- Jhariya, M. K., Bargali, S. S., Swamy, S. L. and Oraon, P. R. Herbaceous diversity in Rowghat, Narayanpur District of Chhattisgarh, India. Journal of Plant Development Sciences. 5 (4): 385-393 (2013).
- Jones, C.G., Lawton, J. H. and Shachak, M. Organisms as ecosystem engineers. Oikos. 69: 373-386 (1994).
- Kittur, B., Swamy, S. L., Bargali, S. S. and Jhariya, M. K. Wildland Fires and Moist Deciduous Forests of Chhattisgarh, India: Divergent Component Assessment. Journal of Forestry Research. 25(4): 857-866 (2014).
- Mueller-Dombois, D. and Ellenburg, H. Aims and methods of vegetation Ecology. Jhon Wiley and Sons. Inc. (1974).
- Muller, R.N. Nutrient relation of the herbaceous layer in deciduous forest ecosystems: In: Gillam, F.S., Roberts, M.R. (eds) The herbaceous layer in forests of Eastern North America. Oxford University Press, New York pp 15-37 (2003).
- Pande, R. An assessment of floristic diversity in an oak forest of Nainital in relation to biotic disturbance. Ph.D. Thesis, Kumaun University, Nainital (2012).
- Parihaar, R.S., Bargali, K. and Bargali, S.S. Diversity and uses of Ethno-medicinal plants associated with traditional agroforestry systems in Kumaun Himalaya. Indian Journal of Agricultural Sciences. 84(12):1470-1476 (2014).
- Pielou, E.C. The measurement of diversity in different types of biological collections. Journal of Theoretical Biology. 13:131-134 (1996)
- Rana, S., Bargali, K. and Bargali S. S. Assessment of plant diversity, regeneration status, biomass and carbon stock in a Central Himalayan cypress forest. International Journal of Biodiversity & Conservation. 7(6):321-329 (2015).
- Saxena, A. K. and Singh, J. S. Analysis of forest grassland vegetation in a part of Kumaun Himalaya. Indian Journal of Range Management. 1:13-32 (1980).
- Shachak, M. Boeken, B., Groner, E., Kedmon, R., Lubin, Y., Meron, E., NeEman, G. Perevolotsky, A., Shkedy, Y. and Ungar, E.D. Woody species as landscape modulators and their effects on biodiversity patterns. Bioscience. 58: 209-221 (2008).
- Shannon, C. E. and Weiner, W. The mathematical theory of communication. University of Illinois Press, Urbana (1963).
- Singh, J.S. and Singh, S.P. Forests of Himalaya: structure, function and impact of man. Gynodaya Prakashan, Nainital (1992).
- Simpson, E. H. Measurment of diversity. Nature. 163: 688 (1949).
- Whittaker, R. H. Evolution and measurement of species diversity. 21: 213-251 (1972).
- Whittaker, R.H. Communities and ecosystem. MacMillan Publisher (1975).


