Fast Removal of Co2+ and Ni2+ from Aqueous Solution Using Partial Carbonized Nanoporous Resin
Imed Ghiloufi1,2 *
http://dx.doi.org/10.12944/CWE.10.3.02
Partial carbonized nanoporous resin (PCNR-150), based on organic xerogel compounds, was prepared at 150 ºC by sol–gel method from pyrogallol and formaldehyde mixtures in water using perchloric acid as catalyst. The PCNR-150 was characterized by scanning electron microscopy, transmission electron microscopy, X-ray diffraction, Fourier transformed infrared spectroscopy (FTIR) and nitrogen porosimetry. The metal uptake characteristics were explored using well-established and effective parameters including pH, contact time, initial metal ion concentration, and temperature. Optimum adsorptions of Co2+ and Ni2+, using PCNR-150 as adsorbent, were observed at pH 5 and 7, respectively. Langmuir model gave a better fit than the other models, and kinetic studies revealed that the adsorption is fast and its data are well fitted by the pseudo-second-order kinetic model and thermodynamic properties, i.e., ΔGo, ΔHo, and ΔSo, showed that adsorption of Co2+ and Ni2+ onto PCNR-150 was endothermic, spontaneous and feasible in the temperature range of 300–328 K.
Copy the following to cite this article:
Ghiloufi I. Fast Removal of Co2+ and Ni2+ from Aqueous Solution Using Partial Carbonized Nanoporous Resin. Curr World Environ 2015;10(3) DOI:http://dx.doi.org/10.12944/CWE.10.3.02
Copy the following to cite this URL:
Ghiloufi I. Fast Removal of Co2+ and Ni2+ from Aqueous Solution Using Partial Carbonized Nanoporous Resin. Available from: http://www.cwejournal.org/?p=13265
Download article (pdf) Citation Manager Publish History
Introduction
There are various methods for removing heavy metals from waste water including chemical precipitation, membrane filtration, ion exchange, liquid extraction or electrodialysis (Sitting 1981; Patterson 1985). However, these methods are not widely used due to their high cost and low feasibility for small-scale industries (Sohail et al. 1999). In contrast, adsorption technique is by far the most versatile and widely used. Several metal-retaining resin, containing a variety of complexion or chelating ligands, have been reported to efficiently remove heavy metals (Genc et al. 2002; Lebrun et al. 2007). Synthetic polymers containing amino, thio, oxo, carboxyl, phosphoryl, and other group have been developed. In particular, the amino/carboxyl group on an adsorbent has been found to be one of the most effective chelate functional groups for adsorption or removal of heavy metal ions from an aqueous solution (Rivas et al. 2003; Kas goz 2006; Chen et al. 2007). It has also been reported that the amine groups can provide reactive sites for specific adsorption of various metal ions (Jin et al. 2002; Li et al. 2005; Yang et al. 2010).
An efficient sorbent with both high capacity and fast rate adsorption should have functional groups and large surface area (Huang et al. 2011). Unfortunately, most current inorganic sorbents rarely have both at the same time. On the contrary, organic polymer, polyphenylenediamine, holds a large amount of polyfunctional groups (amino and imino groups) can effectively adsorb heavy metal ions, whereas their small specific surface area and low adsorption rate limit their application. Therefore, new sorbents with both polyfunctional groups and high surface area are still expected. More recently, the development of hybrid sorbents has opened up the new opportunities of their application in deep removal of heavy metals from water (Pan et al. 2009; Zhao et al. 2011). Polymer-layered silicate nanocomposites (Pavlidou et al. 2008) have attracted both academic and industrial attention because they exhibit dramatic improvement in properties at very low filler contents. The hybrid polymers were synthesized from the ring-opening polymerization of pyromellitic acid dianhydride (PMDA) and phenylaminomethyl trimethoxysilane (PAMTMS) (Liu et al. 2010).
In our previous works, nanoporous composites (Ghiloufi et al. 2015-a) and nanoporous carbon (Ghiloufi et al. 2015-b) were synthesized by sol-gel method at different pyrolysis temperatures and were used for the uptake of Cr (VI), Cd(II), Co(II) and Ni(II) from aqueous solution. In these studies, the pyrolysis temperatures of adsorbents varied from 650 ºC to 1000ºC, and the obtained results showed that the adsorption capacities of adsorbents increases when the pyrolysis temperature decreases. For this reason in this work we prepared by sol-gel method combined with a furnace firing in nitrogen atmosphere a partial carbonized nanoporous resin (PCNR-150) with a pyrolysis temperature equal to 150 ºC, and the principal objective of this study is to obtain a highly efficient sorbent for the uptake of Co2+ and Ni2+ from aqueous solution.
Material and Methods
Preparation and characterization of the PCNR-150
The preparation of PCNR-150 structure has been done in two steps. In the first one, organic xerogels were prepared by mixing formaldehyde (F) with dissolved pyrogallol (P) in water (W) solution and using perchloric acid as catalyst. The stoichiometric P/F and P/W molar ratios were 1/3 and 1/6, respectively. The wet gel was formed in few seconds. In the second step, the obtained product was dried in humid atmosphere at 50 ºC for 2 weeks. To obtain a structured xerogel, the wet gel was transferred in an incubator and dried at 150 ºC at a heating rate of 10 ºC/day. The drying temperature was then maintained for 2 days and finally, the sample was cooled. Figure 1 exhibits the reaction of the polymerization of pyrogallol and formaldehyde.
The synthesized product was characterized using a JEOL JSM-6300 scanning electron microscope (SEM) and a JEM-200CX transmission electron microscope (TEM). The specimens for TEM were prepared by putting the as-grown products in ethyl alcohol and immersing them in an ultrasonic bath for 15 min, then dropping a few drops of the resulting suspension containing the synthesized materials onto TEM grid. The X-ray diffraction (XRD) patterns of PCNR-150 were carried out by a Bruker D5005 diffractometer, using Cu K radiation (λ=1.5418 Å). The nitrogen adsorption–desorption isotherm of PCNR-150 was recorded by using Micrometrics ASAP2020 equipment. Fourier transformed infrared spectroscopy (FTIR) is a beneficial method for the determination of surface functional groups of the PCNR-150. In this study, the functional groups of PCNR-150 were detected with Perkin Elmer Precisely Spectrum one. The FTIR analyses were carried out KBr pellet method.
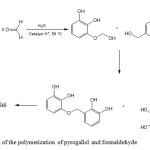 |
Figure 1: Reaction of the polymerization of pyrogallol and formaldehyde Click here to View figure |
Adsorption Experiments
Nickel nitrate (Ni(NO3)2) and cobalt nitrate (Co(NO3)2) were used for the preparation of Ni2+ and Co2+ stock solutions (1000 mg.L-1) in distilled water. The initial metal ion concentrations ranged from 20 to 140 mg/L. The pH of each solution was adjusted to the required value with HCl or NaOH before mixing the adsorbent. Adsorption experiments were carried in an Erlenmeyer flask by taking 10 mg of PCNR-150 in a 25 mL of metal solution at the desired temperature (25±1 â—¦C) and pH. The flasks were agitated on shaker for 24 h, which is more than ample time for adsorption equilibrium. The amount of metal adsorbed was determined by the difference between the initial metal ion concentration and the final one after equilibrium was reached. The residual Co2+ and Ni2+ concentrations were measured by SPECTRO GENESIS inductively coupled plasma-atomic emission spectrometry ICP-OES.
The results are given as a unit of adsorbed and unadsorbed metal ion concentration per gram of adsorbent in solution at equilibrium and calculated by Eq. (1):
where m is the weight of adsorbent (g), qe the adsorbed metal ion quantity per gram of adsorbent at equilibrium (mg/g), Co the initial metal concentration (mg/L), Ce the metal concentration at equilibrium (mg/L) and V is the working solution volume (L). The removal percentage was calculated by Eq. (2):

Results and Discussion
Adsorbent Characterizations
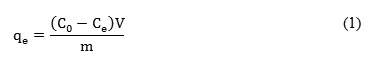
Figure 2 exhibits the XRD patterns of the extracted product as prepared after heat drying at 150 oC in natural atmosphere. According to this diffractogram, the samples is partly amorphous, because the presence of small band centered at around 25o, corresponding to (0 0 2) hkl plan, the most intensive diffraction peak of crystalline graphite phase.
The adsorption–desorption isotherms of the sample is of type I in the Brunauer, Emmett and Teller (BET) classification, and characteristic of microporous solid. The microporous specific surface area is 562 m2/g determined by the conventional BET method, with micropore volume of about 0.27 cm3/g. The mean micropore size determined from BET surface area and the pore volume in the approximation of cylindrical pores is close to 2 nm.
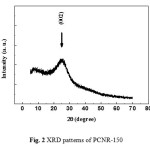
Figure 3-a displays the SEM micrographs of PCNR-150 sample; particles with 1–5 μm in diameter appear to coagulate together leaving little space between them. The surface area and pore volume of this carbon indicate that these particles are essentially microporous. These results are consistent with porosity measurements. TEM micrograph of the PCNR-150 (Figure 3-b) presents nanospheres inside microparticles. It is clearly
 |
|
 |
Figure 3: a- SEM micrographs of PCNR-150. b- TEM micrographs of PCNR-150. Click here to View figure |
shown that the microparticles consist of series of spherical nanoparticles with diameters in the range of 10 nm. These particles are arranged in a three-dimensional network. The TEM data confirm that the interconnected solid nanoparticles comprise an open-celled network with continuous nanodimension porosity. These observations are also consistent with porosity measurements.
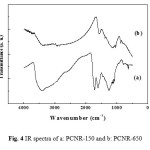
The IR transmission spectra of PCNRs prepared at pyrolysis temperature equal to 150°C (PCNR-150) and 650°C (PCNR-650) are presented in Figure 4. PCNR-650 is the nanoporous carbon used in our previous work (Ghiloufi et al. 2015-b). The spectrum of PCNR-150 contained a sharp bands around 1720, 1260 and 1137 cm-1 corresponding respectively to C=O, C=C and benzenes stretching vibrations. Two bands around 1350 and 1560 cm-1 correspond to C=C aromatic vibration. A large O-H vibration condition is observed in the high-energy region around 3300 cm-1. The same peaks of PCNR-150 were observed in the sample PCNR-650, and the only difference is the decay of the band around 1720 cm-1 corresponding to C=O. The peaks of the sample PCNR-650 are narrower than in sample PCNR-150, which indicates that the product was in partly polymer phase at 150°C and transformed to partially carbon phase after pyrolysis at 650°C.
Effect of Pyrolysis Temperature
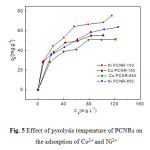
Nickel and cobalt adsorption isotherms are obtained by varying the initial concentrations of each metal from 20 to 140 mg/L at room temperature, by fixing pH at at 6.5, and by using a masses of PCNRs (PCNR-150 and PCNR-650) equals to 10 mg. Figure 5 depicts the influence of pyrolysis temperature of PCNRs on the removal of Ni2+ and Co2+. This figure shows that the sorption capacity of PCNRs decreases when the pyrolysis temperature increases, and PCNR-150 is more efficient adsorbent for Ni2+ and Co2+ removal than PCNR-650. The decreases of sorption capacity of PCNRs was due to the decay of functional carbonyl group (C=O), although the increases of the specific surface areas of PCNRs from 560 m2/g (for PCNR-150) to 720 m2/g (for PCNR-650) (Ghiloufi et al. 2015-b). Hence the effect of the functional carbonyl group of adsorbent is more important than the effect of specific surface areas on the adsorption of cobalt and nickel from aqueous solution.
 |
|
 |
|
Effect of pH
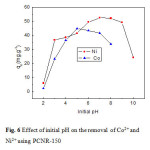
Figure 6 depicts the effect of initial pH on the removal of Co2+ and Ni2+ using PCNR-150. This figure shows that metal adsorption by PCNR-150 increases with increasing pH reaching a maximum and then showed a rapid decline in adsorption. For cobalt, the sorption capacity increased significantly and reached 44.67 mg/g at pH 5, then decreased with increasing pH solution. The effect of pH on nickel sorption shows a similar increase in sorption capacity. A sorption capacity of 52.29 mg/g was achieved at pH 7. The low metal sorption at acid solution may be explained on the basis of active sites being protonated, resulting in a competition between H+ and M2+ for occupancy of the binding sites (Tobin et al. 1984). But for pH values from 7 to 10, lower adsorption capacity was observed for cobalt and nickel; this might be due to the precipitation of cobalt and nickel ions at higher pH values.
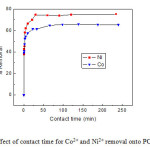
Effects of contact time
Figure 7 depicts the effect of the contact time on the sorption of Co2+ and Ni2+ by PCNR-150. As can be seen from this figure, with the beginning of adsorption, the uptake of metal ions increased quickly, and only after 20 min, the process of adsorption reached equilibrium. After this equilibrium period, the amount of adsorbed metal ions did not significantly change with time.
Kinetic Models
The integrated linear form of the pseudo first-order equation can be expressed as follows:
where qe (mg.g−1) and qt (mg.g−1) are the adsorption capacity at equilibrium and at time t (min), respectively, k1 (min−1) is the rate constant of pseudo first-order adsorption. The straight line plots of ln (qe−qt) against t were used to determine the rate constant, k1, qe, and correlation coefficient R2 values of the metal ions.
 |
|
 |
|
The integrated linear form of the pseudo second-order equation can be expressed as follows:
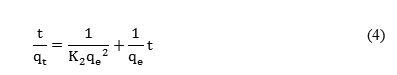
where k2 (g. mg−1. min−1) is the rate constant of pseudo-second order adsorption. The equilibrium adsorption amount (qe) and the pseudo second-order rate parameters (k2) are calculated from the slope and intercept of plot of t/qt versus t. Table 1 give the kinetic parameters obtained from pseudo-first-order and pseudo-second-order kinetic model for Co2+ and Ni2+ adsorption on PCNR-150.
It can be concluded from the R2 values in Table 1 that the sorption mechanism of Co2+ and Ni2+ does not follow the pseudo-first-order kinetic model. Moreover, the experimental values of qe,exp are not in good agreement with the theoretical values calculated (qe1, cal) from Eq. (3). Therefore, the pseudo-first-order model is not suitable for modeling the sorption of Co2+ and Ni2+ by PCNR-150. However, for the pseudo-second-order, the R2 value is 0.999 and the theoretical qe2, cal values were closer to the experimental qe, exp values (Table 1). Based on these results, it can be concluded that the pseudo-second-order kinetic model provided a good correlation for the adsorption of Co2+ and Ni2+ by PCNR-150 in contrast to the pseudo-first-order model.
Table 1: Adsorption kinetic model rate constants for Co2+ and Ni2+ adsorption on PCNR-150
|
Ion |
Pseudo-first-order |
Pseudo-second-order |
|||||
|
qe, exp (mg/g) |
k1 (1/min) |
qe1, cal (mg/g) |
R2 |
k2 (g/mg.min) |
qe2, cal (mg/g) |
R2 |
|
|
Ni2+ |
39.11 |
0.0015 |
3.512 |
0.133 |
-0.045 |
36.101 |
0.999 |
|
Co2+ |
36.695 |
0.0016 |
2.493 |
0.121 |
-0.427 |
35.087 |
0.999 |
Adsorption Isotherms
The equilibrium adsorption isotherms are the promising data because they determine how much adsorbent is required quantitatively for enrichment of an analyte from a given solution. Nickel and cobalt adsorption isotherms are obtained by varying the initial concentration of each metal (20–140 mg/L) at room temperature. The plot of the nickel and cobalt adsorption capacity against their equilibrium concentration is shown in Figure 5. The value of qe increases sharply at low equilibrium concentrations, whereas at higher values of Ce, the increase of qe is slowed down. An adsorbate concentration gradient acts as a driving force for the intraparticle transport, which enhances the diffusion of the adsorbate molecule to the surface sites for the ultimate attachment.
Three models were used to fit the experimental data, Langmuir isotherm, Freundlich isotherm, and Temkin isotherm.
Langmuir isotherm
The linear form of the Langmuir isotherm model is described as:
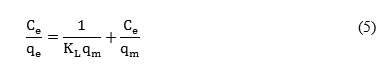
where KL is the Langmuir constant related to the energy of adsorption and qm is the maximum adsorption capacity (mg g−1). The slope and intercept of plots of Ce/qe versus Ce, were used to calculate qm and KL and the values of these parameters are presented in Table 2.
Freundlich isotherm
The linear form of Freundlich equation is expressed as:

where KF and n are Freundlich isotherm constants related to adsorption capacity and adsorption intensity, respectively and Ce is the equilibrium concentration (mg.L−1). The Freundlich isotherm constants KF and n are determined from the intercept and slope of a plot of log qe versus log Ce, and they are presented in Table 2. The obtained values of n are greater than unity indicating chemisorptions (Yang 1998). Isotherms with n > 1 are classified as L-type isotherms reflecting a high affinity between adsorbate and adsorbent and are indicative of chemisorption (Yang 1998).
Temkin isotherm
The linear form of Temkin isotherm model is given by the equation:
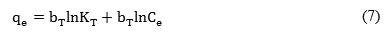
where bT is the Temkin constant related to the heat of sorption (J. mol−1) and KT is the Temkin isotherm constant (L. g−1). KT and bT were determined from the intercept and slope of a plot of qe versus ln Ce (Table 2).
The estimated adsorption constants with corresponding correlation coefficients (R2) are summarized in Table 2. The value of correlation coefficients obtained from each model indicates that the Langmuir model is better than the Freundlich and Temkin models to fit the experimental data, which confirms that the adsorption is a monolayer, the adsorption of each molecule has an equal activation energy and the adsorbate–adsorbate interaction can be negligible. Thus, it is clear that the adsorption occurs on a homogeneous surface. For nickel, the maximum adsorption capacity calculated using the Langmuir model is 71.428 mg/g at room temperature; whereas cobalt has a maximum adsorption capacity of 50 mg/g.
Table 2: Langmuir, Freundlich, and Temkin, isotherm model parameters and correlation coefficients for adsorption of Co2+ and Ni2+ on PCNR-150.
|
Metal |
Langmuir |
Freundlich |
Temkin |
||||||
|
qm (mg/g) |
KL (L/mg) |
R2 |
KF (mg/g) |
n |
R2 |
bT (J/mol) |
KT (L/g) |
R2 |
|
|
Ni2+ |
71.428 |
0.093 |
0.982 |
13.45 |
2.73 |
0.974 |
17.761 |
0.536 |
0.97 |
|
Co2+ |
50 |
0.152 |
0.975 |
20.51 |
5.61 |
0.85 |
6,547 |
11.72 |
0.836 |
Thermodynamic parameters
The standard Gibbs free energy ΔGo (kJ mol−1), was calculated using the following equation:
ΔG0 = -RTlnk (8)
with k is the thermodynamic equilibrium constant, or the thermodynamic distribution coefficient, and it can be defined as:
where ae is the activity of metal ion in solution at equilibrium; as is the activity of adsorbed metal ion; Cs is the surface concentration of metal ion (mmol.g−1) in the adsorbent; Ce is the metal ion concentration in solution at equilibrium (mmol.mL−1); γe represent the activity coefficient of the metal ion in solution; and γs is the activity coefficient of the adsorbed metal ion. As the metal ion concentration in the solution declines to zero, k can be obtained by plotting ln (Cs/Ce) versus Cs and extrapolating Cs to zero (Tu et al. 2012). The straight line obtained is fitted the points by least-squares analysis. The intercept at the vertical axis yields the values of k. The obtained values of k and ΔGo at different temperatures are given in Table 3.
The average standard enthalpy change (ΔHâ—¦) and entropy change (ΔSâ—¦) of metal ion adsorption onto PCNR-150 were calculated by the following equation:
where ΔHâ—¦ and ΔSâ—¦ were calculated from the slope and the intercept respectively in the plot of ln (k) against 1/T. These results are shown in Figure 8. Table 3 presents the obtained values of ΔHâ—¦ and ΔSâ—¦ at different temperature for metal ion adsorption process on PCNR-150.
The thermodynamic equilibrium constant k increased with temperature indicating that the adsorption was endothermic. Negative values of ΔGo for the two metal ions indicate spontaneous adsorption and the degree of spontaneity of the reaction increases with increasing temperature. The values of standard enthalpy change for Co2+ and Ni2+ are positive, this suggests that the adsorption of Co2+ and Ni2+ by PCNR-150 is endothermic, which is supported by the increasing of adsorption with temperature for the two elements. The positive standard entropy change of Co2+ and Ni2+ reflects the affinity of the PCNR-150 towards the two metal ions (Yang 1998).
Table 3: Thermodynamic parameters for adsorption of Co2+ and Ni2+ on PCNR-150.
|
Ion |
T(K) |
K |
ΔGº(kJ mol−1) |
ΔSº (Jmol−1 K−1) |
ΔHº (kJ mol−1) |
|
Co2+ |
300 |
3.648 |
-3.229 |
55.733 |
13.353 |
|
313 |
5.371 |
-4.375 |
|||
|
328 |
5.779 |
-4.784 |
|||
|
Ni2+ |
300 |
3.257 |
-2.945 |
16.117 |
1.887 |
|
313 |
3.375 |
-3.166 |
|||
|
328 |
3.474 |
-3.39 |
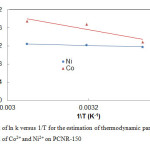 |
Figure 8: Plot of ln k versus 1/T for the estimation |
Conclusion
In this study the obtained results show that the decay of functional carbonyl group from the PCNRs decreases its adsorption capacity, although the increases of its specific surface areas. For this reason we can conclude that the effect of the functional carbonyl group is more important than the effect of specific surface areas. The adsorbent PCNR-150 was identified as potential and highly efficient nanoporous structure for the fast removal of Co2+ and Ni2+ from water, the adsorption depend strongly on different parameters like pH and temperature. Kinetic studies revealed that the equilibrium was reached within 20 min and the pseudo-second-order kinetic model provides the best correlation with the experimental data compared to the pseudo-first-order model. The maximum adsorption capacity of Ni2+and Co2+ were found to be 89.785 mg.g−1 and 68.17 mg.g−1, respectively, under pH of 6.5, and temperature of 313 K. The Langmuir model yields a better fitting than the Freundlich and Temkin models for metal ion adsorption on PCNR-150 under the investigated temperatures, hence the adsorption is monolayer. From the thermodynamic studies, the adsorption process was spontaneous and endothermic. These results provide the enhancement of the Co2+ and Ni2+ uptake from aqueous solutions by PCNR-150 which are considered as adsorbents for removing the metals from water and waste water.
Acknowledgement
This project was financed by the National Plan for Sciences, Technology and innovation, from King Abdulaziz City for Sciences and Technology (KACST), Kingdom of Saudi Arabia, project number: 13-NAN517-08.
References
- Chen, C.Y., Chiang, C.L., Chen, C.R. Removal of heavy metal ions by a chelating resin containing glycine as chelating groups, Purif. Technol., Vol., 54, pp., 396–403, (2007).
- Genc, O., Arpa, C., Bayramoglu, G., Arica, M. Y., Bektas, S. Selective recovery of mercury by Procion Brown MX 5BR immobilized poly (hydroxyethylmethacrylate / chitosan) composite membranes, Hydrometallurgy, Vol., 67, pp., 53–62 (2002).
- Ghiloufi, I., El Mir, L. Preparation and characterization of doped and undoped nanoporous carbon for heavy metal removal from aqueous solution, Status Solidi C Vol. 12, No. 1–2 pp. 25–29 (2015).
- Ghiloufi, I., Khezami, L., El Mir L. Nanoporous activated carbon for fast uptake of heavy metals from aqueous solution’, Journal of Desalination and Water Treatment, 55, 935–944 (2015).
- Huang, MR., Huang, SJ., Li, XG. Facile synthesis of polysulfoaminoanthraquinone nanosorbents for rapid removal and ultrasensitive fluorescent detection of heavy metal ions, Phys. Chem. C., Vol., 115, pp., 5301-5315 (2011).
- Jin, L., Bai, R. B. Mechanisms of lead adsorption on chitosan/PVA hydrogel beads, Langmuir,, 18, pp., 9765–9770 (2002).
- Kas goz, H. New sorbent hydrogels for removal of acidic dyes and metal ions from aqueous solutions, Bull. Vol., 56, pp., 517–528 (2006).
- Lebrun, L., Vallee, F., Alexandre, B., Nguyen, Q. T. Preparation of chelating membranes to remove metal cations from aqueous solutions, Desalination, Vol., 207, pp., 9–23 (2007).
- Li, N., Bai, R. A novel amine-nr oppp ddd;Tishielded surface cross-linking of chitosan hydrogel beads for enhanced metal adsorption performance, Eng. Chem. Res., Vol., 44, pp., 6692–6700 (2005).
- Liu, J., Ma, Y., Xu, T., Shao G. Preparation of zwitterionic hybrid polymer and its application for the removal of heavy metal ions from water, Hazard. Mater., Vol., 178, pp., 1021–1029 (2010).
- Pan, B., Zhang, W., Lv, L., Zhang, Q. Development of polymeric and polymer-based hybrid adsorbents for pollutants removal from waters, Eng. J., Vol., 151, pp., 19-29 (2009).
- Patterson, J.W. Industrial Wastewater Treatment Technology, second ed. Butterworth-Heinemann, London (1985).
- Pavlidou, S., Papaspyrides, C. D. A review on polymer-layered silicate nanocomposites, Progress Polym. Sci., Vol., 33, pp., 1119-1198 (2008).
- Rivas, B. L., Castro, A. Preparation and adsorption properties of resins containing amine, sulfonic acid, and carboxylic acid moieties, Appl. Polym. Sci. Vol., 90, pp., 700–705 (2003).
- Sitting, M. Handbook of toxic and hazardous chemicals, Noyes Publications, Park Ridge, NJ (1981).
- Sohail, A., Ali, S.I., Khan, N.A., Rao, A.K. Removal of chromium from wastewater by adsorption, Environt. J. Pollut. Control, Vol., 2 pp., 27-31 (1999).
- Tobin, J.M., Cooper, D.G., Neufeld, R.J. Uptake of metal ions by Rhizopus arrhizus biomass, Environ. Microb., Vol., 47, pp., 821–824 (1984).
- Tu, Y-J., You, C-F., Chang, C-K., Kinetics and thermodynamics of adsorption for Cd on green manufactured nano-particles, Hazard. Mater., Vol., 235– 236, pp.,116– 122 (2012).
- Yang, L., Li, Y., Wang, L., Zhang, Y., Ma, X., Ye, Z. Preparation and adsorption performance of a novel bipolar PS-EDTA resin in aqueous phase, Journal of Hazard. Mater., Vol., 180, pp., 98–105 (2010).
- Yang, C.H. Statistical mechanical study on the Freundlich isotherm equation, Colloid Interface Sci., Vol., 208, pp., 379–387 (1998).
- Zhao, X., Lv, L., Pan, B., Zhang, W., Zhang, S. Polymer-supported nanocomposites for environmental application: A review, Chem. Eng. J., Vol., 170, pp., 381-394 (2011).
Three Potential Referees
- Lassaad El Mir, Al Imam Mohammad Ibn Saud Islamic University (IMSIU), College of Sciences, Riyadh, Saudi Arabia. Email: elmirlassaad@yahoo.fr
- Jaber El Goul, Faculty of Sciences Campus Universitaire- Cité Erriadh, Gabès, 6072, Tunisia/ Email: ghoultn@yahoo.fr
- Pr. Ammar Houas, Faculty of Sciences Campus Universitaire- Cité Erriadh, Gabès, 6072, Tunisia/ Tel : (+216) 98 53 40 50, E-mail: amhouas@gmail.com


