Rainfall Stability and Drought Valuation (Using Spi) Over Southern Zone of Tamil Nadu
A.P. Ramaraj1 , S. Kokilavani1 , N. Manikandan1 , B.Arthirani 2 and D. Rajalakshmi1
1
Agro Climate Research Centre, Kovilpatti,
Tamil Nadu Agricultural University,
Coimbatore,
641 003
India
2
Agricultural Research Station,
Tamil Nadu Agricultural University,
Coimbatore,
641 003
India
http://dx.doi.org/10.12944/CWE.10.3.23
Drought is the most extensive hydro-meteorological pattern of prolonged period of water scarcity affecting natural resources and environment. However, it has significantly different characteristics from one region to another. Tamil Nadu agonizes from various disasters including droughts. Generally rainfall deviation from the long-term mean continues to be a widely adopted indicator for drought intensity assessment. The application of this indicator is strongly limited by its inherent nature of its dependence on mean. Thus a standardized procedure that overcomes these limitations becomes a basic need. Moreover stability of rainfall in recent years has been erratic and hence to understand the stability of rainfall over years Precipitation Ratio (PR) was used. Further to understand the drought climatology of southern zone of Tamil Nadu, Standardized Precipitation Index (SPI) was used. PR was studied for three decades (1981-2010) covering seven locations. In most of the locations the rainfall was stable during 1981-90 and thereafter a gradual decline in stability was noticed confirming the weather extremes in the recent decade. SPI had an annual range from +2.69 to -4.94 while Monsoon period had +2.41 to -3.43 and +2.69 to -3.14 respectively for Southwest and Northeast monsoon seasons. As per SPI index, Southern zone is prone to moderate drought followed by severe and extreme drought category. Among the periods studied (Annual, SWM and NEM) number of moderate drought occurrences had no much variation while in severe and extreme drought category, variations could be observed. In particular, during NEM period there was almost no occurrence of extreme drought.
Copy the following to cite this article:
Ramaraj A. P, Kokilavani S, Manikandan N, Arthirani B, Rajalakshmi D. Rainfall Stability and Drought Valuation (Using Spi) Over Southern Zone of Tamil Nadu. Curr World Environ 2015;10(3) DOI:http://dx.doi.org/10.12944/CWE.10.3.23
Copy the following to cite this URL:
Ramaraj A. P, Kokilavani S, Manikandan N, Arthirani B, Rajalakshmi D. Rainfall Stability and Drought Valuation (Using Spi) Over Southern Zone of Tamil Nadu. Available from: http://www.cwejournal.org/?p=13237
Download article (pdf) Citation Manager Publish History
Introduction
Drought occurs over most parts of the world, even in wet and humid regions. This is because drought is distinct as a dry spell relative to its local normal condition. On the other hand, arid areas are prone to drought because their rainfall amount critically depends on a few rainfall events.2 Weather prediction agencies from all over the world forecast El Niño conditions in 2014 with impending danger of drought. The frequency of such events has been high in the last decade with droughts in 2002, 2004 and 2009. India is expected to be the first to suffer, with weaker monsoon rains, undermining the nation’s fragile food supply.3 Drought is a gradually developing phenomenon, it first appears as below-average rainfall within a normal part of climate, it can develop as an extreme climatic event and turn into a hazardous phenomenon, which can have a severe impact on communities and water dependent sectors.7 Drought occurs in almost all climatic zones and damage to the environment and economies of several countries has been extensive. Drought damages are more obvious or prominent in areas where there is a direct threat to livelihoods. In drought management, making the transition from crisis to risk management is difficult because little has been done to understand and address the risks associated with drought.
All the regions of India suffer with drought incidences of varying periodicity, with 13 states repeatedly declared as drought-prone.4 Drought has become a frequent phenomenon in India, due to rise in pollution and climatic changes. In India, 'chronically drought-prone areas' is around 33% and receive less than 750 mm of rainfall, while 35%, classified as 'drought-prone' receive rainfall of 750-1,125mm. Tamil Nadu is located in the southern tip of India; the spatial, seasonal and inter-annual variability of rainfall follows a complex pattern especially in southern zone of Tamil Nadu.
The problems of drought-prone regions vary in magnitude, temporally and spatially. Hence drought risk assessment is the necessity to cope up with this devastating drought, which affects the society a lot. Drought indices are one of the very important tools to monitor and to assess drought, because they simplify complex inter-relationships between many climate parameters. There is extensive literature on the quantification of drought by using various indices, models and water balance simulations.10,13 Precipitation has been used to develop a variety of indices, because it is a key variable to study meteorological drought. Among the meteorological indices, Standardized Precipitation Index (SPI) is more commonly used. The SPI has certain advantages over others such as use of rainfall data alone and also its variable time scale, which allows it to describe drought conditions important for a range of meteorological, hydrological and agricultural applications.8
Materials and Methods
Study Area
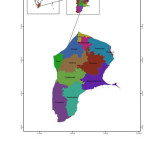
Southern agro climatic zone of Tamil Nadu is surrounded by coastal areas on the east and mountains in the west. This zone lies on the southern part of the Tamil Nadu State under rain shadow area. The elevation varies from mean sea level to 300 metres. The districts taken for the analysis is depicted in Fig 1.
 |
|
Agro climatic profile of Southern Zone
Mean annual rainfall of southern agro climatic zone is 776 mm and is received in 43 rainy days. It covers the rivers of Vaigai, Sitrar, Thamraparani, Numbiar, Pachaiyar, Kludar, Arjunar, Kodumudiyaar, Manimuthar, Periyar and Vaigai. The dams used by this zone are Periyar, Vaigai, Manjalar and Bhabanasam. The patterns of irrigation are well irrigation, canal irrigation, irrigation by dams and by lakes.
Data source
For the present analysis, 30 years of historical rainfall data from 1981 to 2010 were collected for the seven districts such as Dindugul, Madurai, Puddukottai, Tirunelveli, Virudhunagar, Tutucorin and Theni from the respective research station. In the absence of long-term data for districts, data were taken from India Meteorological Department (IMD).
Data analysis
The data was sliced for different seasons such as Cold Weather Period (CWP - January and February), Hot Weather Period (HWP - March to May), South West Monsoon (SWM - June to September) North East Monsoon (NEM - October to December) and Annual period to study the rainfall stability
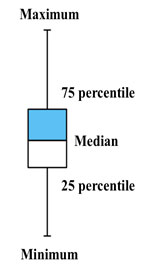
Box and whiskers plot
Box and whiskers plot was generally used to depict the descriptive statistics of a given set of data in the following manner. The two whiskers (vertical lines) in top and bottom represent maximum and minimum value in the data set. Upper bound of the box represents third quartile or seventy-fifth percentile. In the same way the lower bound of the box represents first quartile or twenty-fifth percentile while, the central line represents the median. The rainfall variability for the study regions was depicted using this box and whiskers plot
The Standard Precipitation Index (SPI) was proposed by7 to quantify precipitation deficits/surpluses on a variety of time scales (usually between 1-month and 24-month sums). Because of the fact that the SPI is normalized, wetter and drier climates can be represented in the same way, and wet periods can also be monitored using the SPI. Those time scales reflect different aspects of the hydrological cycle. Soil moisture conditions respond to precipitation anomalies on a relatively short scale (2–3 months), stream flow may be described by SPIs with time scales of 2–6 months, while ground water and reservoir storage reflect longer-term precipitation anomalies.6 Hence, the different time scales for which the index is computed address the various types of drought: the shorter seasons for agricultural and meteorological drought, the longer seasons for hydrological drought.5 Due to its robustness and convenience to use, SPI has already been widely used to characterize dry and wet conditions in many countries and regions, such as the United States,15 Canada,11 Italy,14 Iran9 Korea6 and China.1
The SPI programme developed by National Drought Mitigation Centre of University of Nebraska was utilized and The criteria defined by8 for a “drought event” and classification of the SPI to define drought intensities for any time steps used for interpretation. The classification was given in Table 1.
Table 1: Classification of Standard Precipitation Index values and their intensities
|
SPI |
Intensity |
|
2.00 and more |
Extremely wet |
|
1.99 to 1.50 |
Very wet |
|
1.49 to 1.00 |
Moderate wet |
|
-0.99 to 0.99 |
Near normal |
|
-1.00 to -1.49 |
Moderate drought |
|
-1.50 to -1.99 |
Severe drought |
|
-2.00 and less |
Extremely drought |
Results and Discussion
Rainfall Stability Analysis
The decadal analysis of precipitation ratio for the southern zone revealed that highest ratio was recorded at Tirunelveli district (1981-1990) indicating lower annual normal rainfall (652.4 mm). This could be supported that drought year occurred during 1982 and 1987 which accounted for the lower rainfall. During 1991-2000, higher ratio (79.1) was observed at Dindigul district and highest annual normal rainfall (990.73 mm) was also recorded. This could be noticed with the flood years and cyclonic activity during that particular decade along with the geographical position of dindigul district with high elevation. In the recent decade also, higher precipitation ratio of 139.5 was observed at Dindigul district and comparatively lower rainfall of 891.1 mm was observed. In this decade, more drought years and also flood year was also noted.
At pudukottai district, lower precipitation ratio of 31.7 was observed indicating more stable rainfall during 1981-90 decade while during 1991-2000, the ratio was doubled and in the recent decade the ratio was tripled which could be supported by the recent extreme events occurred during 2001-2010 (Table 2).
Table 2: Rainfall stability analysis using precipitation ratio for southern zone
|
Districts |
1981-1990 |
|
1991-2000 |
|
2001-2010 |
|
|
Rainfall (mm) |
PR |
Rainfall (mm) |
PR |
Rainfall (mm) |
PR |
|
|
Dindugal |
739.0 |
63.5 |
990.7 |
79.1 |
891.1 |
139.5 |
|
Madurai |
775.6 |
40.9 |
961.6 |
58.8 |
942 |
86.2 |
|
Pudukottai |
928.5 |
31.7 |
987.1 |
67.6 |
837.9 |
108.6 |
|
Tirunelveli |
652.4 |
125.5 |
724.9 |
57.8 |
603.3 |
66.6 |
|
Virudhunagar |
810.9 |
76.2 |
849.4 |
63.6 |
786.4 |
76.1 |
|
Tuticorin |
705.4 |
53.6 |
701.1 |
64.5 |
678.2 |
73.9 |
|
Theni |
785.2 |
107.2 |
951.6 |
46.8 |
709.7 |
102.5 |
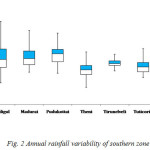
Rainfall Variability Analysis
Among the regions studied, Tirunelveli district exceptionally had very low variability which indicated high dependable rainfall for the district followed by Tutucorin, Theni,Virudhunagar, Pudukottai, Madurai and Dindigul districts respectively. The highest variability observed in Dindigul district might be due to the topography of the district which has both mountainous range and plain regions. The least variability observed in Tirunelveli and Tuticorin district might be due to its nearness to sea.
 |
|
Drought Analysis Based on SPI
SPI analysis showed that moderate drought had maximum occurrence (6) during Northeast monsoon at Virudhunagar district while minimum occurrence (1) at Madurai district. During Southwest monsoon period, maximum number of occurrences (5) of moderate drought intensity was noticed at Pudukottai and Tirunelveli respectively. Annually, Pudukottai district recorded maximum occurrence (5) (Table 3). Severe drought intensity was noticed at Madurai during Northeast monsoon period while all other districts registered minimum number of severe drought intensity. Extreme drought intensity was least occurred among different drought intensity studied for different districts.
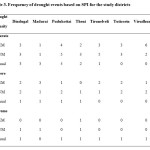 |
Table 3: Frequency of drought events based on SPI for the study districts Click here to View table |
 |
|
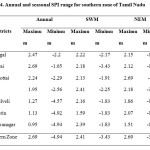
On annual basis and during monsoonal period (southwest monsoon and northeast monsoon), extremely wet and extreme dry condition could be observed over southern zone of Tamil Nadu (Table 4). This was true for the region wise analysis also. Annually, categorization of SPI ranged from near normal (0.95) at Virudhunagar to extremely wet condition in most of the places studied. In both the monsoonal periods, very wet to extreme wet and severe drought to extreme drought condition could be observed in the southern zone of Tamil Nadu.
Conclusion
The study concluded that there exists typical rainfall variability over southern zone of Tamil Nadu. This is confirmed through the rainfall stability analysis in the study zone. Among the regions studied, regions adjacent to the Western Ghats and regions near the coastal areas showed typically contrasting rainfall features (moderate drought had maximum occurrence (6) during Northeast monsoon at Virudhunagar district while minimum occurrence (1) at Madurai district). Rainfall analysed using SPI revealed considerable variation among the regions and seasons. In particular, Northeast monsoon had least rainfall deficiency compared to other time slices studied. Overall, moderate drought events had considerable occurrence than other SPI categorization.
References
- Bordi I. Fraedrich K. Jiang M. and Sutera A. Spatio-temporal variability of dry and wet periods in eastern China. Theor Appl Climatol 79:81–91(2004).
- Dai A. Drought under global warming: A review. WIREs Climatic Change 2: 45-65. (2011).
- Gautham H.R. Sharma H.L. Kumar R and Hardwaj M.L. B. Effect of El Niño on southwest monsoon rainfall and agriculture in India.Curr. Sci., 107 (11):1178-1179(2014).
- Gupta A.K. Tyagi P and Sehgal V.K. Drought disaster challenges and mitigation in India: strategic appraisal .Curr. Sci., 100 (12):1795-1806(2014).
- Heim R.R. A review of twentieth-century drought indices used in the United States. Bull. Am. Meteorol. Soc.83 (8): 1149–1165. (2002).
- Kim D.W Byun H.R and Choi K.S. Evaluation, modification, and application of the effective drought index to 200-year drought climatology of Seoul, Korea. J Hydrol 378:1–12(2009).
- Lloyd-Hughes B. and Saunders M. A.. A drought climatology for Europe. Int. J. Climatol., 22(13): 1571–1592 (2002).
- McKee T. B. Doesken N. J. and Kleist J. The Relationship of Drought Frequency and Duration to Time Scales, Proceeding of the Eight Conference on Applied Climatology 17-22 January, Anaheim, California, (1993).
- Nafarzadegana A.R. Zadeha M.R. Kherada M. Ahania H. Gharehkhania A. Karampoora M.A. and Kousari M.R.. Drought area monitoring during the past three decades in Fars Province, Iran. Quat Int 250:27–36 (2012).
- Palmer W. C. Meteorological Drought, U.S. Weather Bureau Manuscript No. 45 58pp February, (1965).
- Quiring S.M. and Papakryiakou T.N. An evaluation of agricultural drought indices for the Canadian prairies. Agric. For. Meteorol. 118 (1–2): 49–62. (2003)
- Rathod I.M. and Aruchamy S. Rainfall Trends and Pattern of Kongu Upland, Tamil Nadu, India using GIS Techniques, Int. J. of Environ. Sci., 1 (2): 109-122. (2010).
- Stahl K. and Demuth S. Linking stream flow drought to occurrence of atmospheric circulation pattern, Hydrol Sci J., 44(5) p665 - 680, (1999).
- Vergni L and Todisco F. Spatio-temporal variability of precipitation, temperature and agricultural drought indices in central Italy. Agric. For. Meteorol., 151(3):301–313 (2010).
- Wu H. Hayes M. J Weiss A. and Hu Q. An evaluation of the standardized precipitation index, the China-Z index, and the statistical Z-score. Int. J. Climatol., 21(6): 745–758. (2001).


