Water Quality Assessment Using Physico-Chemical Parameters and Heavy Metals of Gobind Sagar Lake, Himachal Pradesh (India)
Vandana Sharma1 * and Yogesh Kumar Walia2
1
Department of Chemistry,
Career Point University,
Kota,
Rajasthan
India
2
Department of Chemistry,
School of Basic and Applied Sciences,
Career Point University,
Hamirpur,
Himachal Pradesh
India
http://dx.doi.org/10.12944/CWE.10.3.28
Today the environment has become harmful for the health of living organisms due to excessive pollution and contamination of natural resources. The present investigation has been carried out with the objective to assess the water quality of the Gobind Sagar Lake, Bilaspur, Himachal Pradesh (India) using physico-chemical parameters with heavy metals of the lake. For this study, three sampling sites were identified and samples from different sites were collected in summer season and important parameters [Water Temperature, pH, Total Hardness, Dissolved Carbon Dioxide (CO2), Dissolved Oxygen (DO), Chemical Oxygen Demand (COD), Biological Oxygen Demand (BOD), Chloride, Total Alkalinity, Total Dissolved Solid (TDS)] with heavy metals [ Lead (P), Copper (Co), Iron (Fe), Cadmium (Cd), Nickel (Ni) and Manganese (Mn), Chromium (Cr) were analyzed. The results revealed that the different conditions of Gobind Sagar Lake in different sampling stations showed fluctuations in some physico-chemical parameters and also in heavy metals. These result depicted that water of lake was polluted in the form of nutrient enrichment which is due to agricultural activities and its runoff in and around catchment area of the lake. There are other many ways that things can end up in the lake as the free style way of disposal of industrial and domestic effluents etc. Results of studies on heavy metals in pollution are well documented revealing the toxic effects of these metals on aquatic organisms.
Copy the following to cite this article:
Sharma V, Walia Y. K. Water Quality Assessment Using Physico-Chemical Parameters and Heavy Metals of Gobind Sagar Lake, Himachal Pradesh (India). Curr World Environ 2015;10(3) DOI:http://dx.doi.org/10.12944/CWE.10.3.28
Copy the following to cite this URL:
Sharma V, Walia Y. K. Water Quality Assessment Using Physico-Chemical Parameters and Heavy Metals of Gobind Sagar Lake, Himachal Pradesh (India). Available from: http://www.cwejournal.org/?p=13329
Download article (pdf) Citation Manager Publish History
Introduction
India is facing a serious problem of natural resources scarcity, especially that of water in view of population growth and economic development.1 Most of fresh water bodies all over the world are getting polluted, thus decreasing the portability of water.2&3 We need water for different purposes such as dinking, irrigation, industries, swimming, fishing etc. Thus water for different purposes has its own requirements in terms of composition and purity as well as the presence of different components in water has to be analyzed on a regular basis to confirm its suitability. Major sources of water pollution are from municipal water, industrial water, agricultural water, sewage water, etc. Polluted water may contain suspended solids, dissolved inorganic compounds, nitrogen and phosphorous compounds, animal wastes, toxic chemicals, insecticides, pesticides, medical waste, toxic heavy metals and biological pollutants such as pathogenic bacteria, fungi, protozoa, viruses, parasitic worms, etc.4&5 Without adequate quantity and quality of fresh water sustainable development will not be possible.6 Contamination of water is becoming a serious problem at global level as fresh water resources are getting deteriorated day-by-day at an alarming rate.7,8&9
Water quality assessment generally involves screening of physico-chemical parameters, analysis of heavy metals as well as evaluation of abiotic and biotic status of ecosystem.10,11,12&13 The large woody debris or natural rock in lakes can directly affect habitat for fish by changing hydraulic scour resulting in deeper accumulation within an intricate physical structure and complex patterns of currents often with more protections from strong flows, then are found in open channel of rivers or lakes.16 The lakes constitute one of the most productive ecosystems. They are very important economically as well as aesthetically particularly in fishing, agriculture, industry, tourism, education and scientific researches. Therefore the accurate determination of physico chemical parameters and heavy metals in aquatic environment is of ultimate importance for controlling pollution.
Materials and Methods
Study Area
This study was carried out at Gobind Sagar Lake (Figure 1) which is situated in Bilaspur District of Himachal Pradesh India. Gobind Sagar Lake is one of the largest man-made lake of India, was created by a 255 m high, straight gravity dam at Bhakra (31° 25'N and 76° 25'E) on the river Sutlej, which is a huge reservoir and is the result of Bhakra Nangal (power plant) dam. Construction of Bhakra Nangal dam was initiated in 1947 and the reservoir was formed in 1963. The lake is named after the ‘Guru’ Gobind Singh’, the tenth and last guru of Sikhs. It is a major landmark of Bilaspur District. This lake covers an area of 170 sq km and its length extends upto 90 km.
Sample Analysis
Sampling stations of the lake were selected on the basis of the identified pollution problems to assess the overall status of the lake. To analyze the water of the lake, water samples were collected from three different stations of the lake (Figure 1) first sampling station (S1) was Kundror Bridge (Kundror), second sampling station (S2) was Bathing Ghat (Luhnu), and third sampling station (S3) was ACC Cement Factory Pump House (Daiher). Water Samples for the analysis of water parameters [temperature, pH, dissolved oxygen (DO), chemical oxygen demand (COD), biological oxygen demand (BOD), chloride, total alkalinity, total hardness, carbon dioxide, total dissolved solid, lead, copper, iron, chromium, cadmium, nickel and manganese] were preserved and transported to research laboratory. For the preservation and the analysis of water samples of the lake water, the standard methods14&15 were followed.
The water samples were collected during the months from March to June 2014 at 10:30 a.m. The samples for analysis were collected in satirized bottles. Almost care was taken, so that no bubbling should observe during sampling, which avoids influence of the dissolved oxygen. The water temperature was recorded at the sample stations. The chemicals used were of A. R. grade and was used without further purification. The pH of water samples of the lake water was measured with the help of instrument pH Meter (Elico LI-120) with a glass electrode. The COD of the sample was measured by Open Reflux Method. Dissolved oxygen and BOD determined by Wrinkle’s Azide Modification Titrimetric Method. Total Hardness was measured by EDTA Titrimetric Method. Chloride was measured by Argentometric Method. Alkalinity and Carbon dioxide of the water sample was measured by Titration Method. TDS of the sample was measured by drying it at 1800 C. The metals of water sample were determined by Flame Atomic Absorption Spectroscopy (Shimadju AA-6300).
Results
The observed values for the analysis of physico-chemical parameters [Water Temperature, pH, Dissolved Oxygen (DO), Chemical Oxygen Demand (COD), Biological Oxygen Demand (BOD), Chloride, Total Alkalinity, Total Hardness, Carbon Dioxide (CO2), Total Dissolved Solid (TDS), and heavy metals Lead (Pb), Copper (Co), Iron (Fe), Chromium (Cr), Cadmium (Cd), Nickel (Ni) and Manganese (Mn)] are shown in Table1 and presented by graphs in Figure 2 and Figure 3.
Table 1: Water quality parameter of Gobind Sager Lake in summer season (March 2014-June 2014).
|
Sr. No. |
Parameter Used |
Units |
Sampling station S1 (Mean+Standard Deviation) |
Sampling station S2 (Mean+Standard Deviation) |
Sampling station S3 (Mean+Standard Deviation) |
Maximum permissible limit |
|
1. |
Water Temperature |
0C |
23.450±2.978 |
23.425±2.914 |
23.275±3.028 |
35A |
|
2. |
pH |
- |
5.107±1.051 |
6.482±0.251 |
4.750 ±0.928 |
8.5A |
|
3. |
DO |
mg/l |
1.825±0.299 |
2.725±0.492 |
2.000±0.216 |
7A |
|
4. |
BOD |
mg/l |
0.753±0.040 |
1.231±0.227 |
0.789±0.013 |
2B |
|
5. |
COD |
mg/l |
1.661±0.335 |
1.582±0.425 |
0.607±0.549 |
250 |
|
6. |
Dissolved CO2 |
mg/l |
3.925±0.585 |
3.550±0.472 |
3.525±0.519 |
No standard |
|
7. |
TDS |
mg/l |
182.000 ±21.679 |
276.250±18.246 |
184.250±22.396 |
500B |
|
8 |
Chloride |
mg/l |
36.795±5.347 |
63.942±11.782 |
71.677±41.300 |
250A |
|
9. |
Total Hardness |
mg/l |
29.565±12.296 |
38.465±9.834 |
30.547±14.323 |
500A |
|
10. |
Total Alkalinity |
mg/l |
25.000 ±8.880 |
138.750±5.909 |
24.333±11.590 |
600A |
|
11 |
Lead |
mg/l |
0.850 |
1.280 |
3.680 |
0.001C |
|
12 |
Copper |
mg/l |
ND* |
0.510 |
0.708 |
1.0C |
|
13 |
Iron |
mg/l |
4.500 |
71.300 |
47.300 |
0.3C |
|
14 |
Chromium |
mg/l |
ND* |
ND* |
ND* |
0.001C |
|
15 |
Cadmium |
mg/l |
ND* |
ND* |
ND* |
0.001C |
|
16 |
Nickel |
mg/l |
ND* |
0.440 |
0.480 |
0.1C |
|
17 |
Manganese |
mg/l |
0.267 |
4.100 |
9.200 |
0.1C |
* ND-Not identified, pH-Hydrogen ion concentration, DO-Dissolved Oxygen, BOD-Biological Oxygen Demand, COD-Chemical Oxygen Demand, TDS-Total dissolved solid. A-WHO (World health organization) , B-CPCB (Central pollution control board),C-ICMR(Indian council of medical research)
The results obtained were analyzed, compared with the WHO (World Health Organization), CPCB (Central Pollution Board), ICMR (Indian Council of medical research) standards and discussed in brief, which had played a conclusive role in deciding the status of water quality of lakes under study.
Discussion
Water qualities provide the primary assessment of the pollution status and it can be determined through assessment of water quality parameters.
Water Temperature
Temperature is one important parameter which influences almost all the physical, Chemical and biological nature of water. In the present study temperature varied from 23.2750C to 23.4500 The minimum temperature was recorded at station S3 and maximum was recorded at S1. The results shows that these values are below the maximum permissible limit, also results show deviation of 3 approximately at all sampling stations and these deviations are due to sampling in different months of the summer season.
pH
pH is correlated with electrical conductance and total alkalinity. The higher value of pH recommend that carbon dioxide, carbonate-bicarbonate equilibrium is affected more due to change in physico-chemical condition.17 In the present study pH varied from 4.750 to 6.482 maximum at S2 and minimum at S3. It is found that lake water is slightly acidic; it may be due to addition of domestic sewerages and also agricultural wastes (vines, fruit bearing trees, vegetables etc.). The results shows that these values are below the maximum permissible limit, also results show deviation of 1 approximately at all sampling stations and these deviations are due to different sources of pollutions at different sampling station.
Dissolved Oxygen (DO)
Dissolved Oxygen of water gives direct and indirect information with respect to bacterial activity, photosynthesis, availability of nutrients, stratification etc.18 In summer season, dissolved oxygen decreases due to increase in temperature and also due to increased microbial activity.19,20&21 During this season, intense sunlight accelerates photosynthesis by phytoplankton, utilizing CO2 and giving off oxygen. This possibly accounts for the greater qualities of O2 recorded during summer.22 DO of Gobind Sagar lake is varies from 1.825mg/l to 2.725 mg/l, minimum is at S1 and maximum is at S2.The results shows that these values are below the maximum permissible limit, also results show deviation of 0.2 approximately at all sampling stations because of different sources of pollution. It is supposed that low dissolved oxygen in Gobind Sagar Lake is due to high temperature in summer and due to increased microbiological activities.
Biochemical Oxygen Demand (BOD)
BOD test help to measure the amount of biodegradable organic material of water sample. In present study the BOD of water sample was varied between 0.753 to 1.231 mg/l with minimum at S1 and maximum at S2. The results shows that these values are below the maximum permissible limit, also results show deviation of 0.04 approximately at all sampling stations.
Chloride
In present study the values of chloride varied between 36.795 to 71.677 mg/l with minimum at S1 and Maximum at S3. The results show that these values are below the maximum permissible limit. Chloride concentration in lake water may result due to pollution by sewage waste and common salt added.
Total Alkalinity
Alkalinity of water is a measure of weak acid present in it and of the cations balanced against them.23 In present study total alkalinity of water samples of lake varied from a minimum of 24.333 mg/l at S3 to a maximum of 138.750 mg/l at S2. The results shows that these values are below the maximum permissible limit, also results show deviation of 8 approximately at all sampling stations.
Total Hardness
Total hardness of water describes the effect of dissolved minerals (mostly Ca and Mg), determining suitability of water for domestic, industrial and drinking purposes and attributed to presence of bicarbonates, sulphates, chloride and nitrates of calcium and Magnesium.24 The observation of total hardness reveals that water samples ranged between 29.565 to 38.465 mg/l with minimum at S1 and Maximum at S2. The results shows that these values are below the maximum permissible limit, also results show deviation of 12 approximately at all sampling stations and these deviations are due to different sources of pollutions at different sampling station.
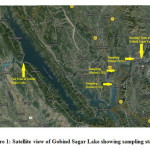 |
Figure 1: Satellite view of Gobind Sagar Lake showing sampling stations. Click here to View figure |
Chemical Oxygen Demand (COD)
Chemical Oxygen Demand is amount of oxygen required for the oxidation of oxidizable organic matter. Chemical Oxygen Demand of Gobind Sagar Lake varies from 0.607 to 1.661 mg/l, minimum is at S3and maximum is at S1. The results shows that these values are below the maximum permissible limit, also results show deviation of 0.4 approximately at all sampling stations and these deviations are again supposed due to different sources of pollutions at different sampling station.
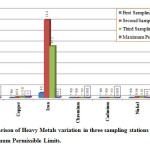 |
Figure 2: Comparison of Heavy Metals variation in three sampling stations of Gobind Sagar Lake with Maximum Permissible Limits. Click here to View figure |
Dissolved Carbon Dioxide (CO2)
Carbon dioxide is the end product of organic carbon degradation in almost all aquatic environments and its variation is often a measure of net ecosystem metabolism.25&26 Dissolved CO2 of Gobind Sagar Lake varies from 3.525 to 3.925 mg/l, minimum is at S3, and maximum is at S1. The results shows that these values are below the maximum permissible limit, also results show deviation of 0.5 approximately at all sampling stations.
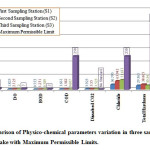 |
Figure 3: Comparison of Physico-chemical parameters |
Total dissolved solid (TDS)
TDS is the sum of the cations and anions concentrations expressed in mg/l. TDS of the lake varies from 182 mg/l to 276.250 mg/l, maximum is at S2 and minimum is recorded at S1. The results shows that these values are below the maximum permissible limit, also results show deviation of 19 approximately at all sampling stations and these deviations are again supposed due to different sources of pollutions at different sampling stations.
Lead (Pb)
Lead is relatively a minor element in the earth's crust but is widely distributed in low concentrations in uncontaminated soils and rocks. Gobind Sagar Lake varies from 0.850 to 3.680 mg/l, minimum is at S1, and maximum is at S3. The results show that lead concentration in lake water was very high above the maximum permissible limit. This is due to atmospheric input of lead originating from its use in the leaded gasoline or industrial processes.
Copper (Cu)
Copper is a widely distributed trace element because most copper minerals are relatively insoluble and is combined to solid phases hence only low concentrations are normally present in natural waters. Gobind Sagar Lake varies from 0 to 0.708 mg/l, at S1 is absent, and is maximum at S3. The results show that copper concentration in lake water is below the maximum permissible limit.
Iron (Fe)
Iron is an abundant element in the earth's crust, but exists generally in minor concentrations in natural water systems. Iron is found in the +2 (ferrous) and +3 (ferric) states depending on the oxidation-reduction potentials of the water. Gobind Sagar Lake varies from 4.500 to 71.300 mg/l, minimum is at S1and maximum is at S2. The results show that iron concentration in lake water is above the maximum permissible limit and supposed due to different sources of pollutions at different sampling stations.
Chromium (Cr)
The concentration of chromium in natural waters is usually very low. Elevated concentrations of chromium can result from mining and industrial processes. Chromate compounds are routinely used in cooling waters to control erosion. Chromium in water supplies is generally found in the hexavalent form. But Chromium in Gobind Sagar Lake is absent in all three sampling stations.
Cadmium (Cd)
Cadmium may enter the surface waters as a consequence of mining, electroplating plants pigment works, textile and chemical industries, and is toxic to man. Cadmium in Gobind Sagar Lake is absent in all three sampling stations.
Nickel (Ni)
Nickel in Govind Sagar Lake varies from 0 to 0.480 mg/l, minimum is at S1, and maximum is at S3.
Manganese (Mn)
Manganese is commonly found in water and is an essential element required in small amounts by all living organisms. Gobind Sagar Lake varies from 0.267 to 9.200 mg/l, minimum is at S1, and maximum is at S3. The results show that manganese concentration in lake water is above the maximum permissible limit. Manganese In lake water supposed due to weathering of manganese bearing minerals and rocks, sewage, and landfill leachate.
Acknowledgement
I am grateful to Career Point University, Hamirpur and CSIR- Institute of Himalyan Bioresource Technology, Palampur H.P., for providing necessary laboratory facilities.
References
- Garg R. K., Rao R. J. and Saksena D. N. Water quality and conservation management of Ramsagar reservoir, Datia, Madhya Pradesh. J. Environ Biology, 30(5): 909-916 (2009).
- Gupta S. K., Dixit S. and Tiwari S. Assessment of Heavy Metals in Surface water of lower Lake, Bhopal. Poll Res., 24(4): 805-808 (2005).
- Ndamitso M. M., Idris S., Likita M. B., Jimoh O., Tijani A. I., Ajai A. A. and Bala M. Physico-chemical and Escherichia coli assessment of selected sachet water produced in some areas of minna, nigar state, Nigeria. International journal of water resources and Environmental Engineering, 5 (3): 134-140 (2013).
- Aggarwal R. and Arora S. A Study of Water Quality of Kaushalya River In The submountaneous Shivalik Region. International Journal of Scientific Technology Research, 1(8): 52-68 (2012).
- Pardeshi D.S. and Vaidya S. Physico-chemical assessment of Waldhuni River Ulhasnagar (Thane): A case study. International journal of current research and academic review, 3(4): 234-248 (2015).
- Kumar N. A. View on Freshwater environment. Environment & Conservation, J. Ecology, 3: 3-4, (1997).
- Mahananda M. R. Physico-chemical analysis of surface water and ground water of Bargarh District, Orissa, India. International Journal of Research and Review in Applied Sciences, 2(3): 284-295 (2010).
- Venkatesharaju K., Ravikumar P., Somashekar R. K. and Prakash K. L. Physico chemical and bacteriological investigation on the river cauvery of kollegal stretch in karnataka. Journal of Science, Engineering and Technology, 6(1): 50-59 (2010).
- Andrew O. A. Physicochemical Analysis of Ogun River (Water Samples) Within Two locations (Akin-Olugbade and Lafenwa) in Abeokuta, Ogun State, Nigeria. IOSR Journal of Applied Chemistry, 1(4): 24-27 (2012).
- Nautiyal P. Studies on the riverine ecology of the torrential waters in Indian uplands of Garhwal region. 1. Seasonal variations in the percentage occurrence of planktonic algae, Uttar Pradesh. J. Zool., 5(1): 14-19 (1985).
- Berkman H. E. & Rabeni, C. F. Effect of siltation in stream fish communities. Environmental Biology of fishes, 18(28): 285-294 (1987).
- Vannote R. L., Minshall, G. W. Cummins, K. W., Sedel, J. R. & Cushing, C. E. The river continuum concept. Canadian Journal of Fisheries and Aquatic science, 37: 130-137 (1980).
- Baker J. A. and Ross, S. T. Spatial and temporal resource utilization by southeastern cyprinids. Copeia, 81: 178-179 (1981).
- Trivedy R. K. and Goel P. K. Chemical Biological Methods for water pollution Studies. Environment Publications Karad, India, 100-104, (1986).
- APHA Standard methods for the examination of water and wastewater. 22nd Edn., Washington, DC (2012).
- Gupta D. P., Sunita and Saharan J. P. Physiochemical Analysis of Groundwater of Selected Area of Kaithal City (Haryana), India. Researcher, 1(2), 1-5 (2009).
- Karanth K. R. Groundwater Assessment Development and Management, Tata McGraw Hill publishing company Ltd., New Delhi, 725-726 (1987).
- Premlata and Vikal Multivariant analysis of drinking water quality parameters of lake Pichhola in Udaipur, India. Biological Forum, 1(2): 97-102 (2009).
- Moss B. Studies on Gull Lake, Michigan. Fresh Water Biology, 2: 309-320 (1972).
- Morrissette D. G., and Mavinic, D. S. BOD Test Variables. Journal of Environment Engg. Division, 6:1213-1222 (1978).
- Kataria H. C., Quershi H. A., Iqbal S. A. and Shandilya A. K. Assessment of water quality of Kolar reservoir in Bhopal (M.P.). Pollution Research, 15(2): 191-193 (1996).
- Krishnamurthy R. Hydro-biological studies of Wohar reservoir Aurangabad (Maharashtra State) India, Journal of Environmental Biology, 11(3), 335-343 (1990).
- Sverdrup H.H, Johnson M. W. and Fleming R. H. The Oceans: Their physics, chemistry and general biology. Prentice Hall, New York. (1942).
- Taylor E.W. The examination of water and water supplies. J. and A Churchill Ltd, London (1949).
- Smith S. V. and Hollibaugh J. T. Annual cycle and interannual variability of ecosystem metabolism in a temperate climate embayment, Ecology/Ecological Monographs, 67: 509 (1997).
- Hopkinson, C. S. Shallow-water and pelagic metabolism: Evidence of heterotrophy in the near-shore Georgia Bight, Marine Biology, 87: 19, (1985).


