Effects of Oval and Circular Piers on Velocity and Shear Stress Changes by Using Open FOAM Software
marieh rajaie1 , mohammad reza pirestani2 and seyed hossein ghoreishi najaf abadi3 *
1
Hydraulic Structure Faculty, Department of Civil Engineering,
Islamic Azad University of South Branch,
Tehran,
Iran
2
Department of Water and Environment Engineering,
Shahid Abbaspour College, Shahid Beheshti University,
Tehran,
Iran
3
Hydraulic structure Faculty, Department of Civil Engineering,
Islamic Azad University of South Branch,
Tehran,
Iran
http://dx.doi.org/10.12944/CWE.10.Special-Issue1.130
Every year many bridges worldwide destroy by the floods due to non-structural reasons, but mostly hydraulic design parameters. In this study, velocity and shear stress contour changes around the bridge piers of oval and circular shapes have been discussed and compared. 3-D modeling was done using Open FOAM software. Flow turbulence was considered using k-ε RNG turbulence model and governing equations were Navier-Stokes equations. The results showed that the bridge pier shape has a significant effect on the flow pattern and riverbed shear stress that is effective in prediction of the scour pattern. The results also showed that shear stress around the oval pier was lower than the circular one, and hence, less scour occurs around this type of pier.
Copy the following to cite this article:
Pirestani M. R, Abadi S. H. G. N, Rajaie M. Effects of Oval and Circular Piers on Velocity and Shear Stress Changes by Using Open FOAM Software. Special Issue of Curr World Environ 2015;10(Special Issue May 2015). DOI:http://dx.doi.org/10.12944/CWE.10.Special-Issue1.130
Copy the following to cite this URL:
Pirestani M. R, Abadi S. H. G. N, Rajaie M. Effects of Oval and Circular Piers on Velocity and Shear Stress Changes by Using Open FOAM Software. Special Issue of Curr World Environ 2015;10(Special Issue May 2015). Available from: http://www.cwejournal.org
Download article (pdf) Citation Manager Publish History
Introduction
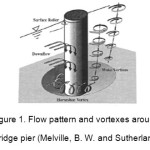
Generally, scour at bridge piers is divided into two categories of general and local scour. If the riverbed in bridge construction area washes out and takes a lower level than the upstream natural riverbed level, general scour has occurred. The local scour is riverbed elevation decrease around the constructed structures in comparison to the bed level, after occurrence of the general scour. Local scour around bridge piers occurs as a result of a vortex flow system which is in turn induced by the flow deviation by the bridge piers. The main vortex flow system, which helps in the formation of scour holes, is formed by the flow incidence to the pier face and downward deviation. After hitting the riverbed, downward flow forms a hole in front of the pier in which the rotational flow is created and hole depth is gradually increased. Rotating flow extends toward the sides in front of the pier and takes a horseshoe shape in plan, so it is called the horseshoe vortex. By passing the flow from the pier sides, a series of secondary flows occur which is in turn the main cause of the local scour. Richardson et al. (2001) showed that the local scour is the main cause of the bridge pier destruction. Secondary flows include Wake vortex system, Trailing vortex system, Horseshoes vortex system and Bow wave system (Figure 1) (Homayoun, S. and Shokri, N., 2011).
Horseshoe vortex is the main cause of scour hole formation in the front of the bridge piers. When the flow hits the bridge pier nose, flow velocity changes into a downward pressure. Since flow velocity has a descending trend downward from the surface to the bottom, dynamic pressure on the pier nose is also decreased from top to bottom and the created pressured gradient forms a downward flow toward the bottom. Part of the downward flow hits and digs the riverbed and then scatters in different directions. Part of the flow that returns toward the upstream, joins the main stream and hits the bridge pier. This flow rotation and return is the introduction to the horseshoe vortex formation. Changes of the scour hole depth are high at the beginning and decrease with time, but scour hole depth still increases with time (Fig. 1). Homayoun and Keshavarzi (2007) studied the effect of sector water-pier spacing on the size and depth of scour downstream of the bridge pier with circular cross-section (Homayoun, S., and Keshavarzi, A. 2008).
 |
|
Software Introduction
OpenFOAM, the abbreviation form for Field Operation and Manipulation open source, is an application for numerical simulation of flow and sediment in river and hydraulic engineering. One of the main advantages of the software is to present new tools and solvers based on the knowledge of the desired problem. In other words, by identifying the unknowns, physical parameters and other main variables of the problem and meanwhile, knowing the programming techniques, the user can create a file.
The main capability of the Open FOAM software in comparison with other CFD models is the possibility to change the default files and even to introduce undefined relations to the software.
Governing equations on turbulent flow
Governing equations on the incompressible fluid motion in turbulent state are expressed using averaged Navier-Stokes equations called Reynolds equations (RANS). Simplification and discretization of the differential equations in the software performed using Finite Volume and Central Difference methods.
k-ε Turbulence (RNG) model
In k-ε Turbulence (RNG) model, Kinetic energy (k) and Dissipation energy () equations are: (Bushehri, et al,. 2011)
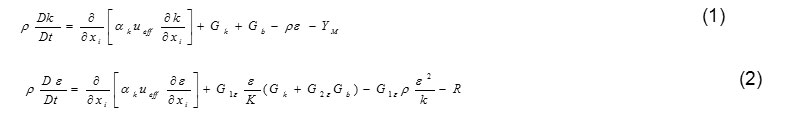
Where Gb is turbulence production due to buoyancy and YM presents the incompressibility. Also, Gk is defined as:

Model constants include G2ε = 1.68, G1ε = 1.68. In this model, the turbulent viscosity obtained by solving the differential equation:

Where ∇= uef/ μ and Cv ≈ . At high Reynolds numbers, turbulence viscosity is similar to the standard model as follows:

Where is equal to 0.0945.
Effect of bridge pier shape on the scour
According to Lee et al. (1961), the shape of the pier has a significant impact on the scour depth, because the horseshoe vortex strength depends on the pier shape. The oval pier causes less scour depth in comparison to circular pier. Bridges with pier cross sections that conform to the flow lines reduce flow separation and consequently, scour so that if the pier shape would be parallel to the flow lines, power of the horseshoe vortex system is significantly reduced and less scouring occurs (Hasouni Zade, H., 1991).
Sensitivity Analysis
Before output results of the software being obtained and analyzed, the accuracy of the results should be verified. For this purpose, it is necessary first to perform flow analysis on a simple and specific case and compare the results with the results by other researchers. In order to confirm the validity of the parameters influencing the phenomenon (i.e. mesh, proper turbulence model and flow pattern) experiment performed by Dargahi (1989) has been used. As can be seen from Table 1, in a network with 122,400 meshes, determination coefficient (R2) was closer to one, shorter run time was required and RMSE values (Rout Man Square Error) were less than other meshes, therefore it was selected as the optimal mesh.
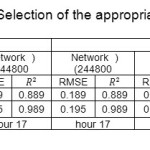 |
Table 1: Selection of the appropriate mesh Click here to View table |
Model calibration concerning the turbulence
Since the Reynolds number was considered as 4340*103 in modeling, flow regime was considered as turbulent. Therefore, to calibrate the model and select the best turbulence model, RNG K-ε, standard K-ε and realizable K-ε models were used. Flow velocity results for each of the turbulence models near the pier using the software were compared with the experimental results of Dargahi (1989). Result analysis showed that the RNG K-ε turbulence model was more accurate than other turbulence models. Results of the analysis are completely presented in Table 2. According to the table, the coefficient of determination and x coefficient corresponding to the fit line of RNG K-ε turbulence model were closer to one in comparison to other models. The RMSE value in this case was also less than the corresponding values of other turbulence models indicating that more accurate results were obtained using RNG K-ε turbulence model.
Table 2: Flow analysis results using different turbulence models
|
RNG K-epsilon Turbulence |
Turbulence K-epsilon standard |
Turbulence realizable K-epsilon |
|||||||||
|
ratio |
X |
RMSE |
ratio |
X |
RMSE |
ratio |
X |
RMSE |
|||
|
0.865 |
0.610 |
0.047 |
0.852 |
0.535 |
0.211 |
0.636 |
0.48 |
0.226 |
|||
|
0.989 |
0.190 |
0.982 |
0.294 |
0.781 |
0.613 |
||||||
Modeling procedure
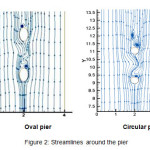
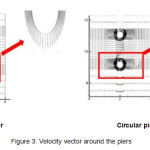
In this section, modeling of a channel using RNG K-ε turbulence model and a net with 122,400 meshes was performed to study flow pattern around bridge piers with different cross sections so that the only difference was the shape of the pier section. The channel length and width were 20 m and 4 m, respectively and with a flow velocity of 3.1 m/sec. As shown in Figure 2, according to flow pattern around each pier, it was clear that the flow separation around the oval pier was less than circular pier, therefore less flow turbulence and consequently, less scour occurred. Flow lines indicated that the vortex generated downstream of the spindle pier was less powerful than the other pier. Figure 3 shows the velocity vectors around the oval and circular piers.
 |
|
 |
|
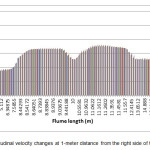
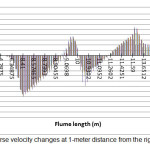
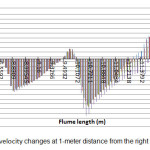
Longitudinal and transverse velocities changes in the channel at a 1-meter distance from the right side of oval and circular piers have been shown in the Figures 4 to 7. Longitudinal and transverse velocities changes were considered at heights of 0.3, 0.48 and 0.68 m from bed level and 0.86 m from water surface. As can be seen, longitudinal flow velocity was increased by reaching the pier due to a lower cross sectional area. Also, due to the effect of downward flows in front of the pier, transverse velocity was decreased. Lower longitudinal and transverse velocities were observed around the oval piers in comparison to the circular one. This indicates lower flow turbulence around the oval pier and therefore, a lower scour around this type of pier occurs.
 |
|
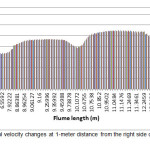 |
Figure 5: Longitudinal velocity changes at 1-meter distance from the right side of the circular pier Click here to View figure |
 |
|
 |
|
Distribution of the bed shear stress around the pier
To compare the shear stress around the pier, total normalized stress around the piers has been calculated which is in fact the sensitivity analysis of the stress parameter. This stress has been calculated using Equation (11). The closer the stress values to one, the more effective the shear stress in that area would be. In this study, maximum normalized shear stress and their critical locations upstream of the first pier row, between piers and downstream of the second pier row have been presented. Finally, the average bed shear stress at the pier and critical locations were compared. Bed shear stresses higher than the calculated critical value at the beginning of the study (0.028 kN/m2) will cause bed erosion and scour. Figure 4 shows the range of bed shear stresses in yellow to blue colors. Table 3 shows the normalized shear stresses at critical locations and Table 4 shows the average shear stress values. According to Table 4, the average bed shear stress values of the oval pier was lower than the circular pier, so that induces less scour around the oval pier. Figure 4 shows the shear stress contours at the riverbed and near the piers.

Table 3: Effect of the total normalized stress of the oval and circular pier
|
Pier shape |
Critical distance |
Total normalized stress |
|
oval |
6.19865 |
1 |
|
10.126 |
0.932 |
|
|
14.1835 |
0.940 |
|
|
circular |
6.19865 |
0.757008 |
|
12.6545 |
0.801456 |
|
|
15.7125 |
1 |
Table4: Comparison of the total shear stress at the oval circular pier
|
Pier shape |
Critical distance |
Total stress |
|
oval |
6.19865 |
0.0135 |
|
10.126 |
0.0038 |
|
|
14.1835 |
0.0111 |
|
|
circular |
6.19865 |
0.0136366 |
|
12.6545 |
0.00987722 |
|
|
15.7125 |
0.0146964 |
Conclusions
The results of the numerical model indicated that oval pier, due to the lower shear stress, flow separation and consequently, scour depth is the optimum pier shape in comparison to circular pier.Comparison of the longitudinal velocity changes showed that the longitudinal velocities around the oval pier were lower than the circular pier and hence, a less turbulent flow occurred around the oval pier.
Comparison of the transverse velocity changes along the channel showed that transverse velocities around the oval pier were less than the circular one, and downward flows in front of the oval pier were less powerful.
Comparison of the maximum shear stresses at the critical locations showed that the velocity changes near the oval pier caused lower shear stresses and hence, less scour occurred around this type of pier.
Comparison of the turbulence models showed that more powerful vortices formed around the circular pier in comparison to the oval pier indicating a more flow separation and formation of more destructive vortices around this type of pier.
References
- Homayoun, S. and Shokri, N., (2011), “Effect of the pier shape on the scour depth and profile around the bridge pier”, 11th Seminar on Irrigation and evaporation reduction, Kerman, Iran
- Homayoun, S., and Keshavarzi, A. (2008), “Effect of Sector water-pier spacing on the scour volume and depth downstream of the bridge pier with a circular cross section”, 4th National Congress of Civil Engineering, Tehran University, May.
- Melville, B. W. and Sutherland, A.J., (1998). “Scour protection at bridge piers”, J.Hyd.Eng.28, ASCE,Vol.114,No.10,P1210-1226.
- Bushehri, M., Montazeriyan, N., and Naderan Tahan, H., (2011) “Numerical modeling and investigation of the combined effects of inlet location on the efficiency of the primary sedimentation basin using FTC drawing method by OpenFOAM software”, 9th International Civil Engineering congress, Isfahan, Iran
- Hasouni Zade, H., (1991) “Experimental methods to predict local scour around the bridge piers”, MS Thesis, Shahid Chamran University, Ahvaz, Iran


