Optimization of MSW Collection Routes Using GIS (Case Study: Tabriz City)
Mahdi Ansari1 * , Saeed Pakrou1 , Mohammad Ali Abdoli2 and Abdolreza Karbasi2
1
Civil Engineering – Environmental,
Aras International Campus,
Iran
2
Civil Engineering – Environmental,
University of Tehran,
Iran
http://dx.doi.org/10.12944/CWE.10.Special-Issue1.107
This research is conducted with the purpose of optimizing the Municipal Solid Waste (MSW) collecting routs in terms of time and cost at the comprehensive waste management. The Network Analysis toolbox of the ArcGIS software is utilized to evaluate the optimal waste collection routes. The total traveled length for waste collection after finding the optimal routes by the software was equal to 368 kilometers for each day, which would result in 25.76 percent thrift in comparison with the existing case (496 km). In the current system, 24 machines are being used in collecting the waste which will be done by 21 machines considering the optimized model and would result in 12.5 percent thrift in the number of cars. The results indicate that repositioning the collecting containers using GIS techniques has insignificant role, less than 0.02 percent, in time and traveled distance.
Copy the following to cite this article:
Ansari M, Pakrou S, Abdoli M. A, Karbasi A. Optimization of MSW Collection Routes Using GIS (Case Study: Tabriz City). Special Issue of Curr World Environ 2015;10(Special Issue May 2015). DOI:http://dx.doi.org/10.12944/CWE.10.Special-Issue1.107
Copy the following to cite this URL:
Ansari M, Pakrou S, Abdoli M. A, Karbasi A. Optimization of MSW Collection Routes Using GIS (Case Study: Tabriz City). Special Issue of Curr World Environ 2015;10(Special Issue May 2015). Available from: http://www.cwejournal.org/?p=10265
Download article (pdf) Citation Manager Publish History
Introduction
The environment has been put in danger by unsustainable disposal of waste. This vulnerable issue is about the serious problems of environment in the world of today. The existing dominant methods of unprotected waste dumping anywhere has caused serious problems for the human health. This problem will bring irreversible consequences if its not managed properly. Great technological advances have been emerged recently. Geographical Information System (GIS) is among the technologies which has played a major role in the waste world in a short time. This system helps us to simulate the desired options in the SWM science and make the most influential decisions (Hugo Miguel, 2010). The objective of this research is to minimize the traveled length of solid waste collecting machines. Since the routing models use spatial data so much, technologies like GIS could be utilized.
The network analysis of the ArcGIS software is a powerful tool, which provides spatial analysis based on the network by which we can find routes, directions, closest center and closest service center. This tool enables the user to reconstruct the real network model dynamically and apply his desired limitations on it. These limitations may include: U-turn restrictions, speed limit, height limits and traffic conditions. The users are able to do the following things by using this tool:
- Finding the optimal travel route
- Identifying the closer vehicle or center
- Finding the travel direction
- Finding a service center around a site
Optimizing the MSW collecting routes is important, because of its high percentage in expenditures of collection and transportation sector out of the total amount for the waste management, about 60 to 80 percent, based on the estimations. Therefore, a simple upgrade in this section could have a significant impact on the total cost of waste management (Tchobanoglous, 1993). In this regard, this research is being investigated with the title of optimizing the MSW collection routes using GIS, a case study of Tabriz.
The common base of vehicles traveling in the streets of a particular city is being used in the mathematical modeling. The common method for modeling a city is to define a diagram in which every street is denoted by one or two arches (depending on the streets being one-way or two-way), and the intersections are determined with nodes. Each of the arches may have different weights which is being determined by the length of the streets, the time needed for turning that street, or other parameters. Thus, a town is determined by a regular collection of graphs G= (V; EΰA), in which V indicates nodes, E indicates the indirect corners, and A indicates the direct arcs.
This equation alone could not be adequate to model the route, for other restrictions should be considered, esp. restrictions about traffic. At an intersection, for instance, it may not be possible to turn left, or U-turn may be forbidden in some streets.
This restriction could be considered for a group of intersections by applying a fee. Tava refers to the cost of traveling to arch a from arch a by a turning in the intersection v. This cost could be considered infinite if the arches do not intersect at that point or U-turn is forbidden.
Consider now an example in which there is a disposal place; ; and all the collecting vehicles start their travel from that point and return back there. Suppose that all the number of vehicles are K and each set of Ks route is specified by a number of round trips all of which start from the disposal point. The number of round trips for each vehicle could be limited or unlimited. Another assumption is that each vehicle is limited to the Q amount of waste which could be the volumetric or weight limit. Each vehicle could carry this limitation at any given time.
Routing Problem
We will have a general view of routing problems here prior to providing mathematical formulas for the collection modeling. Routing problems are important fields in the optimization science, which have various functions. Generally, the first formula is being used from Eulers paper in Briggs Konigsburg.
The basic structure of this problem is usually a complex related graph. A complex graph G= (V, EΰA) includes direct and indirect links (the edges and arches linked). Being totally connected means that there is a direct route between any two nodes at V. There will be a related content with each connection, which represents the cost of doing it.
Solving Techniques
Researchers proposed three solving techniques using indirect CARP studies. The route scanning technique, incorporation and extension technique, and Ulusoy innovative technique; we utilized the route scanning method in this research.
Route Scanning Technique
The routes are being built in order in this method. In this technique, the closest arch in each step which needs service, is added to the route, provided that the capacity of the vehicle is not full. The formula limit in this step uses one of the following equations at random:
F1: Maximizes the cost of return to the disposal place
F2: Minimizes the cost of return to the disposal place
F3: Maximizes the ratio of qv/cv
F1: Minimizes the ratio of qv/cv
F1: Use the formula F2 if the vehicle is less than half full, otherwise use F1
Comercial Waste Problem
The only difference in comparison with residential waste is the number of containers, which is significantly less. This fact enables us to investigate the problem node to node.
Solution Structure
The optimized model should at first receive some initial data representative of the collecting method and includes:
- Topology ofthe city
- Location of waste containers
- The starting point of vehicles route
- The minimum and maximum number of vehicles
The model must produce a file based on this information, which includes a route for each one of the vehicles. These preliminary data could be provided from different ways. The map could be extracted from GIS sources. The information regarding the containers could be obtained from past information or elsewhere. All these information will be put into a single file after integration.
Dijkstras A
lgorithm
The network analysis plugin of the ArcGIS software, in this project, is used for the optimization of waste collection routes. As previously mentioned, this plugin uses the Dijkstras algorithm for the optimal routing.
The procedure of Dijkstras algorithm is as follows:
- Selecting the origin vertex
- The set S, including the vertices of the graph, is determined. This set was null at first and then with the development of the algorithm, it involves vertices with the shortest routs found for them.
- The origin of the vertex is put into S with the zero index.
- An equivalent index for the vertices out of S, the length of crest + the index of previous vertex, is considered. The new index is the lowest amount of previous index and the length of crest + the index of previous vertex if the vertex out of the set contains an index.
- A vertex with the lowest index is chosen from the vertices out of the set and is added to the S.
- This process continues from step 4 until the target vertex enters to the S. At the end, if the target vertex includes index, its index represents the distance between the origin and destination. Otherwise, there is no route between the origin and destination.
Although, another index could be considered for each vertex to find the route, representing the previous vertex at the traveled route. Therefore, the shortest route between two points can be found after finishing the algorithm and by following the previous vertices from the origin to destination.
Two things are being maintained implicitly while running the algorithm. One of them is the set S of vertices, in which the weight of the shortest route from the origin of them is specified, and the other one is the sequence d, in which the amount of d_v is the weight of the shortest route from the origin to v for each vertex of v; providing that all the vertices of this route are of the vertices inside S, except v. S is null at first, and the values of d for all the vertices except the origin are infinite, and the value for the origin is put zero. The algorithm chooses a vertex out of S in each step for which the d is minimum and adds it to the set S; then updates the values of d for adjacent vertices of that vertex. The algorithm must update the sequence of pi\, in which pi_v\ is the father of vertex v at the tree of shortest route, if needed.
Among the most important applications of this method could be the calculation of shortest distance between two points in a city through territorial routes.
Methods and Materials
Data Collection Tool
Library method is used in this research, so that the researcher collects the required information such as maps with spatial information and geographic coordinates by referring to library, scientific journals, and internet in order to create digital maps of streets to be used in the software; and experimental method is used for gathering the data of collection containers and modeling it on the digital maps prepared in the ArcGIS software.
The simple random sampling method is chosen for selecting the sample of the target population (MSW collection system of Tabriz), which was available at municipal region 2 of Tabriz.
Results
In this section, we are reviewing the current status of the collection system and analysis of input data in the optimization methods for the studying area under the ArcGIS software.
Current status of the Collection System for the Studying Area
Urban development and dispersion of various production sources at the municipal level range have caused the MSW collection as a very complex and costly dilemma to be considered constantly in the urban management and be the focus point of waste management.
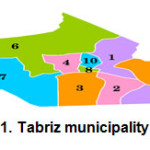
Tabriz city is composed of 10 independent municipality regions, the total population of this city was 1Ë378Ë935 in 2009, among which 314Ë071 persons are living in region 1; 280Ë261 persons are living in region 2; 327Ë799 persons are living in region 3; 301Ë561 persons are living at region 4; 65Ë092 persons are living at region 5; 24Ë627 persons are living in region 6; 48Ë454 persons are living in region 7; and 17Ë070 persons are living in region 8. Accordingly, the region 3 is the most populated region and the region 8 is the most sparsely populated region of Tabriz. The study area in this research is the region 2 of Tabriz city.
 |
|
MSW collection of this region is delegated qualified contractors under the supervision of municipality region 2 of Tabriz. This region is divided into three sub-domains:
Domain 1: Dr. Hesabi St., Zaferaniyeh town, Shabnam, Abrasan, Bozorgmehr, Emam Khomeyni St., 29 Bahman St.
Domain 2: Mirdamad, Rajaishahr, Villashahr, Elahiparsat, Kuy-e Dadgostari, Kuy-e Sahand, and Elgholi
Domain 3: Kuy-e Ferdows, Baghcheban, Yaghchiyan, Gholshahr, Parvaz, South Valiasr, Darvazeh Tehran
Equipment and machinery for collecting the waste at these domains are listed in Table 1.
Table 1: Equipment and machinery for collecting the waste at different domains of Tabriz
|
Number |
Domain |
Number of Mechanized Containers |
Number of Parked Containers |
Number of Mechanized Collection Vehicles |
Number of Manually Collection Vehicles |
Number of Garbage Collection Vehicles |
|
1 |
1 |
218 |
146 |
8 |
1 |
1 |
|
2 |
2 |
227 |
48 |
8 |
1 |
1 |
|
3 |
3 |
246 |
73 |
8 |
1 |
1 |
The main section of waste collection in this region and whole the city contains the mechanized collection containers and collecting vehicles.
Waste management organization of Tabriz possesses three transfer stations, among which the transfer station number 2 with the coordinates of 46° 20 59" E and 38° 1 4" N is located at the municipality region 2 of Tabriz.
The estimation of waste production amount in this region is about 110 tons per day, which could be increased to 130 tons per day regarding different days and seasons of the year. The solid waste in Tabriz city is mostly taken by two methods of beside the curb and automatic (mechanized) and is carried after loading by the special collecting vehicles to the transfer stations.
Collection frequency
According to the information received from municipality region 2 of Tabriz, the collection frequency at the studying area of this project is 7 days of the week.
The traveled routes for collecting the waste at current situation is provided in Table 2.
Table 2: Traveled routes for waste collection at current situation
|
Routes |
|||
|
Route |
Start Point |
End Point |
Total Traveled route (Kilometer) |
|
ROUTE1 |
station |
station |
33.0 |
|
ROUTE 2 |
station |
station |
31.0 |
|
ROUTE 3 |
station |
station |
28.3 |
|
ROUTE 4 |
station |
station |
27.6 |
|
ROUTE 5 |
station |
station |
24.9 |
|
ROUTE 6 |
station |
station |
24.6 |
|
ROUTE 7 |
station |
station |
24.5 |
|
ROUTE 8 |
station |
station |
24.0 |
|
ROUTE 9 |
station |
station |
23.3 |
|
ROUTE 10 |
station |
station |
22.6 |
|
ROUTE 11 |
station |
station |
28.3 |
|
ROUTE 12 |
station |
station |
21.0 |
|
ROUTE 13 |
station |
station |
20.1 |
|
ROUTE 14 |
station |
station |
18.6 |
|
ROUTE 15 |
station |
station |
18.0 |
|
ROUTE 16 |
station |
station |
16.9 |
|
ROUTE 17 |
station |
station |
21.8 |
|
ROUTE 18 |
station |
station |
22.3 |
|
ROUTE 19 |
station |
station |
28.6 |
|
ROUTE 20 |
station |
station |
19.9 |
|
ROUTE 21 |
station |
station |
16.7 |
|
ROUTE 22 |
station |
station |
18.5 |
|
ROUTE 23 |
station |
station |
13.7 |
|
ROUTE 24 |
station |
station |
13.4 |
|
Total |
496 |
||
The Performed Actions By Arcgis
The ArcGIS software uses spatial data in analysis, thus we needed the full map of study area in our research. Considering that there was no suitable map containing our needed information in any related organization, these maps were downloaded from the Internet.
A satellite map of the area is downloaded because of the incomplete basic map and the streets were added manually, which were not included in the initial map. After that, the information of every single street was evaluated and modified. This information is included the pattern of streets connection to each other and their moving direction.
We need to define at least one characteristic of the cost type in the network in order to be able to analyze the network of the streets by the programs algorithm. The objective of optimization here is the total collection time and the traveled distance, though we should define two characteristics of cost at the network, which would be like:
- Spatial Cost: this characteristic considers a characteristic length of the member as the cost for each line of the network representing the streets; meaning that the spatial cost of a desired route increases by the length of the street as we pass through that particular street.
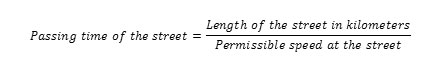
- Time Cost: this characteristic specifies a time for each street to be passed. This time is achieved by the length of the street and permissible speed in it.
The permissible speed was defined for each street on the provided map in order to create the network. This speed is considered based on the type of roads in Table 3.
Table 3: Permissible speed for different types of streets
|
Row |
Type of the Street |
Width of the Street |
Permissible speed (km/h) |
|
1 |
Main Streets |
More than 18 meters |
50 |
|
2 |
Side streets |
12 to 18 meters |
40 |
|
3 |
Wide Alleys |
8 to 12 meters |
30 |
|
4 |
Narrow Alleys |
6 meters |
20 |
The time cost of passing each street is calculated by software using these permissible speeds:
The maps were converted to the network dataset after preparation of received maps. The network dataset plugin is able to solve the problem, just in the case that the data are converted as network dataset.
A vehicle routing problem in the program is started after preparing the network of streets.
This problem is included
- These orders are containers in this research which should be collected. Each component in the ArcGIS software has a properties table, by using and editing which we can identify and review many parameters. The most important editable properties are: coordinate of the container location, the time limit specified for the service, setting the collection by special vehicles, identifying the location of the containers on the left or right side of the vehicle as required, etc.
The containers were inserted into the map after identifying the streets of the studying area. This region has 624 mechanized waste collecting containers based on the information received from the municipality region 2 of Tabriz. The locations of the containers are taken by a handheld satellite positioning device by researcher and put into the software. The following figure shows the studying area and collection containers on the map.
- Depot Visits. All the collection vehicles in this study start their route from the transfer station 2 of Tabriz and end it there. The coordinates of this station are put into the program manually. The location of the transfer station is indicated by a small blue square at the bottom right side of the picture.
- Collection Routes. These routes are the routes of collecting vehicles that should be started from the transfer station and return back there after collecting the size of their capacity. According to the information received from the municipality region 2 of Tabriz, 24 mechanized waste collection truck has been predicted to collect from 624 containers of the entire study area. Therefore, 24 routes are introduced to solve the problem. The table of route properties in the program includes many items, the most important ones of which are as follow:
- The start point, which is the transfer station 2 of Tabriz at this study
- The end point, which is the transfer station 2 of Tabriz at this study
- The maximum number of containers a vehicle could collect. This information is considered as 30 containers on average for one vehicle as the maximum number, using local research from waste collecting drivers and staff, because there was not enough documents about the number of containers being collected by one vehicle.
- Collection time for each container, which is considered as 3 minutes by the same process of local research for the time needed of installing the container on the jack of the vehicle, lifting it up, dumping, lowering and reinsertion of the container to its place.
It should be noted that the provided table of properties has many other items and only the used items are mentioned here.
According to the current collection technique, the studying area is divided into three parts, and the collection operations are being performed by three different contractors. These three parts are identified by the information received from the municipality region 2 of Tabriz and inserted into the program.
The program starts to process the containers and routes after inserting the information and clicking on the solve button, and provides the optimal possible situation for the collection.
The results of all the routes obtained from solving the routing problem for 24 collecting vehicles are presented in Table 4.
Table 4: The collection routes of optimized model by software
|
Route |
Start Point |
End Point |
Collection time of Each Container |
Capacity |
Number of Collected Containers |
Total Time of Collection (Minute) |
Total Traveled Distance (kilometer) |
|
Item1 |
station |
station |
3 |
30 |
28 |
153.62423 |
8/801353 |
|
Item2 |
station |
station |
3 |
30 |
28 |
158.51239 |
9/477548 |
|
Item3 |
station |
station |
3 |
30 |
26 |
175.09036 |
11/77083 |
|
Item4 |
station |
station |
3 |
30 |
30 |
163.29400 |
10/13900 |
|
Item5 |
station |
station |
3 |
30 |
30 |
170.78670 |
11/17549 |
|
Item6 |
station |
station |
3 |
30 |
30 |
183.99592 |
13/00277 |
|
Item7 |
station |
station |
3 |
30 |
30 |
194.62270 |
14/47280 |
|
Item8 |
station |
station |
3 |
30 |
30 |
206.21720 |
16/07671 |
|
Item9 |
station |
station |
3 |
30 |
30 |
189.64519 |
13/78425 |
|
Item10 |
station |
station |
3 |
30 |
29 |
195.21620 |
14/55490 |
|
Item11 |
station |
station |
3 |
30 |
30 |
215.69740 |
17/38814 |
|
Item12 |
station |
station |
3 |
30 |
30 |
247.13950 |
21/73763 |
|
Item13 |
station |
station |
3 |
30 |
29 |
237.33980 |
20/38201 |
|
Item14 |
station |
station |
3 |
30 |
30 |
210.91920 |
16/72716 |
|
Item15 |
station |
station |
3 |
30 |
30 |
227.22950 |
18/98342 |
|
Item16 |
station |
station |
3 |
30 |
30 |
255.15410 |
22/84632 |
|
Item17 |
station |
station |
3 |
30 |
30 |
237.41340 |
20/39219 |
|
Item18 |
station |
station |
3 |
30 |
30 |
244.27480 |
21/34136 |
|
Item19 |
station |
station |
3 |
30 |
30 |
259.31950 |
23/42253 |
|
Item20 |
station |
station |
3 |
30 |
30 |
268.79850 |
24/73379 |
|
Item21 |
station |
station |
3 |
30 |
30 |
357.55040 |
37/01114 |
|
Item22 |
station |
station |
3 |
30 |
|
|
|
|
Item23 |
station |
station |
3 |
30 |
|
|
|
|
Item24 |
station |
station |
3 |
30 |
|
|
|
|
Total |
620 |
4551.84099 |
368 |
||||
As it can be seen from Table 4, there are 21 routes for the collection. However, there are 24 routes defined as input for the program; this means that we could collect the solid waste of this region by 21 vehicles with the minimum distance and spent time.
The total traveled distance for waste collection in the studying area is 368 kilometers using the suggested routes of the program, and 2662 minutes are needed to collect.
The maximum time and traveled distance for one vehicle relates to the route 21 that is 267 minutes and 37 kilometers, respectively.
The current locations of collecting containers are entered in the location-allocation section of the program in order to optimize the collection system. This plugin will be applicable in situations that we have the approximate location and the required number of locations and want to locate them such that dealing with them would be cost effective in terms of time or distance.
The new locations of containers are entered again into the process of vehicle routing problem after repositioning the containers, and solved again with new data.
The results of this repeated analysis showed that there is an insignificant difference with the state of current locations of the containers.
Discussion and Conclusion
It is observed that the total traveled distance for the waste collection at each day is obtained 368 kilometers after finding the optimum routes by the software, which will result in 25.76 % thrift compared to the current traveled distance (496 km).
In the current system, 24 vehicles are being used for collection, which will be done by 21 vehicles with respect to the optimized model and therefore, will result in 12.5 % thrift in terms of the number of vehicles.
The results of repositioning the waste collection containers using GIS showed that this action has insignificant effect, less than 0.02 percent, in the time and distance of waste collection.
The vehicles responsible for collection, at the current collection system, are busy collecting the waste 8 hours a day, according to their contract with the contractor, which results in 192 working hours per day for 24 vehicles. The time needed for collection the waste at the optimized model is 75.86 hours, nearly 76 hours without considering the resting and wasted time; which indicates 60 % thrift or 116 hours less in the waste collection time in comparison with the current collection system (192 hours).
References
- Abdoli, M., Municipal Solid Waste Management System and its control methods, Organization of Recycling and conversion of material of Tehran Municipality. (1993)
- Amar, MR ; Katkar,A.; Improvement of solid waste collection by using optimization technique. International Journal of Multidisciplinary Research (2) Issue 4, April 2012, ISSN 2231 5780, (2012).
- Aminzadeh, B. Religious worldview and the environment, an introduction to Islams attitude toward nature, Journal of Ecology, 30, 97-106., (1998).
- Apaydin,M; Gonullu.T, Emission control with route optimization in solid waste collection process: A case study. S¯adhan ¯a. 33(2), 71–82. © Printed in India.(2008).
- Apaydin,M; Gonullu.T, Route optimization for solid waste collection :Trabozan(turkey)case study. Global NEST Journal, 9(1), 6-11, 2007
- Ashournezhad, Gh. Implementing fuzzy analytic network process in identifying the optimum location of waste transfer stations of Esfahan Province, Ecology, 39(3), 165-177. (2013)
- Ashtashil,V; Bhambulkar,v; Municipal solid waste collection routes optimized with ArcGIS network analyst/ (IJAEST) INTERNATIONAL JOURNAL OF ADVANCED ENGINEERING SCIENCES AND TECHNOLOGIES. 11(1), 202 – 207. (2011)
- CHALKIAS,C; LASARIDI,K; A GIS based model for the optimisation of municipal solid waste collection: the case study of Nikea, Athens, Greece. WSEAS TRANSACTIONS on ENVIRONMENT and DEVELOPMENT. 10(5). (2009).
- Ghose, M.K. ; Dikshit,A.K. ; Sharma, S.K. ; A GIS based transportation model for solid waste disposal – A case study on Asansol municipality. Waste Manag. ;26(11):1287-93, (2006)
- Hekmatniya, N. Estimation of domestic waste collection costs using WAGS software (case study: Yazd city), Third Conference on Environmental Engineering, Tehran, University of Tehran, Faculty of Environmental Engineering, (2009)
- Hugo, M; Peixoto, P; Optimization of municipal solid waste collection routes based on the containers ï¬ll status data.porto.university de porto. International Journal of Multidisciplinary Research,2(4), ISSN 2231 (2010).
- Karbasi, A. R., Domestic waste collected management using WAGS software (case study: municipality region 22 of Tehran). Environmental Science and Technology, 12. 3. (2010)
- Komilis, D. P; Conceptual modeling to optimize the haul and transfer of municipal solid waste, Journal of Waste Management. 28: 2355–2365. (2008).
- Majlesi, M., Analyzing the cost of collection and transfer of waste at the region 1 of Bandar Abbas city, Journal of Public Health in the Shahid Beheshti Medical Science University – Faculty of Health, 1(1), 37-45. (2013)
- Monavari, M,Management of collection and transportation of solid waste at the new city of Andisheh, Environmental Science and Technology, 12(4). (2010)
- Omrani, A., Alavi, N. and Nakhjavani, N., Solid Waste, First Edition, Second Publish, Publisher: Andishe-ye Rafie.(2010)
- Omrani, G. A., Waste Management, Volume II, Islamic Azad University Press.(2005)
- Tchobanoglous, G., Theisen, H. & Vigil, S.A. Integrated solid waste.management, Mc.Graw Hill, (1993)
- Yousefi, M., A combined method of ant populations for vehicle routing problem with Heterogeneous fixed fleet, Journal of Transportation, 9, 191. (2012)
- Zamoranoa, M., E. et al. A planning scenario for the application of geographical information systems inmunicipal waste collection: A case of Churriana de la Vega (Granada, Spain), Journal of Resources, Conservation and Recycling. 54: 123–133,( 2009).


