Characterization of Leachate and its Effects on Ground Water Quality Around Jawahar nagar Municipal Open Dumpsite, Rangareddy, Telangana
Soujanya Kamble. B 1 *
http://dx.doi.org/10.12944/CWE.11.1.15
In the present work, characterization of leachate from an open dumpsite, Jawaharnagar, Rangareddy district, Telangana and its effects on surrounding ground water was investigated. A total of one leachate sample and twelve ground water samples were collected during pre-monsoon and post-monsoon seasons(2015) for monitoring purpose. All the samples were analyzed for physico-chemical parameters(pH, TDS, TH, CH, Cl-, SO4-2, NO3- and F-) as per standard procedures(APHA). Results indicate that, only pH and sulphates were found to be within the permissible limits in ground water recommended by WHO:2006. Total dissolved solids, Chlorides and Nitrate levels were found to be alarming in both pre and post monsoon. Water quality index(WQI) study also showed that most of the water samples fall in “Poor” and “Unsuitable” category. It is evident that the leachate from the municipal dumpsite is polluting the ground water at greater extent making them unsuitable for drinking purpose. Therefore, immediate measures should be taken to control the leachate contamination in the ground water.
Copy the following to cite this article:
Soujanya K. B. Characterization of Leachate and its Effects on Ground Water Quality Around Jawahar nagar Municipal Open Dumpsite, Rangareddy, Telangana. Curr World Environ 2016;11(1) DOI:http://dx.doi.org/10.12944/CWE.11.1.15
Copy the following to cite this URL:
Soujanya K. B. Characterization of Leachate and its Effects on Ground Water Quality Around Jawahar nagar Municipal Open Dumpsite, Rangareddy, Telangana. Curr World Environ 2016;11(1). Available from: http://www.cwejournal.org/?p=13785
Download article (pdf)
Citation Manager
Publish History
Introduction
Management of solid waste and related environmental impacts presents a challenge to both developing and developed countries. Rapid industrialization, growing population and changing lifestyle are the root causes for increasing rate of solid waste generation. The quantum of municipal solid waste generated in India is about 0.15 million tons per day. This is approximately 50 million tons annually. Out of the total municipal waste collected, on an average 94% is dumped on land and 5% is composted. However, the average rate of MSW generation in India (0.35 to 0.60 kg/ person/day) is very low as compared to developed countries.1 The most widely used method for disposal of municipal solid waste is land filling. Landfills or open dumps are tremendously used for disposal of solid waste because they have capacity to accumulate large amounts of wastes offering very low cost as compared to incineration. For a long time, land filling was the most common waste management option for Municipal Solid Wastes (MSW). Not only is it a waste of resources but landfills as such constitute a health hazard and an environmental burden.2 Unconditional dumping of municipal solid wastes results in generation of toxic leachate, which percolates through the soil and finally reaches the water table affecting the ground waters.As the ground water is an important part of the hydrological cycle, it is more prone to various sources of contamination. Amongst the drawbacks, landfills have been identified as one of the major threats to ground water resources.3 Not only ground water resources, it equally affects the surface water bodies through the lateral movement of surface run-off as a result of precipitation. The toxicleachate may consists of large amounts of organic and inorganic compounds.4 In countries like India, where ground water is a major source of water supply for drinking and domestic purpose if leachate is not controlled it can contaminate the surrounding soils, vegetation, livestock, surface waters and ultimately the ground water. Ground water treatment of polluted aquifers is inefficient in terms of economy and is time consuming. Further, the contaminants may still remain in aquifers even after prolonged process of remediation. Therefore regular monitoring of the wells in terms of quality assessment is mandatory to control the pollution to the earliest either experimentally or through mathematical modeling. Therefore, a seasonal evaluation of groundwater quality was carried out in order to determine the status of the water for human consumption as well as to provide overall scenario of ground water contamination around the dumpsites which opens an avenue for establishment of well engineered landfill to achieve ground water sustainability. WQI is an important technique for demarcating water quality and its suitability for drinking purposes. It is defined as a technique of rating that provides the composite influence of individual water quality parameters on the overall quality of water for human consumption.5 It is one of the aggregate indices that have been accepted as a rating that reflects the composite influence on the overall quality of water quality characteristics. Higher value of WQI indicates better quality of water and lower value shows poor water quality. WQI helps us to translate multifaceted water quality data into simple information that is comprehensible and useable by the public. Several studies were carried out in order to estimate the water quality of ground waters around dumpsites during pre-monsoon and post monsoon seasons using WQI index.6,7,8,9,10 The main focus of this study was to assess the physical and chemical parameters of ground waters during pre and post monsoon, 2015.
Materials and Methods
Study Location
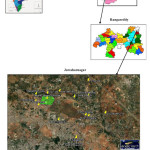
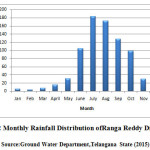
Jawaharnagar village dumpsite is located just outside the limits of GHMC(Greater Hyderabad Municipal Corporation) and inside the HMDA(New limits of Hyderabad). The site is 35km from Hyderabad city and 105km away from the state highway connecting Hyderabad and Nagpur in west direction from boundary of project site. It is an open dumpsite where unconditionally the solid wastes are dumped on a terraneous site called IrlaGutta (Gutta=Hill). The total area of Jawaharnagar dumpsite is 350 acres. The site receives Municipal Solid Waste of 5000 metric tons per day. It is located between 17Ëš29ʹ 21ʹʹN to 17Ëš31ʹ39ʹʹN latitude and 78Ëš34'13" E to 78Ëš37'47"E longitude(Fig:1).It has a tropical wet and dry climate bordering on a hot semi-arid climate. The annual mean temperature is 26 °C (78.8 °F). Summers (March–June) are hot and humid. Maximum temperatures often exceed 40 °C (104 °F) between April and June. Winter lasts for only about 2 1⁄2 months, during which the lowest temperature occasionally dips to 10 °C (50 °F) in December and January. May, the hottest has temperatures ranging from 26 to 38.8 °C. January, the coldest, has temperatures varying from 14 to 28 °C. Heavy rain from the south-west summer monsoon falls between June and September, supplying Rangareddy with most of its annual rainfall of 812.5 mm (32 in). Monthly rainfall distribution of the sampling year(2015) in Rangareddy district is presented in (Fig:2).Geology of area comprises of pink and grey granite rock formations.
 |
|
 |
|
Sample Collection
Leachate sample was collected in 1 litre pre-cleaned high density polyethylene bottle (HDPE) with diluted HNO3 during pre-monsoon and post monsoon(2015) and was stored in the laboratory at 4 ÌŠC for monitoring purpose within 2 days. Similarly, ground water samples were collected from 12 stations during pre and post-monsoon within 5km radius from the dumpsite employing random sampling method. Geographic locations, latitude, longitude of the sampling points were collected with the help of GARMIN GPS and the details are given in (Table:1). Each of the leachate and ground water samples were analyzed for 8 parameters viz., pH, TDS, TH, CH, Cl-, SO4-2, NO3- and F- using standard procedures recommended by.11 The pH was recorded on site at the time of sampling with digital pH meter(HANNA Inst. Italy). The physico-chemical parameters like Total Dissolved Solids(TDS), Total Hardness(TH),Calcium hardness(CH) and Chlorides(Cl-) of leachate, and ground water samples were analyzed titrimetrically. Chloride was included in the water quality assessment because of its measure of extent of dispersion of leachates in groundwater body.12 Nitrates and Fluoride determination was carried out using Ion-Selective Electrode(Orion). Sulfates (SO4-2) in the groundwater samples were analyzed by nephelometric turbidity method.
Table 1: Geographical Details Of The Study Area
|
S.No. |
Sampling Station |
Latitude |
Longitude |
Altitude |
Dist (km) |
|
1 |
Malkaram |
17 31 38 |
78 34 52 |
1858 |
1 |
|
2 |
Y.S.R. Nagar |
17 31 02 |
78 34 57 |
1859 |
1 |
|
3 |
Gabbilalpet |
17 31 01 |
78 34 45 |
1877 |
2 |
|
4 |
Haridaspally |
17 31 39 |
78 35 49 |
1796 |
1 |
|
5 |
Ahmedguda |
17 30 04 |
78 37 13 |
1703 |
1 |
|
6 |
IndirammaJn |
17 31 05 |
78 36 52 |
1722 |
2 |
|
7 |
Dammaiguda |
17 30 12 |
78 35 27 |
1763 |
2 |
|
8 |
Cheeriyal |
17 31 52 |
78 37 49 |
1770 |
4 |
|
9 |
Kundanpally |
17 29 56 |
78 38 16 |
1701 |
4 |
|
10 |
Yadgarpally |
17 32 56 |
78 37 49 |
1735 |
4 |
|
11 |
Nagaram |
17 29 21 |
78 36 00 |
1703 |
5 |
|
12 |
Godumkunta |
17 29 32 |
78 38 52 |
1688 |
5 |
Calculation of Water Quality Index
In this study, for the calculation of WQI, eight important parameters were chosen. The WQI has been calculated by using the standards of drinking water quality recommended by.13 The WAI(Weighted Arithmetic Index) method has been used for calculation of WQI of the water samples. Further, quality rating or sub index (qn ) was calculated using the following expression.
qn = 100[Vn –Vio ]/[S –Vio ] ...................(1)
qn= Quality rating for the nth water quality parameter
Vn = Estimated value of the nth parameter t a given sampling station
Sn = Standards permissible value of the nth parameter
Vio = Ideal value of the nth parameter in pure water(i.e.,0 for all other parameters except the parameter pH, where it is 7.0).
Unit weight was calculated by a value inversely proportional to the recommended standard value Sn of the corresponding parameter,
Wn = K/Sn ...................(2)
Wn = Unit weight for the nth parameter
Sn = Standard value for nth parameter
K = Constant for proportionality
The overall Water Quality Index was calculated by aggregating the quality rating with the unit weight linearly.
WQI = ∑qnWn/∑Wn ...................(3)
The maximum weight of 5 has assigned to the parameters like NO3-, TDS, Cl-, F-, and SO4-2, due to their major importance in water quality assessment.14
Results and Discussion
Leachate
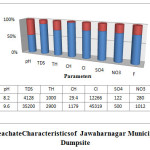
The physico-chemical characteristics of collected leachate around the dumpsite during pre-monsoon and post-monsoon were analyzed and presented in the (Fig:3).From the figure, it can be observed that pH is highly alkaline in nature. Alkaline pH is normally encountered at landfills, 10 years after disposal.15 Other analyzed parameters like TDS, TH, CH, Cl-, SO42-, NO3- and F- were found to have higher concentrations in the leachate collected during pre-monsoon season when compared to post monsoon leachate sample. The results were consistent with.16
 |
|
Major Cations and Anions
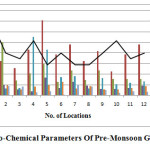
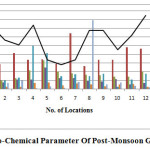
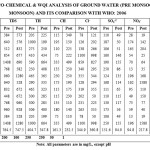
The results of physico-chemical analyses of ground water samples collected during pre-monsoon and post-monsoon of 2015 were shown in (Fig:4) and (Fig:5)and were compared with the World Health Organization(WHO:2006)as shown in(Table:2). The pH values of all the ground water samples collected during pre-monsoon and post-monsoon around dumpsite fall within the WHO(2006) limits indicating the alkaline nature. The TDS value of the ground water samples ranged from 384-1408mg/l during pre-monsoon season and from 528-1280mg/l which exceeded the permissible limits of WHO(2006). Concentration of TDS was maximum during pre-monsoon and reduced during post-monsoon which may be due to the dilution of the ions due to precipitation. Total hardness values of water samples rangedfrom 205-1000mg/l during pre-monsoon and 199-664mg/l during post-monsoon which were also above the permissible levels of WHO(2006). The calcium hardness ranged from 75-335mg/l during pre-monsoon and 110-499mg/l which were above the permissible levels according to WHO(2006). The chloride values ranged from 78-1100mg/l during pre-monsoon and 50-998mg/l during post-monsoon which were above the permissible levels of WHO(2006). Highest chloride concentration was observed in GW4 station collected during post-monsoon. The high chloride content in groundwater is from pollution sources such as domestic effluents, fertilizers, septic tanks, and leachates.17 Sulphates of water samples ranged from 16-250mg/lduring pre-monsoon and 49-155mg/l during post-monsoon. All samples fall within permissible limits of WHO(2006) Nitrate values ranged from 13-196mg/l during pre-monsoon and 19-1580mg/l during post-monsoon. Most of the water samples exceeded the WHO(2006) limits. Alarmingly, highest value was observed in GW8 (1580mg/l) collected in poultry farm present within the study area during post-monsoon which is a point source of pollution. About 50-80% of nitrogen is excreted18 by the livestock which can be easily leached to the ground water table posing threat to the groundwater resources. In general, other major sources for nitrate in ground-water include domestic sewage, runoff from agricultural fields, and leachate from landfill sites. Higher concentration of NO3- in water causes a disease called ‘‘Methaemoglobinaemia’’ also known as ‘‘Blue-baby Syndrome’’. This disease particularly affects infants that are up to 6 months old.19 Fluoride values of waters ranged from 1.2-1.7mg/l during pre-monsoon and 1.1-1.9mg/l during post-monsoon season. Most of the samples are slightly higher than the permissible (WHO:2006).
 |
|
 |
|
 |
|
Water Quality Index (WQI)
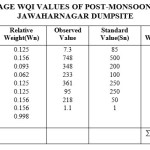
Water quality index developed for the groundwater samples collected during pre-monsoon and post-monsoon indicated that there is a wide variation from station to station. In this study, WQI values were 136.5 and 164.4 in pre and post monsoon respectively(Table:3) and (Table:4). According to20,75% of water samples fall in “Poor” category, 25% fall in “Good” category collected during pre-monsoon. Similarly, 75% of water samples fall in “Poor” category, 16.9% of water samples fall in “Good” category and 18.3% of water samples fall in “Unsuitable” category collected during post-monsoon season(Table:5).
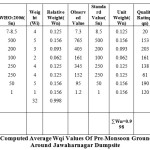 |
Table 3: Computed Average Wqi Values Of Pre-Monsoon Ground Waters Around Jawaharnagar Dumpsite Click here to View table |
 |
|
Table 5: Classification Of Pre-Monsoon And Post-Monsoon Ground Water Quality Based On Wqi Value
|
WQI Value |
Water Quality |
Percentage of GW Samples |
Percentage of GW Samples |
|
Pre Monsoon |
Post Monsoon |
||
|
<50 |
Excellent |
Nil |
Nil |
|
50-100 |
Good |
25% |
16.9% |
|
100-200 |
Poor |
75% |
75% |
|
200-300 |
Very Poor |
Nil |
Nil |
|
>300 |
Unsuitable |
Nil |
8.3% |
Correlation Analysis Of Pre-Monsoon And Post-Monsoon Ground Water Parameters
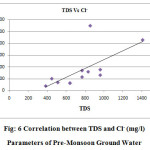
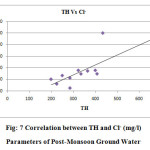
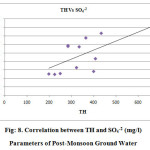
Correlation is a method used to evaluate the degree of interrelation and association between two variables.21 A correlation of 1 indicates a perfect positive relationship between two variables. A correlation of -1 indicates that one variable changes inversely with relation to the other. A correlation of zero indicates that there is no relationship between the two variables. Correlation matrix of pre and post monsoon ground water parameters of the study area are represented in (Table:6) and (Table:7).In pre-monsoon season, the influence of TDS on CH and Cl- were observed to have positive correlation. The positive correlation between TDS and CH(r=0.730) is normal and is responsible to a large extent of calcium hardness of water. Positive correlation of TDS with Cl(r=0.66) is shown in (Fig:6). In post-monsoon season, TH was positively correlated with Cl-(r=0.766) CH(r=0.617), and SO4-2(r=0.658)(Fig:7) and (Fig:8). This result indicates that there was great reliance of hardness on calcium, chlorides and sulphates.
Table 6: Correlation Matrix Of Pre-Monsoon Ground Water
|
|
pH |
TDS |
TH |
CH |
Cl- |
SO4-2 |
NO3- |
F- |
|
pH |
1 |
|||||||
|
TDS |
-0.56239 |
1 |
||||||
|
TH |
-0.24759 |
0.297768 |
1 |
|||||
|
TH |
-0.59079 |
0.730952 |
0.452917 |
1 |
||||
|
Cl- |
-0.05663 |
0.66473 |
0.144608 |
0.188295 |
1 |
|||
|
SO4-2 |
-0.2597 |
0.413605 |
0.242431 |
0.322037 |
0.27596066 |
1 |
||
|
NO3- |
-0.59171 |
-0.01683 |
0.454436 |
0.309294 |
-0.2714739 |
-0.2306 |
1 |
|
|
F- |
-0.10585 |
-0.17716 |
-0.43997 |
-0.3552 |
-0.2200465 |
-0.09241 |
0.021369 |
1 |
Table 7: Correlation Matrix Of Post-Monsoon Ground Water
|
|
pH |
TDS |
TH |
CH |
Cl- |
SO4-2 |
NO3- |
F- |
|
pH |
1 |
|||||||
|
TDS |
-0.1574 |
1 |
||||||
|
TH |
-0.31802 |
0.064187 |
1 |
|||||
|
TH |
-0.45206 |
-0.1743 |
0.617686 |
1 |
||||
|
Cl- |
0.013082 |
-0.00072 |
0.766779 |
0.38716907 |
1 |
|||
|
SO4-2 |
-0.37461 |
0.228926 |
0.658442 |
0.35664521 |
0.596911 |
1 |
||
|
NO3- |
0.142199 |
-0.26452 |
-0.08622 |
-0.1554513 |
-0.12873 |
0.132874 |
1 |
|
|
F- |
0.331722 |
-0.16816 |
-0.18182 |
0.01231033 |
-0.37028 |
-0.16887 |
0.130479 |
1 |
 |
|
 |
|
 |
|
Conclusion
Municipal landfills and open dumps have been posing a threat to a greater extent by contaminating the surroundings especially the ground water resources. The study reveals that the unconditional dumping of the wastes in Jawaharnagar dumpsite and establishment of inappropriate leachate collecting systems has extremely polluted the ground waters over time. The findings conclude that, most of the water samples were found to be unsuitable for drinking purpose except for few and therefore puts emphasis on enforcement of governmental policies on waste disposal and management, citing of dumpsites far away from residential areas to minimize pollution, waste sorting and treatment before disposal and constructing well engineered landfills to avoid the leachate percolation into the ground waters.
Acknowledgement
The study would not have been possible without the support and assistance of Dr. M. Ramana Kumar, Lab In-charge, Department of Applied Geochemistry,University College of Sciences, Osmania University, Hyderabad.
References
- Akolkar A. B. Asia Pacific Regional Workshop on Sustaianable Waste Management,1- 6,(2002).
- Ettler VMihaljevic M., Matura M., Sebek O., Bezdicka P. Temporal variation of trace elements in waters polluted by municipal solid waste landfill leachate. Bulletin of Environmental Contamination and Toxicology,80:274-279.(2008).
CrossRef - UstohalovaV,TimRicken, RenatusWidmann. Estimation of landfill emission lifespan using process oriented model. Waste Management, 26, 442-450(2006).
CrossRef - Bodzek V, Åobos-Moysa M.E, and Zamorowskaet. M. Removal of organic compounds from municipal landfill leachate in a membrane bioreactor Desalination,198:16-23,(2006).
CrossRef - Tiwari, T.N. and Mishra.M.A. A Preliminary assignment of water quality index of major Indian rivers.Indian Journal of Environmental Protection,5:276-279,(2013).
- Anju Anil Kumar, Dipu Sukumaran, SalomGnanaThanga Vincent. Effect of Municipal Waste of Ground Water Quality of Thiruvananthapuram District, Kerala, India, Applied Ecology and Environmental Sciences, Vol(3),No.5: pp 151-157,(2015).
- S.Sharma and Chippa, Global Journal of Environmental Science and Management,2(1):79-86(2016).
- Badmus B.S, Ozebo V.C, Idowu O.A, Ganivu S.A, Olurin O.T. Seasonal Variations of Physico Chemical Properties and Quality Index of Groundwater of Hand-Dug Wells Around Ajakanga Dump Site in Southwestern Nigeria. Research Journal of Physics, Vol(9):1-10. (2015).
- IshakuJ. M.. Assessment of Ground Water Quality Index for Jimetayola Area, Northeastern Nigeria, Journal of Geology and Mining Research Vol.3(9):pp 219-231(2011).
- Abdulrafiu O Majolagbe Adebola A. Adeyi and Oladele Osibanjo. Vulnerability assessment of groundwater pollution in the vicinity of an active dumpsite (Olusosun), Lagos, Nigeria.Chemistry International 2(4):232-241,(2016).
- American Public Health Association(APHA),. Standard method for the examination of water and waste water(21st edition) Washington D.C. (2005).
- Chapman D A guide to the use of BIOTA sediments and water in environmental monitoring water quality assessments UNE-SCO/WHO/UNEP. Chapman and Hall, London, pp 371–460(1992)
CrossRef - WHO, Guidelines for Drinking-Water Quality, Geneva, Switzerland.(2006).
- Srinivasamoorthy K, Chidambaram S and Vasanthavigar. Geochemistry of fluorides in groundwater: Salem district, Tamilnadu, India, Journal of Environmental Hydrology, Volume 16:Paper 25 August (2008).
- El-Fadel M, Bou-Zeid E, Chahine W, Alayli B. Temporal variation of leachate quality from pre-sorted and baled municipal solid waste with high organic and moisture content. Waste Manag(Oxford),22(3):269–282,(2002).
CrossRef - Esakku.S, ObuliKarthik, Kurian Joseph, Nagendran. R Seasonal Variations in Leachate Characteristics from Municipal Solid Waste Dumpsites in India and SrilankaProceedings of the International Conference on Sustainable Solid Waste Management, 5 - 7, Chennai, India. pp.341-347(2007).
- McCarthy MF. Should we restrict chloride rather than sodium, Med Hypotheses 63:138–148, (2004).
CrossRef - Arogo.J, Westerman, P.W., Heber, A.J., Robarge, W.P. and Classen, J.J. Ammonia in animal production – a review. Paper number 014089, 2001 presented at the ASAE Annual Meeting July 30– August 1, 2001, Sacramento, USA. American Society of Agricultural and Biological Engineers. 2001.
- Kapil DM, Mamta K, Sharma DK. Hydrochemical analysis of drinking water quality of Alwar District Rajasthan. Nature Sci 7(2):30–39,(2009).
- Ramakrishna C.H, Rao D.M, Rao K.S, Srinivas N. Studies on ground water quality in slums of Visakhapatnam, Andhra Pradesh, Asian J. Chem., 21(6):4246-4250,(2009).
- Nair GA, Mohamed AI, Premkumar K. Physico chemical parameters and correlation coefficents of ground waters of North–East Libya. Pollut Res 24(1):1–6,(2005).


