Estimation of Runoff for Ozat Catchment using RS and GIS Based SCS-CN Method
Dipesh B. Chavda 1 , Jaydip J. Makwana 2 * , Hitesh V. Parmar 3 , Arvind N. Kunapara 2 and Girish V. Prajapati 2
1
Department of Farm Machinery and Power,
College of Agricultural Engineering and Technology,
Junagadh Agricultural University,
Junagadh,
India
2
Centre of Excellence on Soil and Water Management,
RTTC,
Junagadh Agricultural University,
Junagadh,
India
3
Department of Soil and Water Engineering,
College of Agricultural Engineering and Technology,
Junagadh Agricultural University,
Junagadh,
India
http://dx.doi.org/10.12944/CWE.11.1.26
Estimation of runoff in a watershed is a prerequisite for design of hydraulic structures, reservoir operation and for soil erosion control measures. Water resource planning and management is important and critical issue in arid and semi-arid regions. Runoff from a watershed affected by several geo-morphological parameters and for a particular watershed land use change can affect the runoff volume and runoff rate significantly. Several methods are investigated to estimate the surface runoff from a catchment but the Curve Number method is mostly used. Present study was undertaken to estimate surface runoff and water availability for two sites (Ozat-2 and Zanzesri) in the Ozat catchment situated in Junagadh, Gujarat, India using RS and GIS based curve number method. The Weight curve number for the ozat catchment is 73.00. The correlation coefficient between calculated and observed runoff was good for both catchments. In this study found that SCS-curve number method along with RS and GIS can be used successfully in semi-arid region to simulate rainfall runoff and to estimate total surface water.
Copy the following to cite this article:
Chavda D. B, Makwana J. J, Parmar H. V, Kunapara A. N, Prajapati G. V. Estimation of Runoff for Ozat Catchment using RS and GIS Based SCS-CN Method. Curr World Environ 2016;11(1) DOI:http://dx.doi.org/10.12944/CWE.11.1.26
Copy the following to cite this URL:
Chavda D. B, Makwana J. J, Parmar H. V, Kunapara A. N, Prajapati G. V. Estimation of Runoff for Ozat Catchment using RS and GIS Based SCS-CN Method. Curr World Environ 2016;11(1). Available from: http://www.cwejournal.org/?p=13583
Download article (pdf)
Citation Manager
Publish History
Introduction
Agricultural systems in India need improved management strategies to increase their level of self-sufficiency in terms of food production. Increased occurrence of extreme hydro-meteorological events due to climate change, population growth, and anthropogenic land and water degradation is likely to affect agricultural systems in near future more severly. An increase in food production can only come from four sources such as capturing local rain, horizontal expansion of agriculture, food imports, or lower calories diets (Rockstrom and Barron, 2007). In India the main source of water is precipitation and the effective perception are most important for the agriculture. Effective precipitation is directly resultant into runoff. A watershed comprises a piece of land whose runoff is passed through a single outlet point. There are many models to develop the rainfall-runoff relationship. In conventional models the only hydro-meteorological data are required. Traditional method for runoff estimation by composite CNs using tables and charts are time consuming and tedious. To overcome these problems SCS-CN method coupled withRS and GIS facilitate fast and accurate estimation of composite CN and accurate estimation of runoff (Zhan and Huang, 2004; Xu, 2006).
The conventional SCS-curve number method is widely used for estimate the direct runoff volume. United State Department of Agriculture has developed the SCS-Curve number method. Due to its simplicity, that became the most popular method for small watershed (Mishra and Singh, 2002). Ponce and Hawkins (1996) explained its concept with its capabilities, drawbacks and uses after critical examination of its conceptual and empirical basis and provided area of research in future. Grove et al. (1998) dicussed the changes of Curve Numbers Effects on Estimates of Storm Runoff Depthsevaluated that the effect of spatial variability of Curve numbers on runoff estimation. Pradhan et al. (2010) used SCS model with using land use/land cover, soil map and rainfall value for estimating runoff. Murmu and Bis was (2012) estimated runoff of a catchment using SCS- CN method in Damodar sub catchment. Nohegar et al. (2013) found the weighted curve number of a watershed using the RS and GIS techniques.Dhawale (2013) carried out a case study for highlighting the role of GIS and RS in SCS- curve number method for estimation of direct surface runoff from the Darewadi watershed.The objective of the present study are to determine the weight curve number for the catchment area and to estimate surface runoff in two sites (Ozat-2 and Zanzesri) in the Ozat catchment situated in Junagadh, Gujarat, India.
Study Area
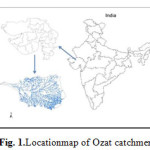
Ozat catchment, situated in Gujarat, India which is located between 21° 08’ 01”N latitude and 70° 18’ 12” E longitude, was selected in this study (Fig.1). The total catchment area is 1409.16km2. The climate of the study area receives rainfall South-West monsoon with an average of 921 mm. In this region the rainfall is scanty and erratic nature and 80% of the total monsoon rainfall occurs during the months July to August. The major crops of the study area are Groundnut, cotton, mango, etc.
 |
|
Methodology
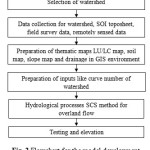
The methodology to achieve the goals and objectives of the present study is shown in this Fig. 2 which shows the flow chart for the model development. The various steps involved in the model development are as follows:
 |
|
SCS-Curve Number Method
Curve number method is developed by the United States Department of Agriculture (USDA) the Soil Conservation Service (SCS) for estimating the direct runoff volume. SCS-Curve number method is based on the below relationship between rainfall, P (mm), and runoff, Q (mm) (USDA-SCS 1985).
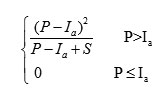
where S (mm) is maximum potential retention.The empirical relationship between initial abstraction (Ia) and maximum potential retention (S) is as given as Ia=0.1S for Anticident moisture contect (AMC)II, III and Ia=0.3S for the AMC I. Bhattacharya (1998) found that Ia=0.2S has been produce a good results for several watershed of India, with varying types of soils, rainfall and land cover conditions.
In this study to calculating the direct runoff depth first to remove initial abstraction. The empirical combination of maximum potential retention and rainfall, based on Ia = 0.2S gives as
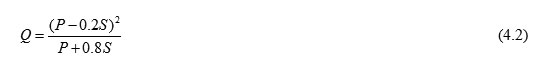
The maximum potential retention(S), is varies with antecedent soil moisture and other variables and it calculated using the curve number values. the relationship of maximum potential retention(S) and curve number (CN) is given as,
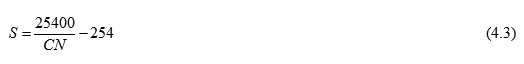
The Curve number (CN) is dimensionless and values vary from 0 to 100. The curve number calculated on the basis of land use/land cover, soil type and antecedent moisture content. A high curve number value indicates the layer is impermeable. If the curve number value 100 indicates that the all rainfall resultant in runoff.
Surface Water Harvesting
Available surface water storage capacity of different water harvesting structures can be calculated by,
V = C. A. H (6)
Where,V = Volume of water that can be held by the structure, A = Submerged area(m2),H = Maximum water depth (m) and C = Constant value of storage Capacity.
Results and Discussion
Thematic Maps of Ozat Catchment
The maps of watershed boundary, drainage pattern/network, land use, soils were digitized and processed under GIS environment using ArcGIS software in the study area.
Land use map
The Land use map of Ozat catchment is classified into six dominant categories viz. agricultural land, built-up, forest, pasture, wastelands and water bodies. The land use categories are presented in Fig. 3 and Table 1.
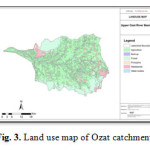 |
Figure 3: Land use map of Ozat catchment Click here to View figure |
Table 1: Area of land use in Ozat chatch ment
|
Sr. No |
Land use |
Area, km² |
Percent (%) |
|
1 |
Agriculture |
1004.79 |
71.30 |
|
2 |
Wastelands |
115.26 |
8.18 |
|
3 |
Built-up |
16.15 |
1.15 |
|
4 |
Forest |
225.29 |
15.99 |
|
5 |
others |
19.94 |
1.42 |
|
6 |
Water bodies |
27.73 |
1.97 |
|
Total |
1409.16 |
100.00 |
|
Soil Map
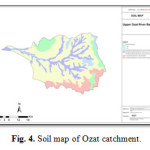
The soil texture map shows that major parts of the basin area are having poor natural recharge. However, the flat topography favours for more infiltration opportunity time leading to considerable entry of runoff water below the soil surface. The soil map is as shown in Fig. 4.
 |
|
Estimation of Runoff using Curve Number method
The Curve Number method is used for estimating the direct surface runoff volume using the recorded rainfall data and weighted curve number of the Ozat catchment. SCS-curve number method takes into account the parameters characterizing a farm such as land use, soil cover, antecedent moisture condition and wetness for estimating yield from the area. These parameters are used to calculate the curve number for Ozat catchment as shown in Table 2. The curve number indicates the runoff potential of a complex storm during the particular period.
Table 2: The land use and weighted curve number of Ozat catchment
|
Sr. No. |
Land use |
Area, km2 |
CN |
Weighted Curve Number |
|
1 |
Agriculture, row |
968.31 |
78 |
73.0 |
|
2 |
Orchard |
84.23 |
54 |
|
|
3 |
Deciduous forest (Moist/Dry) |
138.28 |
44 |
|
|
4 |
Fellow waste land |
77.16 |
86 |
|
|
5 |
Built-up and Farmstead |
84.77 |
74 |
|
|
6 |
Pasture |
49.43 |
69 |
|
|
|
Total |
1402.18 |
|
|
|
AMC |
I |
II |
III |
|
|
CN |
54 |
73 |
87 |
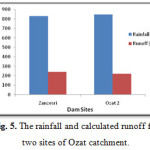
After calculate the curve number value, the maximum potential retention (S) is calculated using equ. 4.3. By considering antecedent moisture condition of previous five days rainfall, maximum potential retention and rainfall data the daily runoff was estimated. The runoff for different sites of Ozat catchment was calculated and the total rainfall, calculated runoff and the percentage runoff for the year 2011 are presented in Table 3 and Fig. 5.
Table 3: Runoff estimation using curve number technique
|
Sr. No. |
Dam site |
Rainfall (mm) |
Runoff (mm) |
Runoff (%) |
|
1 |
Zanzesri |
833 |
242.58 |
29.12 |
|
2 |
Ozat 2 |
850 |
221.92 |
26.11 |
|
Average |
841.5 |
232.25 |
27.615 |
 |
|
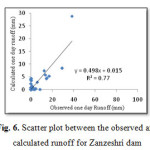
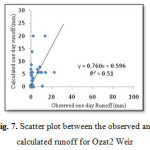
To check the performance of curve number method, the calculated daily runoff and the observed daily runoff data were plotted using MS Excel to develop the relationship between them. Different models were used to find the best correlation coefficient of the data.The coefficient of determination between observed and calculated daily runoff for different sites like Zanzesri and Oz at 2 have 0.77 and 0.51 respectively for the year 2011 are shown in Figs. 6 and 7.
 |
|
 |
|
Surface Water Harvesting
There are number of water harvesting structures have been constructed in Vanthlitaluka by Irrigation Department - Junagadh, Gujarat State Land Development Corporation – Junagadh, District Rural Development Agency – Junagadh and NGOs. The information like number of water harvesting structures, their respective storage capacity etc were collected from respective Department, Agencies or NGOs of Vanthlitaluka to find out total surface water harvested in different water harvesting structures are shown in Table 4.
Table 4: Surface water harvesting
|
Sr. No. |
Water Harvesting Structure |
Maximum depth of water (m) |
Storage Capacity (MCM) |
Total runoff passed (MCM) |
|
1 |
Zanzesri |
9.81 |
9.79 |
7.00 |
|
2 |
Ozat 2 |
5.00 |
27.71 |
218.72 |
|
Total |
- |
37.5 |
225.72 |
Conclusion
Rainfall runoff simulation is important for water resources planning and management. This study is undertaken to estimate the surface runoff and flow volume in upstream of two water harvesting structures on Ozat catchment using Conventional method of Curve Number method along with RS and GIS. Estimation of curve number was carried out with extracted geo-morphological data such as land use, soil type, drainage, etc under the environment of RS and GIS. In this study it is found that combination of curve number method with environment RS and GIS can improve the model performance significantly. In this study also found that GIS is the efficient tool for preparation of thematic maps as input for SCS-curve number method. GIS was used to find out the weighted curve number for antecedent moisture condition-II for year 2011 that was found out as 73 for the Ozat catchment. The maximum coefficient of determination was found between observed and calculated runoff as 0.77 for Zanzesri dam of Ozat catchment. The total surface water generated in the main water harvesting structure was found as 37.5 MCM and the total runoff passed from different water harvesting structure was 225.72 MCM for the year 2011. It is to be noted that SCS-CN method was formulated for humid catchments, yet it is found to be a suitable method for semi-arid regions of Gujarat. Overall it is found in this study that curve number method along with environment of RS and GIS techniques is very efficient and accurate for modelling rainfall-runoff and to estimate total surface runoff.
References
- Dhawale, A. W. (2013). Runoff Estimation for Darewadi Watershed using RS and GIS. International Journal of Recent Technology and Engineering.1(6):46-50.
- Grove, M., Harbor, J. and Engel, B. (1998). Composite verses Distributed Curve Numbers: Effects on Estimates of Storm Runoff Depths. Journal of the American Water Resources Association. 34(5):1015-1023.
CrossRef - Mishra, S. K. and Singh, V. P. (2002). SCS CN based hydrologic simulation package, Mathematical models of small watershed hydrology and applications.pp-391-464.
- Murmu, S. and Biswas, S. (2012). Application of Remote Sensing and GIS Technique in Runoff Estimation of a Catchment using SCS Model. Proceedings of the Regional Conference of the International Network of Women Engineers & Scientists (Inwes), New Delhi, India.
- Nohegar, A., Bodaghi, M., Kamali, A., Ghashghaee, N. and Ghaemi, S. (2013). Application of Remote Sensing Techniques and GIS for Estimating the Runoff of Sikhuran Watershed. International Symposium on Advances in Science and Technology, Bandar – Abbas, Iran.
- Ponce, V. M. and Hawkins, R. H. (1996). Runoff curve number: Has it reached maturity?, Journal of Hydrologic Engineering. 1(1):11-19.
CrossRef - Pradhan, R., Pradhan, M. P., Ghose, M. K., Agarwal, V. S. and Agarwal, S. (2010). Estimation of Rainfall-Runoff using Remote Sensing and GIS in and around Singtam, East Sikkim. International Journal of Geomatics and Geosciences. 1(3):466-476.
- Rockstrom, J. and Barron, J. (2007). Water productivity in rainfed systems: overview of challenges and analysis of opportunities in water scarcity prone savannahs. Irrigation Science. 25:299-311.
CrossRef - USDA-SCS. (1985). National Engineering Handbook, Section 4 - Hydrology. Washington, D.C.
- Xu, A. L. (2006). A New Curve Number Calculation Approach using GIS Technology. ESRI 26th International User Conference on Water Resources.
- Zhan, X. Y. and Huang, M. L. (2004). ArcCN-Runoff: An ArcGIS Tool for Generating Curve Number and Runoff Maps. Environmental Modeling & Software. 19:875-879.
CrossRef


