Evaluation of Water Quality of Kaveri River in Tiruchirappalli District, Tamil Nadu by Principal Component Analysis
Monikandon Sukumaran 1 and Kesavan Devarayan 2 *
http://dx.doi.org/10.12944/CWE.11.1.12
Principal component analysis is a unique technique for reducing the dimensionality of the data. In this study, ten water quality parameters of the river Kaveri observed at five different stations of Tiruchirappalli for six years were collected and subjected to principal component analysis. A computational program was prepared in order to process and understand the data as a cluster. At first necessary data for compiling the program were listed and then fed to the program. Then the outputs were analyzed and possible linear and non-linear relationships between the water quality parameters and the timeline. It is understood that biological oxygen demand and fecal coli had a linear relationship. Further, the results suggested for group of factors that influence the water quality in a particular year.
Copy the following to cite this article:
Sukumaran M, Devarayan K. Evaluation of Water Quality of Kaveri River in Tiruchirappalli District, Tamil Nadu by Principal Component Analysis. Curr World Environ 2016;11(1) DOI:http://dx.doi.org/10.12944/CWE.11.1.12
Copy the following to cite this URL:
Sukumaran M, Devarayan K. Evaluation of Water Quality of Kaveri River in Tiruchirappalli District, Tamil Nadu by Principal Component Analysis. Curr World Environ 2016;11(1). Available from: http://www.cwejournal.org/?p=13935
Download article (pdf)
Citation Manager
Publish History
Introduction
Among the water bodies, rivers are the most vulnerable to pollution due to erosion and dissolution of minerals from overlying rocks as well as anthropogenic activities such as discharge of industrial effluents and municipal sewage into rivers. Pollution of river water causes alteration in species composition and decreased health of both aquatic and human communities. As a common practice, the water quality of rivers is monitored periodically by measuring multiple parameters at different monitoring stations. This measurement results in large number of complex physico-chemical and biological parameters which should be further assessed to understand the water quality.
Since rivers are the most important resources for human consumption, it is important to have reliable and easily understandable information on the characteristics of water quality and its trend for effective water management. Several preceding researches applied different analysis techniques such as water quality indices (WQI), structural dynamic models, fuzzy logical inference and others for evaluation of water quality. However, these methods are not applicable for large scale data and long term monitoring of rivers. Recently multivariate statistical analysis techniques such as Principal Component Analysis (PCA) have been successfully employed in a number of water quality analyses. All these studies showed that PCA can interpret large scale complex data with correlating the different water quality parameters. PCA is successfully applied in quasi-harmonic analysis in protein research, molecular dynamics, prediction of suitable corrosion inhibitors, and for understanding the metabolomic data obtained from NMR and others.1-9
In this study, the water quality parameter database of river Kaveri observed at 5 different stations were subjected to principal components analysis with a view to extract information about the similarities and dissimilarities among the sample collected at different stations. In addition, the water quality parameters that influence more on the samples were also evaluated.
Experimental
The river Kaveri is one of the major resources of potable water in Tamil Nadu, India. This river is polluted by various types of anthropogenic activities. Therefore, it is important to monitor and analyse the water quality at different points through which a river passes through. In this study, nine water quality parameters, pH, dissolved oxygen (DO), biological oxygen demand (BOD), chloride, sulphate, nitrate, total hardness, fecal coli, and total coli were observed at 5 different stations. The water quality parameters were determined based on the raw data that was observed by Government of Tamil Nadu in the district of Tiruchirappalli alongside the Kaveri during 2004-2011.10 However, the raw data for 2007-2008 is missing. Further some data are incomplete for few years which may be due to technical failure in the measurement. In such cases, the values corresponding to previous years were taken into account in order to avoid difficulty in evaluating the principal component. Principal component analysis (PCA) was performed using Scilab software. A dedicated program was prepared to feed the data and outputs were obtained as figures.
Results and Discussion
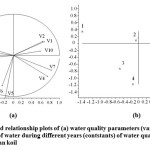
Generally, the quality of water is classified between A to E. For the purpose of computation, the authors replaced these alphabets with numbers 1 to 5. The water quality parameters observed at five different stations and their ranking are given in Tables 1-5. It should be noted that the water quality parameters along with the ranking are considered as variables (V1 to V10) and the years as constants. Using these parameters a program is prepared and executed using Scilab software. The output figures are shown in Figures 1-5.
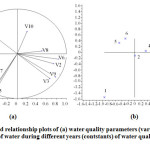
Figure 1a shows that the angles between V1 and V4, V2 and V5, V3 and V5/V6, V4 and V6, V5/V6/V7 and V9/V7 were about 90o. This is attributed to the non-linear relationship between the variables. The variables that are close to each other can be grouped as (V1, V2, V10), (V3, V9), (V5, V6), (V4, V7). According to PCA, these groups of variables have direct relationship between them. For instance, BOD (V3) and total coli count (V9) are found to have linear relationship. In practice, BOD is a direct measure for growth of any microbes. Further, the angles between V9 and V4/V7 and V8 and V10 are close to 180o, which is attributed to linear relationship between them. Apparently, the concentration of chloride (V4) in the water could affect the growth of microbes (V9).
Table 1: Water quality parameters observed at pathrakaliamman koil
|
Year |
pH |
D.O mg/L |
B.O.D mg/L |
Chloride mg/L |
Sulphate mg/L |
Nitrate mg/L |
Total hardness mg/L |
Fecal coli /100 mL |
Total coli /100 mL |
DBU Rank |
|
2004-2005 |
7.35 |
7.6 |
2 |
6 |
2 |
0.2 |
22 |
327 |
1668 |
1 |
|
2005-2006 |
7.85 |
7.9 |
2.1 |
12 |
5 |
0.19 |
56 |
213 |
595 |
2 |
|
2006-2007 |
7.14 |
7.4 |
1.9 |
18 |
7 |
0.35 |
44 |
193 |
476 |
2 |
|
2008-2009 |
7.29 |
7.84 |
0.81 |
26 |
15 |
0.274 |
62 |
275 |
448 |
1 |
|
2009-2010 |
7.81 |
8.4 |
0.6 |
26 |
0.01 |
0.1 |
62 |
131 |
304 |
2 |
|
2010-2011 |
8.1 |
7.79 |
1 |
26 |
4 |
0.28 |
77 |
95 |
204 |
2 |
Table 2: Water quality parameters observed at Tiruchirappalli upper-stream
|
Year |
pH |
D.O mg/L |
B.O.D mg/L |
Chloride mg/L |
Sulphate mg/L |
Nitrate mg/L |
Total hardness mg/L |
Fecal coli /100 mL |
Total coli /100 mL |
DBU Rank |
|
2004-2005 |
8.2 |
7.7 |
2 |
0 |
0 |
0.07 |
0 |
290 |
950 |
1 |
|
2005-2006 |
8.1 |
8.4 |
1.9 |
0 |
0 |
0.18 |
0 |
173 |
633 |
1 |
|
2006-2007 |
8.0 |
7.6 |
1.9 |
0 |
0 |
0.17 |
0 |
153 |
295 |
2 |
|
2008-2009 |
7.94 |
7.63 |
0.8 |
135 |
55 |
0.17 |
160 |
170 |
285 |
2 |
|
2009-2010 |
8.37 |
7.5 |
1 |
0.11 |
0 |
0.17 |
160 |
143 |
330 |
2 |
|
2010-2011 |
8.16 |
7.4 |
1 |
19 |
0 |
0.1 |
60 |
131 |
268 |
2 |
 |
|
 |
|
Figure 1b exhibits the water quality observed for Kaveri at different years. The quality of water observed in the years 2006-2007 and 2008-2009, 2009-2010 and 2010-2011 are closer to each other. The results observed in 2004-2005 are different and specific. It is apparent that these relationships are directly proportional to the quality of the water. The data present in the Table 1 and the Figure 1b correlate with each other.
Table 3: Water quality parameters observed at grand anicut
|
Year |
pH |
D.O mg/L |
B.O.D mg/L |
Chloride mg/L |
Sulphate mg/L |
Nitrate mg/L |
Total hardness mg/L |
Fecal coli / 100 mL |
Total coli / 100 mL |
DBU Rank |
|
2004-2005 |
8.1 |
7.5 |
2.7 |
0 |
0 |
0.3 |
0 |
193 |
675 |
1 |
|
2005-2006 |
8.1 |
7.5 |
4.1 |
0 |
0 |
0.27 |
0 |
203 |
461 |
1 |
|
2006-2007 |
7.8 |
7.0 |
2.8 |
10 |
46 |
0.19 |
224 |
156 |
363 |
2 |
|
2008-2009 |
7.8 |
6.2 |
2.9 |
215 |
67 |
0.47 |
330 |
205 |
366 |
1 |
|
2009-2010 |
8.2 |
7.9 |
2.2 |
215 |
0.37 |
0.19 |
330 |
235 |
471 |
1 |
|
2010-2011 |
8.0 |
6.26 |
1 |
56 |
0.37 |
0.23 |
185 |
176 |
328 |
2 |
Table 4: Water quality parameters observed at Tiruchirappalli down-stream.
|
Year |
pH |
D.O mg/L |
B.O.D mg/L |
Chloride mg/L |
Sulphate mg/L |
Nitrate mg/L |
Total hardness mg/L |
Fecal coli / 100 mL |
Total coli / 100 mL |
DBU rank |
|
2004-2005 |
7.7 |
6.2 |
4 |
0 |
0 |
0.13 |
3640 |
290 |
760 |
1 |
|
2005-2006 |
8.2 |
8.4 |
2 |
0 |
0 |
0.17 |
0 |
215 |
650 |
1 |
|
2006-2007 |
7.7 |
7.4 |
2 |
0 |
0 |
0.415 |
0 |
238 |
405 |
2 |
|
2008-2009 |
7.9 |
7.83 |
1.3 |
175 |
59 |
0.15 |
240 |
320 |
500 |
1 |
|
2009-2010 |
8.1 |
6 |
4.5 |
175 |
0.004 |
0.1 |
240 |
640 |
2568 |
1 |
|
2010-2011 |
8.0 |
6.15 |
1 |
83 |
1 |
0.17 |
202 |
188 |
368 |
2 |
Table 5: Water quality parameters observed at kollidam.
|
Year |
pH |
D.O mg/L |
B.O.D mg/L |
Chloride mg/L |
Sulphate mg/L |
Nitrate mg/L |
Total hardness mg/L |
Fecal coli / 100 mL |
Total coli/ 100ml |
DBU Rank |
|
2004-2005 |
8.0 |
7.4 |
2 |
14246 |
1518 |
0.08 |
4040 |
116 |
827 |
1 |
|
2005-2006 |
8.1 |
8.1 |
2 |
475 |
81 |
0.08 |
296 |
266 |
680 |
1 |
|
2006-2007 |
7.8 |
8.3 |
4 |
112 |
44 |
0.486 |
188 |
260 |
2701 |
2 |
|
2008-2009 |
7.9 |
7.6 |
1.16 |
135 |
48 |
0.25 |
220 |
471 |
753 |
2 |
|
2009-2010 |
8.2 |
7.2 |
1.3 |
135 |
0.07 |
0.14 |
220 |
119 |
286 |
2 |
|
2010-2011 |
8.1 |
7.4 |
1 |
91 |
0.07 |
0.21 |
234 |
144 |
298 |
3 |
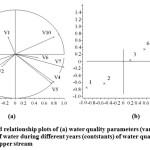
In the case of the samples collected at upper stream Kaveri in Tiruchirappalli, the data were unique and different. For instance, V1 is different from any other parameters, which suggests that it has less influence over the quality of the water in the particular year (Figure 2a). Meanwhile, it is interesting to note that except V1 and V10 all other variables can be grouped into two. On one hand, V2, V3, V8, and V9 are close to each other. On the other hand V4, V5, V6, and V7 are close to each other. As discussed above, the closeness of the variables suggest for direct or linear relationship between these parameters in determining the quality of water. It is interesting to note that the quality of water during 2008-2009 was vastly different than other years. It is mainly due to the high levels of chloride, sulphate, and total hardness.
 |
|
 |
|
 |
|
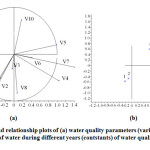
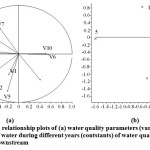
Similar to the samples collected at patharakaliamman koil and Tiruchirappalli upper stream, the data of other samples collected at grand anicut, Tiruchirappalli downstream, and Kollidam also be discussed. It is interesting to note that in almost all of the samples collected at different stations, the variables V3 and V9 are in same quarter with more or less similar values. This strongly suggests the linear relationship between BOD (V3) and fecal coli (V9). It should be noted that in all the samples, the data collected in the year 2004-2005 and 2010-2011 are in opposite trend. This is due to the increase of the parameters such as chloride, sulphate, nitrate and fecal coli which subsequently led to the decrease of the water quality.
Conclusion
PCA is a very useful technique for reducing the dimensionality of the data for subsequent determination of principal component. In the present study, water samples of Kaveri collected at 5 different stations were subjected to PCA in order to understand and compare the quality parameters. It is suggested by the data that the samples collected in 2010-2011 are more polluted than the samples of the previous years in all the sample stations. Further the relationship between BOD and fecal coli played major role in the quality of the water. Similar to this study, several variables and constants can be considered and taken into account for creation of database which will be very useful the researchers for better understanding of the water quality.
Acknowledgement
The authors are thankful to College of Fisheries Engineering, Tamil Nadu Fisheries University for motivation towards research.
References
- Jolliffe, I.T. Principal Component Analysis, 2nd Edition, Springer Verlag, New York (1986).
CrossRef - Vaidyanathan, S., Dunn, W. B., Harrigan, G. G., Kell, D. B. Metabolomics by numbers: acquiring and understanding global metabolite data. Trends in Biotechnology, 22:245–252 (2004).
CrossRef - Nicholson, J. K., Lindon, J. C., Holmes, E. “Metabonomics”: understanding the metabolic responses of living systems to pathophysiological stimuli via multivariate statistical analysis of biological NMR spectroscopic data. Xenobiotica, 29:1181–1189 (1999).
CrossRef - Stoyanova, R., Brown, T. R. NMR spectral quantitation by principal component analysis. NMR in Biomedicine,14:271–277 (2001).
CrossRef - Lindon, J. C. Holmes, E., Nicholson, J. K. Pattern recognition methods and applications in biomedical magnetic resonance, Progress in Nuclear Magnetic Resonance Spectroscopy, 39:1–40 (2001).
CrossRef - Femila Mercy Rani, J., Ramya, D. Determination of principal component for selection of corrosion inhibition using principal component analysis. Chemical Science Review and Letters, 2:526-530 (2014).
- Salman, S., Abolfazl, S., Bahram, S., Sayed, M. B. Modeling spatial pattern of salinity using MIKE21 and principal component analysis technique in Urmia lake, Current World Environment, 10:626-633 (2015).
CrossRef - Sanaa, O. Cluster and Factor Analysis of Groundwater in Mafraq Area, Jordan. Current World Environment, 10:422-431 (2015).
CrossRef - Majid, D., Bahram, S., Firoozeh, R., Ahmad, K. Uncertainty analysis of monthly stream flow forecasting. Current World Environment, 9:894-902 (2014).
CrossRef - Pollution database for Tamil Nadu, April 2014.


