Hypsometric Analysis Using Geographical Information System of Gour River Watershed, Jabalpur, Madhya Pradesh, India
Shailesh Kumar Sharma 1 , Sarita Gajbhiye Meshram 2,3 * , Rupesh Jairam Patil 4 and Sanjay Tignath 5
1
Department of Soil and Water Engineering,
JNKVV,
College of Agricultural Engineering JNKVV,
Jabalpur,
M.P.
India
2
Department of Water Resources Development and Management,
Indian Institute of Technology,
Roorkee,
247667
Uttarakhand
India
3
K. Banerjee Centre of Atmospheric and Ocean Studies,
University of Allahabad,
Allahabad,
Uttar Pradesh
India
4
Department of Engineering,
Schofield Centre,
University of Cambridge,
United Kingdom
5
Department of Geology,
Government Science College,
Jabalpur,
M.P
India
http://dx.doi.org/10.12944/CWE.11.1.07
Hypsometric analysis of drainage basins reveals the geological stage of watershed and is a measure of its maturity, indicating the susceptibility of the watershed to erosion. In the present study sub watersheds of Khurji Nala and Dala Nala watersheds which are tributaries of GourRiver located in Jabalpur district of Madhya Pradesh was considered as the case study area. The watersheds were delineated into sub watersheds and hypsometric analysis was carried out for all of them using the digital contour map, which was generated using Arc GIS. The hypsometric integral values of Khurji Nala and Dala Nala sub watersheds reveals that sub watershed 2 of Khurji Nala and sub watershed 7 of Dala Nala watershed should be given top priority for soil and water conservation.
Copy the following to cite this article:
Sharma S. K, Meshram S. G, Patil R. J, Tignath S. Hypsometric Analysis Using Geographical Information System of Gour River Watershed, Jabalpur, Madhya Pradesh, India. Curr World Environ 2016;11(1) DOI:http://dx.doi.org/10.12944/CWE.11.1.07
Copy the following to cite this URL:
Sharma S. K, Meshram S. G, Patil R. J, Tignath S. Hypsometric Analysis Using Geographical Information System of Gour River Watershed, Jabalpur, Madhya Pradesh, India. Curr World Environ 2016;11(1). Available from: http://www.cwejournal.org/?p=13972
Download article (pdf) Citation Manager Publish History
Introduction
Watershed is an area from which all precipitated water flows to a common outlet. In other words, watershed is a geographical dynamic unit, which covers all land that contributes runoff to a common outlet.1,2 Continuously growing population pressure resulted in the scarcity of available land and water resources.3 There are number of quantitative analysis used to calculate the topography of the watershed; and the analysis could be prepared from single watershed to the entire country. Comparing the results from different watersheds would be difficult without suitable technique. Hypsometric integral and hypsometric curve are the best method to analyze the topography of drainage basin.4 Hypsometric analysis is the relationship of horizontal cross-section drainage basin area to elevation.5,6,7 Naturally, hypsometric analysis has been used to differentiate between erosional landforms at different stages during their evolution8,9 suggest that hypsometry may reflect the interaction between tectonics and erosion and could provide a valuable geomorphic index in order to constrain the relative importance of these processes. Hypsometry may be expressed quantitatively as an integral called the hypsometric integral (HI). HI represents the area under the hypsometric curve.8 Interpreted shapes of hypsometric curves by analyzing numerous drainage basins and classified the basins as youth (convex upward curves), mature (S-shaped curves, which are concave upwards at high elevations and convex downwards at low elevations) and peneplain or distorted (concave upward curves). The hypsometric integral helps in explaining the erosion that had taken place in the watershed during the health of watersheds.10 Hypsometric Integral value can be used as an estimator of erosion status of watershed leading to prioritization of watershed for soil and water conservation measures.11 The recent advances in remote sensing technology and geographical information systems (GIS) have became important means to provide accurate, timely, and real-time information on various aspects of the watershed.12,13,14,15,16,17,18,19,20,21,22,23,24,25,26,27,28 There is a lack of hypsometric analysis based studies for small river basin like Gour river to analyze the watershed health, which is due to the tedious nature of data acquisition and analysis involved for estimation. However, due to advent of remote sensing data (including derived digital elevation models) and open source GIS tools, the estimation process becomes easier than conventional methods. Considering the above facts, this study was undertaken in two watersheds of Gourriver to prioritize their sub watersheds for soil and water conservation.
Materials and Methods
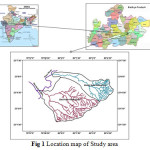
In the present study two watersheds were taken naming Khurji Nala and Dala Nala watersheds which are tributaries of Gour River situated in Jabalpur district of Madhya Pradesh. The study area contributes 62.7 km2 of total area and situated between 79°58’6.72" and 80°4’59.10" E longitude and 23°1’46.15" and 23°6’25.03" N latitude with elevation range from 400 m to 560 m above MSL (mean sea level). The location map of study area is shown in Fig 1. The average annual rainfall is 1150 mm, which is concentrated mostly between mid June to mid September with scattered winter rains during late December and January months.
 |
|
In order to prepare base map of Khurji Nala and Dala Nala watersheds SOI (Survey of India) topo sheets 55 M/16 and 64 A/4 on 1:50000 scales were used. Digitization of contours and drainage network was carried out using ArcGIS, followed by generation of a Digital Elevation Model (DEM). Further, the two watersheds i.e. KhurjiNala and DalaNala delineated into five and seven sub watersheds respectively. The digital contour map was used to generate the data required for relative area and elevation ranges. Taking the drainage basin to be bounded by vertical sides and a horizontal base plane passing through the mouth, the Relative height ‘y’ is the ratio of height of the contour above the base level of the stream mouth i.e. ‘h’ to the total height of basin with reference to the same base level i.e. ‘H’. Relative area ‘x’ is the ratio of ‘a’ which is the area enclosed between a given contour within the basin to the ‘A’ which is the total area of the basin. Values of Relative height and Relative area of two watersheds is presented in Table 1A,1B,1C,1D,1E of Khurji Nala sub watersheds, and Table 2A, 2B, 2C, 2D, 2E, 2F, 2G of DalaNala sub watersheds.
Values of Relative Height and Area Calculated
Table 1a: Sub watershed 1(Khurji Nala)
|
Contour |
Area (a) km2 |
Relative area (a/A) |
Contour height (h)m |
Relative relief(h/H) |
|
560 |
0.085 |
0.078 |
142 |
0.95 |
|
540 |
0.039 |
0.114 |
122 |
0.82 |
|
520 |
0.022 |
0.135 |
102 |
0.68 |
|
500 |
0.023 |
0.156 |
82 |
0.55 |
|
480 |
0.022 |
0.177 |
62 |
0.41 |
|
460 |
0.019 |
0.195 |
42 |
0.28 |
|
440 |
0.163 |
0.346 |
22 |
0.14 |
|
420 |
0.708 |
0.99 |
2 |
0.013 |
Table 1b: Sub watershed 2 (Khurji Nala)
|
Contour |
Area (a) km2 |
Relative area (a/A) |
Contour height (h)m |
Relative relief(h/H) |
|
440 |
0.163 |
0.083 |
45 |
0.818 |
|
420 |
1.78 |
0.96 |
25 |
0.454 |
|
400 |
0.0026 |
0.99 |
5 |
0.09 |
Table 1c: Sub watershed 3 (Khurji Nala)
|
Contour |
Area (a) km2 |
Relative area (a/A) |
Contour height (h)m |
Relative relief(h/H) |
|
560 |
0.03 |
0.0114 |
146 |
0.966 |
|
540 |
0.14 |
0.057 |
126 |
0.834 |
|
520 |
0.18 |
0.113 |
106 |
0.701 |
|
500 |
0.13 |
0.155 |
86 |
0.569 |
|
480 |
0.132 |
0.196 |
66 |
0.437 |
|
460 |
0.22 |
0.265 |
46 |
0.304 |
|
440 |
1.27 |
0.658 |
26 |
0.172 |
|
420 |
1.11 |
0.99 |
6 |
0.03 |
Table 1d: Sub watershed 4 (Khurji Nala)
|
Contour |
Area (a) km2 |
Relative area (a/A) |
Contour height (h)m |
Relative relief(h/H) |
|
560 |
0.41 |
0.21 |
148 |
0.93 |
|
540 |
0.04 |
0.23 |
128 |
0.81 |
|
520 |
0.043 |
0.26 |
108 |
0.68 |
|
500 |
0.048 |
0.28 |
88 |
0.55 |
|
480 |
0.049 |
0.3 |
68 |
0.43 |
|
460 |
0.044 |
0.33 |
48 |
0.30 |
|
440 |
0.25 |
0.47 |
28 |
0.17 |
|
420 |
0.99 |
099 |
8 |
0.05 |
Table 1e: Sub watershed 5 (Khurji Nala)
|
Contour |
Area (a) km2 |
Relative area (a/A) |
Contour height (h)m |
Relative relief(h/H) |
|
560 |
0.033 |
0.002 |
164 |
0.97 |
|
540 |
0.012 |
0.003 |
144 |
0.85 |
|
520 |
0.013 |
0.005 |
124 |
0.733 |
|
500 |
0.016 |
0.006 |
104 |
0.615 |
|
480 |
0.012 |
0.007 |
84 |
0.497 |
|
460 |
0.014 |
0.008 |
64 |
0.378 |
|
440 |
0.171 |
0.02 |
44 |
0.26 |
|
420 |
3.345 |
0.30 |
24 |
0.142 |
|
400 |
8.22 |
0.99 |
4 |
0.023 |
Table 2a: Sub watershed 1 (Dala Nala)
|
Contour |
Area (a) km2 |
Relative area (a/A) |
Contour height (h)m |
Relative relief(h/H) |
|
560 |
0.0276 |
0.0071 |
164 |
0.970 |
|
540 |
0.096 |
0.032 |
144 |
0.852 |
|
520 |
0.1874 |
0.080 |
124 |
0.733 |
|
500 |
0.0923 |
0.104 |
104 |
0.615 |
|
480 |
0.1277 |
0.137 |
84 |
0.497 |
|
460 |
0.1872 |
0.186 |
68 |
0.378 |
|
440 |
0.7409 |
0.378 |
44 |
0.260 |
|
420 |
2.2059 |
0.951 |
24 |
0.142 |
|
400 |
0.1861 |
0.99 |
4 |
0.02 |
Table 2b: Sub watershed 2 (Dala Nala)
|
Contour |
Area (a) km2 |
Relative area (a/A) |
Contour height (h)m |
Relative relief(h/H) |
|
460 |
0.013 |
0.009 |
64 |
0.842 |
|
440 |
0.083 |
0.066 |
44 |
0.578 |
|
420 |
0.784 |
0.6015 |
24 |
0.315 |
|
400 |
0.584 |
0.99 |
4 |
0.052 |
Table 2c: Sub watershed 3 (Dala Nala)
|
Contour |
Area (a) km2 |
Relative area (a/A) |
Contour height (h)m |
Relative relief(h/H) |
|
560 |
0.08 |
0.010 |
162 |
0.975 |
|
540 |
0.134 |
0.026 |
142 |
0.855 |
|
520 |
0.379 |
0.077 |
122 |
0.734 |
|
500 |
0.218 |
0.101 |
102 |
0.614 |
|
480 |
0.266 |
0.134 |
82 |
0.493 |
|
460 |
0.2523 |
0.165 |
62 |
0.373 |
|
440 |
0.605 |
0.241 |
42 |
0.253 |
|
420 |
1.710 |
0.453 |
22 |
0.135 |
|
400 |
4.388 |
0.99 |
2 |
0.012 |
Table 2d: Sub watershed 4 (Dala Nala)
|
Contour |
Area (a) km2 |
Relative area (a/A) |
Contour height (h)m |
Relative relief(h/H) |
|
440 |
0.019 |
0.004 |
43 |
0.934 |
|
420 |
0.164 |
0.042 |
23 |
0.5 |
|
400 |
4.119 |
0.99 |
3 |
0.065 |
Table 2e: Sub watershed 5 (Dala Nala)
|
Contour |
Area (a) km2 |
Relative area (a/A) |
Contour height (h)m |
Relative relief(h/H) |
|
560 |
0.0154 |
0.0045 |
166 |
0.976 |
|
540 |
0.0194 |
0.0102 |
146 |
0.858 |
|
520 |
0.0156 |
0.0148 |
126 |
0.741 |
|
500 |
0.0299 |
0.0236 |
106 |
0.623 |
|
480 |
0.0789 |
0.0470 |
86 |
0.505 |
|
460 |
0.1529 |
0.0922 |
66 |
0.388 |
|
440 |
0.1799 |
0.145 |
46 |
0.270 |
|
420 |
0.650 |
0.3377 |
26 |
0.152 |
|
400 |
2.2385 |
0.99 |
6 |
0.035 |
Table 2f: Sub watershed 6 (Dala Nala)
|
Contour |
Area (a) km2 |
Relative area (a/A) |
Contour height (h)m |
Relative relief(h/H) |
|
480 |
0.0047 |
0.002 |
85 |
0.894 |
|
460 |
0.077 |
0.045 |
65 |
0.684 |
|
440 |
0.057 |
0.077 |
45 |
0.473 |
|
420 |
0.192 |
0.185 |
25 |
0.263 |
|
400 |
1.457 |
0.99 |
5 |
0.052 |
Table 2g: Sub watershed 7(Dala Nala)
|
Contour |
Area (a) km2 |
Relative area (a/A) |
Contour height (h)m |
Relative relief(h/H) |
|
420 |
0.26 |
0.013 |
24 |
0.827 |
|
400 |
19.62 |
0.99 |
4 |
0.137 |
Estimation of Hypsometric Integrals (Hi)
The hypsometric integral (HI) was estimated using the elevation relief ratio method as proposed by.29 The relationship is expressed as:
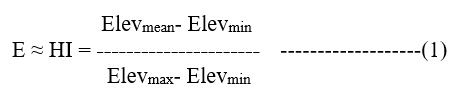
Where, E is the elevation-relief ratio equivalent to the hypsometric integral HI;Elevmean is the weighted mean elevation of the watershed estimated from the identifiable contours of the delineated watershed; Elevmax and Elevmin are the maximum and minimum elevations within the watershed. The hypsometric integral is expressed in percentage units.
Prioritization of Watershed
The watershed prioritization is the ranking of different areas of a watershed according to the order in which they have to be selected for adopting suitable soil conservation measures. The watershed prioritization and formulation of proper watershed management programs for sustainable development require information on watershed sediment yield. Due to the complexity of the variables involved in erosion it becomes difficult to measure or predict the erosion in a precise manner. The latest advances in remote sensing technology and Geographical Information System (GIS) have provided very useful methods of surveying, identifying, classifying and monitoring several forms of earth resources. A particular sub watershed may get top priority due to various reasons but often; the intensity of land degradation is taken as the basis of prioritization.
In case of unguaged or inadequately gauged situations it becomes problematic to prioritize the watersheds. Therefore hypsometric analysis is used for prioritization of those watersheds.
On the basis of hypsometric integral (HI), the threshold limits recommended by Miller (1953) as given below were adopted for deciding the stage of watershed:
- The watershed is at youthful stage, if the HI ≥ 0.6.
- The watershed is at equilibrium stage, if the 0.35 ≤ HI< 0.6.
- The watershed is at mature (old) stage, if the HI< 0.35.
The watershed in youthful stage is more prone to erosion in comparison to equilibrium or mature stage. So the watersheds were prioritized on the basis of values of HI.
Result and Discussions
Hypsometric Integral
Hypsometric integrals (HI) values obtained by Pike and Wilson method for sub watersheds of both KhurjiNala and Dala Nala watershed are presented in Table 3. HI values of Khurji Nala sub watersheds ranges between 0.2 and 0.5 where as, for DalaNala sub watersheds it ranges between 0.12 and 0.55.
Table 3: Hypsometric Integral values of sub watersheds of KhurjiNala and Dala Nala watersheds
|
Sub Watershed |
Hypsometric integral |
Geological stages |
|
A. Khurjinala sub watersheds |
||
|
1 |
0.21 |
Mature |
|
2 |
0.5 |
Equilibrium |
|
3 |
0.3 |
Mature |
|
4 |
0.31 |
Mature |
|
5 |
0.2 |
Mature (old) |
|
B. Dalanala sub watersheds |
||
|
1 |
0.36 |
Equilibrium |
|
2 |
0.48 |
Equilibrium |
|
3 |
0.28 |
Mature |
|
4 |
0.12 |
Mature (old) |
|
5 |
0.24 |
Mature |
|
6 |
0.33 |
Late mature |
|
7 |
0.55 |
Late youthful or equilibrium |
Prioritization of sub watershed on the basis of hypsometric integral
Surface runoff and sediment losses are two important hydrological responses of the rainfall events occurring over the watershed systems. The hypsometric integral value can be an indirect estimator of the erosion from the watershed systems.11 It is observed from the HI values (Table 3) that the sub-watersheds of both the watersheds are in the late youthful or equilibrium stage &mature stage and moving towards the peneplanation or the deteriorating stage. This revealed that the soil erosion from the sub-watersheds are derived primarily from the incision of channel beds, down slope movement of top soil and bed rock material, washout of soil mass and cutting of stream banks. Such land forms are also reflected in the different sub-watersheds of the study area. Topographic evidence of the study region indicates the landscape concavity due to river incision. While comparing hypsometric integral values of different stages, the sub watershed 2 of Khujuri Nala and sub watershed 1, 2 and 7 of Dala Nala watersheds were observed to be in equilibrium or late youthful stage.In equilibrium stage, the watershed is still under development. Higher value of HIshows that the watershed is tectonically active and more prone to erosion. The sub watershed 1, 3, 4 and 5 of KhajuriNala and 3, 4, 5 and 6 of Dala Nala were observed to be in mature or old stage. The mature or old stage occurs particularly, when isolated bodies of resistant rock from prominent hills are found above the subdued surface and is indicated by the disported hypsometric curve. Lower values of HIshow that the watershed is tectonically not active and less prone to erosion. It is understood that the hydrological response of the watersheds attaining mature stages will have slow rate of erosion.31 So, the values of hypsometric integral of a sub watershed help in the prioritization of basin. For prioritization of sub watersheds, in KhurjiNala watershed sub watershed 2 has given top priority as it has hypsometric integral value 0.5 and sub watershed 4 has given second priority as it has hypsometric integral value 0.31 and subsequently the other sub watersheds in both the watersheds are prioritized. In Dala Nala watershed sub watershed 7 given first priority and sub watershed 2 given second priority and so on. Table 4 presents the prioritization of sub watersheds of Khurji Nala and Dala Nala watersheds.
Table 4: Prioritization of sub watersheds of Khurji Nala and Dala Nala watershed
|
Watershed |
Hypsometric integral |
Priority |
|
A. Khurji Nala sub watersheds |
||
|
1 |
0.21 |
4 |
|
2 |
0.5 |
1 |
|
3 |
0.3 |
3 |
|
4 |
0.31 |
2 |
|
5 |
0.2 |
5 |
|
B. Dala Nala sub watersheds |
||
|
1 |
0.36 |
3 |
|
2 |
0.48 |
2 |
|
3 |
0.28 |
5 |
|
4 |
0.12 |
7 |
|
5 |
0.24 |
6 |
|
6 |
0.33 |
4 |
|
7 |
0.55 |
1 |
Conclusion
Hypsometric analysis of watershed expresses the complexity of denudational processes and the rate of morphological changes. Therefore, it is useful to comprehend the erosion status of watersheds and prioritize them for undertaking soil and water conservation measures. The results of hypsometric analysis revealed that the sub watershed 2 of KhajuriNala and sub watershed 7 of Dala Nala are more prone to erosion in comparison to other sub watersheds under study which would necessitate construction of soil and water conservation structures at appropriate locations of these watersheds at top priority to arrest sediment outflow and conserve water.
References
- Sharma, S.K. Mishra, N., Gupta, A., Morphometric analysis of UttalaNala watershed using GIS technique. Sci-fronts,(1):178-185, (2007a).
- Sharma, S.K., Gajbhiye, S., Tignath, S., Application of Principal Component Analysis in Grouping Geomorphic Parameters of a Watershed for Hydrological Modelling. Applied Water Science,5(1), 89-96,(2015a).
CrossRef - Sharma, S.K., Kujur, S., Suriya, S., GIS based morphometric analysis of Sarphanala watershed. The Geographical Observer, 37:50-54, (2007b).
- Ramu, Mahalingam, B., Hypsometric properties of drainage basin in Karnatka using geographical information system. New York Sc Jour, 5(12):156-158, (2012).
- Sharma, S.K., Tignath, S., Chaube, U.C., Hypsometric analysis of Kanhiyanala watershed using Geographical Information System. JNKVV Res Jour, 44(1):97-100, (2010).
- Sharma, S.K., Seth, N.K., Tignath, S., Pandey, R.P., Use of Geographical Information System in hypsometric analysis of watershed. Jour Indian Water Res Soc, 31(3-4): 28-32, (2011a).
- Sharma, S.K., Tignath, S., Gajbhiye, S., Patil, R.J., Use of Geographical Information System in Hypsometric analysis of KanhiyaNala Watershed. International Journal of Remote Sensing and Geosciences, 2(3):30-35, (2013).
- Strahler, Hypsometric (area-altitude) analysis of erosional topography. Geological Soc of Amer Bull, 63:1117-1142, (1952).
CrossRef - Weissel, J.K., Pratson, L.F., Malinverno, A., The length-scaling properties of topography. Jour of Geophys Res 99 13997–14012, (1994).
CrossRef - Sivakumar, V., Biju, C., Deshmukh, B., Hypsometric Analysis of Varattaru River Basin of Harur Taluk Dharmapuri Districts Tamilnadu India using Geomatics Technology. Int J Geoma andGeosc, 2 (1):241-247, (2011),.
- Singh, O., Sarangi, A., Sharma, M.C., Hypsometric integral estimation methods and its relevance on erosion status of north western Lesser Himalayan watershed. Water Res Mgt, 22:1545-1560, (2008a).
CrossRef - Sharma, S.K., Tignath, S., Mishra, S.K., Morphometric analysis of drainage basin using GIS approach. JNKVV Res Jour, 42(1):91-95, (2008).
- Sharma, S.K., Seth, N.K., Tignath, S., Shukla, J.P., Land use/Land cover mapping of Gusuru river using Remote Sensing & GIS technique. JNKVV Res Jour, 45(1):125-128, (2011b).
- Sharma, S.K., Pathak, R., Suraiya, S., Prioritization of sub-watersheds based on morphometric analysis using remote sensing and GIS technique. JNKVV Res Jour, 46(3):407-413, (2012).
- Gajbhiye, S., Sharma, S.K., Land Use And Land Cover Change Detection Through Remote Sensing Using Multi-Temporal Satellite Data. International Journal of Geomatics and Geosciences, 3(1), 89-96, (2012).
CrossRef - Gajbhiye, S., Mishra, S.K., Application of NRSC-SCS Curve Number Model in RunoffEstimation Using RS & GIS. IEEE-International Conference on Advances in Engineering Science and Management (ICAESM -2012)Nagapattinam, Tamil Nadu, March 30-31, pp 346-352, ISBN: 978-81-909042-2-3, (2012).
CrossRef - Gajbhiye, S.,Sharma, S.K., Prioritization of Watershed through Morphometric Parameters: A PCA Based Approach. Applied Water Science, pp 1-15, DOI: 10.1007/s13201-015-0332-9, (2015b).
CrossRef - Gajbhiye, S., Mishra, S.K., Pandey, A., Simplified sediment yield index model incorporating parameter CN. Arabian Journal of Geosciences, 8 (4), 1993-2004, (2015b).
- Gajbhiye, S., Sharma, S.K., Tignath, S., Mishra, S.K., Development of a Geomorphological Erosion Index for Shakkar Watershed. Geological Society of India, 86 (3), 361-370, (2015e).
- Gajbhiye, S., Morphometric analysis of a Shakkar River Catchment Using RS and GIS. International Journal of U-and E-Service, Science and Technology 8 (2), 11-24, (2015a).
- Gajbhiye, S., Estimation of Surface Runoff Using Remote Sensing and Geographical Information System. International Journal of U-and E-Service, Science and Technology, 8 (4), 118-122, (2015b).
- Meshram,S.G.,Sharma, S.K., Tignath, S.,Application of remote sensing and geographical information system for generation of runoff curve number. Applied Water Science, pp 1-7, DOI 10.1007/s13201-015-0350-7, (2015f).
CrossRef - Gajbhiye, “Estimation of Rainfall generated runoff using RS and GIS” LAMBERT Academic Publishing,Germany, ISBN 978-3-659-61084-4, (2014).
CrossRef - Gajbhiye, S., Mishra, S.K., Pandey, A., Prioritizing erosion-prone area through morphometric analysis: an RS and GIS perspective. Applied Water Science, 4(1), 51-61, (2014b).
CrossRef - Gajbhiye, S., Mishra, S.K., Pandey, A., Hypsometric Analysis of Shakkar River Catchment through Geographical Information System. Journal of the Geological Society of India, 84 (2), 192-196, (2014c).
- Gajbhiye, S., Sharma, S.K., Meshram, C.,Prioritization of Watershed through Sediment Yield Index Using RS and GIS Approach. International Journal of u-and e-Service, Science and Technology, 7 (6), 47-60, (2014e).
- Gajbhiye, S., Mishra, S.K., Pandey, A., Prioritization of Shakkar River catchmentthrough Morphometric Analysis using Remote Sensing and GIS techniques. Journal of emerging technology in mechanical science and engineering. 4(2), 129-142, (2013a).
- Gajbhiye, S., Mishra, S.K., Pandey, A., Effect of seasonal/monthly variation on runoff Curve Number for selected watersheds of Narmada Basin. International Journal of Environmental Sciences, 3(6), 2019-2030, (2013c).
- Pike, R.J., Wilson, S.E., Elevation- relief ratio hypsometric integral and geomorphic area-altitude analysis. Geological Soc Am Bull, 82: 1079-1084, (1971).
CrossRef - Miller, V.C., A quantitative geomorphic study of drainage basin characteristics in the Clinich Mountain Area, Virginia, and Tennessee: Office of Navel Research 389-042 Technical Report no. 330 pp, (1953).
- Ritter, D.F., Kochel, R.C., Miller, J.R., Process Geomorphology. McGraw Hill, Boston, (2002).


