Road Transport System in Southeast Asia; Problems and Economic Solutions
Sara Kaffashi1 * , Mad Nasir Shamsudin1 , Maynard S. Clark2 , Shaufique Fahmi Sidique3 and Alias Radam4
1
Institute ofAgricultural and Food Policy Studies,
Universiti Putra Malaysia,
43400
UPM Serdang Selangor
Malaysia
2
Faculty of Economics and Management,
Universiti Putra Malaysia
http://dx.doi.org/10.12944/CWE.11.1.02
Copy the following to cite this article:
Kaffashi S, Shamsudin M. N, Clark M. S, Sidique S. F, Radam A. Road Transport System in Southeast Asia; Problems and Economic Solutions. Curr World Environ 2016;11(1) DOI:http://dx.doi.org/10.12944/CWE.11.1.02
Copy the following to cite this URL:
Kaffashi S, Shamsudin M. N, Clark M. S, Sidique S. F, Radam A. Road Transport System in Southeast Asia; Problems and Economic Solutions. Curr World Environ 2016;11(1). Available from: http://www.cwejournal.org/?p=13543
Download article (pdf) Citation Manager Publish History
Introduction
“Every minute, five children in developing countries die from malaria or diarrhoea. Every hour, 100 children die as a result of exposure to indoor smoke from solid fuels. Every day, nearly 1,800 people in developing cities die as a result of exposure to urban air pollution. Every month, nearly 19,000 people in developing countries die from unintentional poisonings”1 (p: 8).
Rapid urbanization and economic development with increasing demand for travelling has made urban transportation the prominent environmental concern for local, national, and global decision-makers. These issues vary from air pollution, congestion, noise, accidents, and travel time. Evidences show that air pollution from transportation not only targets local environments but, through increasing greenhouse gas emissions, it now has become a global concern. So, sustainable evidence-based transportation polices which fully address the related air pollution both short-range and long-term must be developed.
The relationship between transportation and health is a growing concern in public health. One common policy approach to minimize the negative effect of transportation on public health is promoting active modes of transportation, such as public transport and cycling. Evidences from other studies worldwide show that, air pollution adversely affects people with chronic cardiovascular and respiratory diseases2. Depending on place and amount of exposure to transport related air pollution, the various effects range from increasing risk of developing allergy to non-allergic respiratory diseases, and may even increase risk of death, particularly in cardiopulmonary cases. A WHO2 study showed that exposure concentrations are almost two to three times higher near busy roads compared with untrafficked background areas. However, because air monitoring data was inadequately precise in the epidemiological studies, the health effects of air pollution cannot be attributed to specific pollutants but rather to a mixture of pollutants in outdoor air. The major pollutants from the transport sector which are responsible for adverse health effects are carbon monoxide (CO), lead, various types of particulate matter (PM), ozone (O3), nitrogen dioxide (NO2), and sulphur dioxide (SOx). The WHO report indicated the high risk of exposures for primary exhaust gases and PM inside vehicles3.
Experience in developed countries shows substantial increase in fossil fuel consumption for power generation and transportation. This might be sign of their economic improvement, yet uncontrolled transboundary pollutant could deleteriously affect environmental quality, human health, and happiness. Therefore, with economic growth which brings increasing industrialisation in the developing world, each country should obligate itself to effectively-enforceable evidence-based polices on air pollution control and sustainable transportation. Nevertheless, implementing practical approaches in developing countries need not retard or sacrifice economic growth to minimize adverse health impacts from environmental pollutants. Air pollution control and smartly-designed transportation management implemented in local contexts may contribute significantly to global or overall greenhouse gas emissions reduction. Adopting appropriately responsible local and regional polices to protect atmospheric environments can be defended in terms of better population-level physical well-being and increased standards of living. It’s what the people would want if they had all the information well-organized and succinctly presented to them, and then had the time to make that decision, since their lives would be that much better with higher-level coordination.
According to the UN 2011 Revision, it is expected that about 23 out of 37 megacities (over 10 million population) will be located in Asia by 20254. This indicates a clear trend of accelerated urban concentration with extensive rise in CO2 emissions from the Asian countries. Hence, any policies which can justify better health conditions for citizens through reducing amounts of exposure to transport-related air pollution should be considered. Advance preparation is needed, therefore, for administering sustainable mobility systems that can detect and calculate air pollution, energy consumption, traffic congestion, and related factors4.
This paper aims to review the trend of vehicle ownership and CO2 emission in Southeast Asian countries, to evaluate successful transport polices in different countries, and to introduce methods to estimate the economic benefits of sustainable transport systems.
Trend of Car Ownership, Energy Consumption, and CO2 Emission in Southeast Asia
The South East Asian countries are experiencing different prospects of sustainability in the transportation sector. However, according to the UNESCAPE report5, the countries show different levels of improvements in transportation infrastructure. This report clearly emphasizes the need in each nation for long term commitments to sustainable transport, a basic requirement today for healthy populations and prosperous economies5.
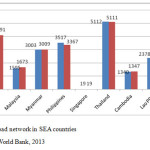
The data from SEA countries show that the highway system was expanded to 24, 071 km in 2010 compared with 23, 594 km in 20036. The roads network in SEA is greatest in Thailand, with 5,111km of total road network in 2010, followed by Indonesia with 4091 km and Philippines with 3,367 km6 (Figure1). Singapore maintained a constant road network mileage of 19km between SEA countries with no road expansions between 2004 and 2010. In terms of road construction, Lao PDR with construction of 479 km of road network and Indonesia with 139 km showed the greatest growth5,6. Analyzing data also showed that total road mileage declined by 150km in the Philippines because of the regional flood in 2011.
|
|
|
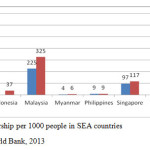
Following road expansion, car ownership also increased to 43 per 1000 persons in SEA. However, it is much lower than in high income countries (434 per 1000 people in Europe or 606 per 1000 people in North America). In 2010, the highest rate of car ownership is observed in countries with better economic conditions, such as Brunei Darussalam with 649.14 cars per 1000 people, Malaysia with 325 cars per 1000 people, and Singapore with 117 cars per 1000 people (Figure 2). Comparing the data with 2003 indicated that between 2003 and 2010 car ownership is increased mostly in Brunei Darussalam with 59% and Malaysia with 23%. This number is 8.68% for Indonesia, 4.69% for Singapore, 0.47% for Myanmar, and 3.05% for Thailand6.
|
|
|
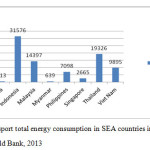
The transport sector’s energy consumption increased by 30226 million tons of oil equivalent in the SEA region from year 2000 to 2010. The road transport sector in SEA consumed about 86,504 million tons of oil equivalent energy in 2010, which is 93% of the total energy consumption in the transportation sector5. This amount is 4.95% of total global energy consumption in the road sector. According to World Bank6 data, Indonesia, Thailand, and Malaysia, followed by Viet Nam, accounted for the most road related energy consumption in SEA in 2010 (Figure 3). Interestingly, in Malaysia 99.79%, in Thailand 99.13%, and in Viet Nam 97.54% of total transportation energy consumption is by the road sector5.
|
|
|
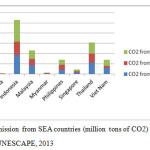
Along with increases in energy consumption, CO2 emissions from the transport sector also show alarmingly increasing rates of use (Figure 4). CO2 emission from SEA countries almost doubled in the two decades between 1990 and 2010. In 2010, CO2 emission from transport sector was 252 million tons, which was a 66 million ton increase since 2000. The road transport sector accounted for 93% of CO2 emission from the transportation sector. The highest amount of CO2 emission was observed from Indonesia, then Thailand, Malaysia, Philippines, and Viet Nam5.
|
` |
|
Sustainable Transport Polices: Successful Stories of Modal Shift
The effect of passengers’ modal shift from private vehicles to sustainable forms of transport – resulting in reducing energy consumption and resulting CO2 emissions– has been observed in numerous countries. Congestion pricing is one of the effective polices in reducing cars and modal shift. The basic principle behind congestion charges is to impose higher prices on vehicles at certain times and places that road is congested7. The main advantage of congestion fees is to reduce the costs of congestion to the society and to the environment through incentivizing reduced travel to congested areas, leading to better traffic flow and therefore less vehicle emission.
Singapore may be the most famous example of implementing successful transportation polices. This country mainly relies on limiting private car ridership and providing high standards and adequate public transit8.This country introduced the “area licensing scheme” (ALS) policy in 1975 in order to restrict cars and control traffic to the central business district (CBD)9. Initiating this policy reduced traffic in CBD by 45% and traffic speed by 25%8 (Poudenx, 2008). However, during this policy’s implementation period, their car ownership rate continued to rise. In response, Singapore’s government introduced a vehicle quota system in 1990 to restrict car ownership through auctioning some certificates each month. In 1995, a road pricing scheme was added to the system. In 1998, after 23 years of operating ALS, it was upgraded to an electronic version (ERP)7,9. The congestion fee in Singapore is variable, from S$0.5 – S$3 daily, and operates on weekdays from Monday to Friday. Adopting pricing polices along with providing adequate public transport system in Singapore has resulted in traffic reduction by 40%, public transport share increment by 20%, traffic speed improvement by 10m/h, and significant reduction in CO2 emission10,11.
In case of London, initiating a congestion fee (of £8 daily) in central London in 2003 reduced the traffic by 20% while travel speed inside the zone increased by 37% and congestion delays were reduced by 30 %12. Consequently, bus ridership was increased by 14% and CO2 emissions were reduced by 20%8. Estimated net income from congestion pricing was estimated in 2007 to be about ₤90 million per year, and that was used mostly for bus service improvements12.
Congestion pricing was initiated in Stockholm, Sweden, in 2006 for all vehicles entering and exiting central Stockholm. The maximum amount of the congestion fee is 60 SEK (US$9.85). The Stockholm experience showed that the congestion charge had a significant effect on traffic volume13. Introducing the congestion charge has reduced the number of cars driving in the inner city by 16%, and consequently the traffic there has decreased by 22.1%13,14. Public transport ridership, after introduction of the congestion fee, has been increased by 8% and retail sales increased by 10%8. Consequently, the emissions from traffic were reduced by 10-15% in the inner city and carbon dioxide was reduced by 2-3% in the whole metropolitan area15. The reduction in premature deaths per year was estimated to be 20-25% in the inner city zone and 25-30% overall in the Stockholm metropolitan area13,15.
Milan’s congestion charge was introduced in 2008 to help air pollution reduction. The charge system, called “Ecopass”, is charged on vehicles entering a restricted zone from 7.30 am to 7.30 pm on weekdays. The amount of tax varies depending on how much emission the vehicle produces and ranges from €2 to €1016,17. The Milan experience showed a decrease of car population in restricted zone by 12.3%, and peak hours congestion was reduced by 25% for the first 11 months of implementation16. The resulted impact on air pollution was significant by 23% reduction in PM10, 14% reduction in CO2 emission, 15% in NOx, and 43% in NH3 emission18,19.
Beside congestion fees, many countries successfully implemented reduction in parking fees on clean vehicles. For example, in Stockholm, Sweden, the parking fee is free for electric cars and other clean vehicles20. In the USA, hybrid electric cars have privileged access to high-occupancy lanes and in some states are exempted from annual smog inspection20. Fuel tax is practiced in many countries such as China, Germany, Netherlands, and Norway. France practices feebate system in car purchases, meaning that efficient vehicles that meet the CO2 emission standards of the European Union receive incentives by the time of purchase while inefficient vehicles are subject to penalty20.
Investments in an adequate public transport system which is comparable with private transport can increase the acceptance of public transit and promote modal shifts. For example in Boulder, Colorado, in the United States, an investment in non-automobile transportation modes reduced the share of single occupancy vehicles by 9.9% between 1990 and 200921. Accordingly, an increase of 8.8% was observed in pedestrian, bicycling, and transit combined mode21.
Economic Methods to Estimate Social Benefits of Modal Shift
The economics of modal shift has its origin in the welfare economics. Any effort in reducing societal and environmental costs of private vehicles ridership is trying to internalize external costs. Because otherwise, the whole society would pay for the external costs imposed by drivers, while the benefits are only gained by individual drivers22. In absence of rules and regulations accounting for external costs, decisions on modal choice would be based on perceived benefits only, and therefore individual drivers have enough incentives to drive more, and this results in even more broadly-distributed costs to the society.
This problem was first addressed in the 1920s by Pigou23. He suggested a system where drivers pay an amount of money which is equal to the monetized costs paid by society. As a result, a Pigouvian tax in the form of a congestion fee or toll has been introduced as an efficient solution to congestion externality (e.g. Singapore and Copenhagen). However, in many cases, it is not clear whether the actual toll prices are high enough to achieve Pareto optimality.
Accordingly, any polices regarding ambient air pollution reduction can use cost benefit analysis (CBA) to relate the cost of pollution control with benefits of having better ambient air24. This ability to identify, quantify, and measure the costs and benefits of alternative decision options makes the method popular with public decision makers25.
Economists use different methods to estimate air pollution reduction health benefits. The most popular methods are including stated preferences methods, revealed preferences methods, and Value of Statistical Life (VSL).
Stated Preference Method to Value Changes in Welfare from Modal Shift
Since, one of the most important challenges related to using CBA analysis is the intangible benefits which have no market price (such as clean ambient air), most of the time costs are overestimated while benefits are underestimated. In this way, economists provided the theoretical foundations for considering those cost and benefits that cannot be translated to monetary terms directly. Stated preference (SP) techniques attempt to elicit the change in individuals’ welfare by directly asking them about their preference about given goods or services. The methods including contingent valuation and choice modeling are based on individuals’ preference under hypothetical situation.
In a CVM survey, respondents can be presented with a single scenario describing hypothetical changes in quality and quantity of a public good (e.g. air quality) and ask respondents to value these changes. The valuation question could be simply open-ended and only ask about maximum WTP for a policy to be implemented, or it could use other formats, such as referendum, or single bounded or double bounded approaches. In all of these formats, the changes in the policy can be measured by asking whether or not respondents are willing to pay (accept) a certain amount. Willingness to pay and willingness to accept (WTA) are measures of change in society’s well being. For example, if respondents are willing to shift, they can be compensated by money they are saving per trip as public transport is cheaper than using a personal car. In contrast, if respondents insist on using their own vehicles, they might ask to pay for the negative externality they cause to the environment and society. As the situation is hypothetical and causes confusion in the respondents, a provision of sufficient information is an important point in obtaining reliable results26.
Choice experiment is another stated preference method which has been widely used in modal shift studies in a global context (See for example the extensive works on modal shift by Professors Jordan Louviere, David Hensher, Chandra R. Bhat, John Rose, Michel Bliemer, William Greene, Moshe Ben-Akiva, and Steven Lerman). In fact, choice experiment originates in the fields of transport and market research, which gained popularity after published papers by Davidson27 and Louviere et al.28 in transportation29,30. These papers drew attention towards a new stated preference method where combination of attributes and levels of transport were presented to the respondents29. Unlike CVM, in the CE survey, respondents are faced with a finite number of different scenarios and are asked to trade off between presented goods and services in each scenario and to select the one that bring them the maximum utility. For example, respondents might be asked to trade off between elements of different mode alternatives to commute to work such as cycling, using a train, or some choice of driving. Each of these alternative modes has its own attributes, such as cost, time, or better health. Each attribute has its own assigned levels as well. For example, a time attribute might have different levels, such as 20 minutes, 30 minutes, or 40 minutes. Different combinations of these attributes and levels are presented to the respondents in a CE survey. In each scenario, respondents need to consider the tradeoffs and select their most preferred mode of transport. Choice experiment survey has the advantage of providing behavioral response to new polices before implementation. For example, if the new policy is trying to reduce air pollution and congestion through increasing a parking fee, then the reasonable amount which is accepted by society and at the same time has effective results on lowering number of individual trips could be inferred with CE survey. Furthermore, choice experiment gives the probability of limiting the scope of the research to the most important factors which influence the research.
Revealed Preference Method to Value Changes in Welfare from Modal shift
Revealed preference methods estimate welfare based on respondents actual behavior in a real market; for example, the amount of money respondents spent on cleaner products or environmental friendly vehicles. Revealed preference techniques can only be used in the existence of related market prices. Thus, they can only measure use values, and their application in capturing non-marketed benefits has limitations. Revealed preference methods, for example, use respondents’ revealed trip information, such as the time it takes to drive to work every day, the toll, congestion fee, parking fee, and other information to estimate the cost of the trip to work for each individual31. Due to economic theories, individuals are assumed to have a rational choice, after evaluating costs of mode of transport in monetary term and also the opportunity cost of time to decide about choice of travel mode.
The most commonly used revealed preference techniques are the hedonic price method and the travel cost method. Other revealed preference techniques that are used less than others are production function, replacement cost, and mitigate or preventive expenditure approaches.
Value of Statistical Life (VSL)
The VSL is one of the controversial concepts within CBA analysis. The VSL has been used to value the change in premature mortality and morbidity due to the environmental improvement32,24,33. This in general terms is the amount of money citizens are willing to pay to avoid premature death due to environmental risks. This estimation is based on behavioral reactions of individuals when trading their health for money34. By definition, the VSL is the sum of individual WTPs for eliminating the risk of death for one randomly chosen person among them or saving one statistical life35. In the labor market, VSL can be estimated by asking individuals how much extra wage they require to accept a job that induces additional health risk36.
The WTP concept using stated preference method in estimating VSL is thought to be accurate if studied population has similar preferences for risk avoidance36. Then individuals are directly asked about the financial amount of their WTP to avoid premature risk due to the risk being studied – in our case, air pollution. Individuals’ stated benefits could be aggregated to estimate VSL. A World Bank37 report in 2007, on estimating the cost of pollution in China makes a clear statement about VSL: “ If the risk of death is reduced by 1 in 10,000 annually for each of 10,000 persons exposed to air pollution, then on average one life—termed a statistical life—will be saved”37 (p: 68). For example, if one person is paying $100 to avoid premature death due to environmental risks, then a population of 10,000 is willing to pay $1 million to prevent premature death of one member of that population.
The reveled preference methods to estimate VSL is usually based on costs of avoiding risk in an actual situation. For example, to estimate the VSL, economists can estimate the wage difference between two jobs and then calculate the proportion risk of injury or death in two jobs38. In transport, for example, respondents’ decisions on the purchase of green vehicles can be used to estimate VSL. The car market with a variety of models that use alternative energy and hence cause less health risk resulting from exhaust emissions reveals consumers’ total WTP to buy cleaner cars. The hedonic model has been extensively used to estimate VSL in car market39.
Discussion and Conclusion
Generally, the travel behaviour of citizens is highly influenced by car where the net outcome of that is pollution and congestion. Review of data in the Southeast Asia region showed in most countries that rapid development has resulted in thousands more kilometres of paved roads, millions more cars, and a billion more tons of CO2 and other pollutants. Hence, new policies with the aim of maximizing societal welfare must be considered. Policies such as congestion fee, road pricing, parking fee, carbon tax, import restrictions, fuel tax, and other instruments have been practiced successfully in many countries. The aim of these polices is to internalize the external cost of transportation, or in simpler terms, to make the polluters take the burden of damages they cause. Implementing these policies in case study countries such as Singapore, United Kingdom, Sweden, Italy, and others has resulted in significant reduction in congestion, promoted modal shift, and decreased the air pollution. Implementing transport policies would be successful only if their benefits outweigh their total costs and if the general public supports them. Economists introduced various methods to measure public preferences and values for policy changes. Revealed preference methods are based on observations of individuals’ behaviour in a real market, such as the clean fuel car market. While stated preference methods measure the individual preferences under hypothetical situations and stated markets, the SP methods calculate the change in society’s welfare based on their WTP or WTA. For instance, even the “value of life” can sometimes be reasonably well described by the metric “willingness to pay X dollars for a reduction in the risk of death by Y percent a year or something like it”40 (p.38). The value of statistical life has been a widely accepted method to estimate premature mortality and morbidity due to the environmental improvement.
Southeast Asian countries, hence, need to consider new policies and the impact of those policies on the well-being of their society, since, otherwise, countries place emphasis uncritically on development and neglect the intangible and non-market benefits in their estimation, which will result in irretrievable damage to the society and the environment.
Acknowledgment
Authors wish to thank Universiti Putra Malaysia (UPM) Research University Grant Scheme (RUGS: 9357700) to
provide financial support for this study.
References
-
World Health organization (WHO) (2004). Health and Environment: Tools for Effective Decision-Making: the WHO/UNEP Health and Environment Linkages Initiative Review of Initial Findings, 2004. Accessed March 2015, Available from: http://www.who.int/heli/publications/helirevbrochure.pdf
-
World Health Organization. (2012). Guidance on regulations for the Transport of Infectious Substances 2013-2014. International Health Regulations Coordination, World Health Organization, Geneva, Switzerland. http://www. who. int/ihr/publications/who_hse_ihr_20100801_en. pdf.
-
Krzyzanowski, M., Kuna-Dibbert, B., & Schneider, J. (Eds.). (2005). Health effects of transport-related air pollution. Copenhagen, Denmark: World Health Organization.
-
Heilig, G. K. (2012). World urbanization prospects: the 2011 revision. United Nations, Department of Economic and Social Affairs (DESA), Population Division, Population Estimates and Projections Section, New York.
-
UNESCAPE(2013). United Nations. Statistical Yearbook for Asia and the Pacific. Accessed online on February 2015. Available online: http://www.unescap.org/resources/statistical-yearbook-asia-and-pacific-2013
-
World Bank Group (Ed.). (2013). World Development Indicators 2012. World Bank Publications. Accessed on January 2015. Available online: http://data.worldbank.org/news/new-suite-of-world-development-Indicators-products-now-available
-
Timilsina, G. R., & Dulal, H. B. (2008). Fiscal policy instruments for reducing congestion and atmospheric emissions in the transport sector: A review. World Bank Policy Research Working Paper Series, Vol.
CrossRef -
Poudenx, P. (2008). The effect of transportation policies on energy consumption and greenhouse gas emission from urban passenger transportation. Transportation Research Part A: Policy and Practice, 42(6), 901-909.
CrossRef -
Goh, M. (2002). Congestion management and electronic road pricing in Singapore. Journal of Transport Geography, 10(1), 29-38.
CrossRef -
Song, S. (2015). Should China Implement Congestion Pricing?. Chinese Economy, 48(1), 57-67.
CrossRef -
Pike, E. (2010). Congestion Charging: Challenges and Opportunities.
-
Pardo, C.F. (2007). Congestion Charging: Singapore, London, Stockholm. 2nd International Exhibition for Transport and Traffic technologies. Accessed on September 2013. Available online: http://www.sutp.org/ins-pol-supporting-docs?download=379:congestion-charging-singapore-london-stockholm
-
Eliasson, J. (2014). The Stockholm congestion charges: an overview (No. 2014: 7). CTS-Centre for Transport Studies Stockholm (KTH and VTI).
-
Börjesson, M., Brundell-Freij, K., & Eliasson, J. (2014). Not invented here: Transferability of congestion charges effects. Transport Policy, 36, 263-271.
CrossRef -
Eliasson, J., Hultkrantz, L., Nerhagen, L., & Rosqvist, L. S. (2009). The Stockholm congestion–charging trial 2006: Overview of effects. Transportation Research Part A: Policy and Practice, 43(3), 240-250.
CrossRef -
Percoco, M. (2014a). Cost Distribution and the Acceptability of Road Pricing: Evidence from Milan’s Referendum. Mimeo: Università Bocconi.
CrossRef -
Percoco, M. (2014b). The effect of road pricing on traffic composition: Evidence from a natural experiment in Milan, Italy. Transport Policy, 31, 55-60.
-
Cesaroni, G., Boogaard, H., Jonkers, S., Porta, D., Badaloni, C., Cattani, G., ... & Hoek, G. (2012). Health benefits of traffic-related air pollution reduction in different socioeconomic groups: the effect of low-emission zoning in Rome. Occupational and environmental medicine, 69(2), 133-139.
CrossRef -
Percoco, M. (2013). Is road pricing effective in abating pollution? Evidence from Milan. Transportation Research Part D: Transport and Environment, 25, 112-118.
CrossRef -
UNEP (2015). cleaner, more efficient vehicles. Accessed on March 2015. Available online http://www.unep.org/transport/gfei/autotool/approaches/traffic_control_measeures/parking.asp
-
Henao, A., Piatkowski, D., Luckey, K. S., Nordback, K., Marshall, W. E., & Krizek, K. J. (2015). Sustainable transportation infrastructure investments and mode share changes: A 20-year background of Boulder, Colorado. Transport Policy, 37, 64-71.
CrossRef -
Tillema, T., van Wee, B., & Ettema, D. (2010). The influence of (toll-related) travel costs in residential location decisions of households: A stated choice approach. Transportation Research Part A: Policy and Practice, 44(10), 785-796.
-
Pigou, A. C. (1932). The economics of welfare, 1920. McMillan & Co., London.
-
Amalia, M. (2010). Designing a Choice Modelling Survey to Value the Health and Environmental Impacts of Air Pollution from the Transport Sector in the Jakarta Metropolitan Area (No. rr2010111). Economy and Environment Program for Southeast Asia (EEPSEA).
-
Parson, E. A. (1995). Integrated assessment and environmental policy making: in pursuit of usefulness. Energy Policy, 23(4), 463-475.
-
Hensher, D. A., Rose, J. M., & Greene, W. H. (2005). Applied choice analysis: a primer. Cambridge University Press.
CrossRef -
Davidson, J.D. (1973) Forecasting traffic on STOL. Operations Research Quarterly 24: 561-9.
-
Louviere J.J., Meyer, R., Stetzer, F. & Beavers, L.L. (1973) Theory, methodology and findings in mode choice behaviour. Working Paper No. 11, The Institute of Urban and Regional Research, The University of Iowa, Iowa City.
-
Hensher, D. A. (1994). Stated preference analysis of travel choices: the state of practice. Transportation, 21(2), 107-133.
-
Alpizar, F., & Carlsson, F. (2003). Policy implications and analysis of the determinants of travel mode choice: an application of choice experiments to metropolitan Costa Rica. Environment and Development Economics, 8(04), 603-619.
CrossRef -
Morikawa, T. (1994). Correcting state dependence and serial correlation in the RP/SP combined estimation method. Transportation, 21(2), 153-165.
-
Bowland, B. J., & Beghin, J. C. (2001). Robust estimates of value of a statistical life for developing economies. Journal of Policy Modeling, 23(4), 385-396.
CrossRef -
Rafiq, M. (2011). Published by the South Asian Network for Development and Environmental Economics (SANDEE) PO Box 8975, EPC 1056, Kathmandu, Nepal.
-
Johansson, P. O. (2007). On the definition and estimation of the value of a ‘statistical life’. Cost-benefit analysis and incentives in evaluation. Edward Elgar Publisher, Williston, 208-231.
-
Croitoru, L., & Sarraf, M. (2010). The Cost of Environmental Degradation. Case Studies from the Middle East and North Africa. Washington DC: The World Bank.
-
Aldy, J. E., & Viscusi, W. K. (2008). Adjusting the value of a statistical life for age and cohort effects. The Review of Economics and Statistics, 90(3), 573-581.
CrossRef -
World Bank (Washington, DC). (2007). Cost of Pollution in China: Economic Estimates of Physical Damages. World Bank. Available online: http://siteresources.worldbank.org/INTEAPREGTOPENVIRONMENT/Resources/China_Cost_of_Pollution.pdf
-
Brannon, I. (2004). What Is a Life Worth?. Regulation, 27(4), 60-63.
-
Andersson, H. (2005). The value of safety as revealed in the Swedish car market: an application of the hedonic pricing approach. Journal of Risk and Uncertainty, 30(3), 211-239.
CrossRef -
Gen, S. (2004). Meta-analysis of environmental valuation studies. PhD thesis, Georgia Institute of Technology.


