Seasonal Variation in Water Quality of Lukha River, Meghalaya, India
R. Eugene Lamare 1 and O. P. Singh 1 *
http://dx.doi.org/10.12944/CWE.11.1.14
Lukha River (Wah Lukha) is one of the major rivers of Meghalaya situated in the southern part of East Jaintia Hills District. Activities such as mining of coal and limestone, manufacturing of cement, deforestation etc. have been taking place in the catchment area of the river leading to changes in water quality. This is evident from the deep blue appearance of water of Lukha River during winter months for the last 7-8 years.Till date no convincing and conclusive reason has been given for this annual change in physical appearance.To get insight, we studied the physico-chemical water quality parameters of this river in different seasons and found that the water quality has started deteriorating due to activities occurring in the catchment area. Based on Canadian Council of Ministers of the Environment-Water Quality Index (CCME-WQI) the water of the river at some locations was found of ‘poor’ quality.
Copy the following to cite this article:
Lamare R. E, Singh O. P. Seasonal Variation in Water Quality of Lukha River, Meghalaya, India. Curr World Environ 2016;11(1) DOI:http://dx.doi.org/10.12944/CWE.11.1.14
Copy the following to cite this URL:
Lamare R. E, Singh O. P. Seasonal Variation in Water Quality of Lukha River, Meghalaya, India. Curr World Environ 2016;11(1). Available from: http://www.cwejournal.org/?p=13824
Download article (pdf) Citation Manager Publish History
Introduction
Meghalaya is one of the North-Eastern State of India. Owing to high rainfall, the state is rich in water resources and a dense network of streams and rivers exist. The state is also endowed with rich mineral resources such as coal, limestone, clay, sillimanite, uranium etc. Exploitation of coal and limestone is taking place at a large scale leading to environmental degradation including deterioration of water quality.1,2,3,4,5
Studies done in surrounding areas of Meghalaya have shown adverse impact of coal mining on the environment, in general and on water quality, in particular.1,2 Reduction in abundance and species diversity of aquatic organisms2,6; diminishing plant diversity due to change in Land use land cover (LULC),7,8 significant negative changesin forest cover and forest types9,10; degradation in agriculture field and its productivity11 etc. have been reported by various researchers. Likewise, negative impact of limestone mining and cement manufacturing on water quality and forest cover has been reported.3,4,5 In this research paper, results of studies done on water quality of Lukha River in three seasons of 2013 and 2014 have been reported. Based on CCME-Water Quality Index the water of Lukha river can be categorized from ‘excellent’ to ‘poor’ quality at some sampling locations.
Materials and Methods
Study Area
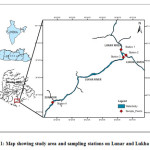
Lukha River is located in the southern part of East Jaintia Hills, Meghalaya. Its main tributaries originate from the catchments of Saipung Reserve Forest. Along its route, it also receives water from Lunar River(Wah Lunar) and small streams draining from the Narpuh Reserve Forest and the undulating hills of the area. Like other rivers of Meghalaya, the Lukha River is, mainlyfed by monsoon rain and flows in south-west direction and later takes a southern path after joining Lunar Rivernear Khaddum Village. From the confluence point onward, the water body is known as Lukha River(Wah Lukha). Finally, the river drains passes via Sonapur village than into the Surma valley and ultimately ends up in the flood plains of Bangladesh.
Sampling Seasons and Locations
To evaluate the water quality of Lukha River, sampling was done in winter (January-February), pre monsoon (April-May) and post monsoon (October-November) seasons of 2013 and 2014 from four different sampling locations as indicated in Figure 1. Inaccessibility, rough terrain and high water level in rainy season restricted us to choose only four sampling locations. Water samples were collected in pre-cleaned jerican (previously washed with 10% nitric acid and cleansed with distilled water) and then transported to the laboratory for analysis of various physico-chemical parameters.
Brief descriptions of the four sampling locations are given below:
Sampling Station 1 (SS1)
The geographical co-ordinates of SS1 are 25°09’38.25”N latitude and 92°26’14.27”E longitude and is situated on the southern side of Lunar River (Wah Lunar means “The Aggressive River”in Jaintia)distance approximately 100-200 meters before the confluence of Lunar and Lukha Rivers. The small streams draining from the coal mining areas of Khliehriat, Sutnga, Byndihati etc. and limestone mining areas and cement plants of Lumshnong village and its adjacent areas are the tributaries of Lunar River.
 |
|
Sampling Station 2 (SS2)
The SS2 was located at 25° 09’19.26”N latitude and 92° 26’33.88”E longitude on the Lukha river (Wah Lukha means “The Serene River” in Jaintia). At this site, the river receives water from the Reserve Forest situated in the area which is also free from human interference. During winter season, water samples were collected approximately 200-300 meters before the confluence. During pre-monsoon and post-monsoon seasons, due to high level of water and difficult terrain, sampling was done just before the meeting points of two rivers.
Sampling Station 3 (SS3)
The SS3 was selected at the confluence of Wah Lunar and Wah Lukha. Water samples were collected from approximately 100-200 meters downstream from the confluence point located at 25°09’12.34”N latitude and 92° 26’23.67”E longitude. During dry season, shallow part of the river bed consisting of boulders and pebbles of different shape and sizes gets exposed whereas the same remains submerged during the monsoon season.
Sampling Station 4 (SS4)
The SS4 was located near Sonapur village and lies at 25° 06’34.09”N latitude and 92° 21’42.97”E longitude. It is situated downstream of SS3 and includes the river stretch which turns blue during winter season every year.
Analysis of Physico-chemical Parameters
To study the water quality, 13 water quality parameters were analysed. pH and Electrical Conductivity were measured at the time of sampling in the field using portable EUTECH PCTestr 35 (0.01 Accuracy). In-situ estimation of turbidity was done using Turbidimeter TN-100 (±2% Accuracy). The other physico-chemical water parameters like total solid (TS), total hardness (TH), calcium (Ca), magnesium (Mg), chloride (Cl), sulphate (SO4), phosphate (PO4), nitrate (NO3), DO and BOD were analysed in the laboratory following the standard procedures.12,13,14
Water Quality Index (WQI)
The overall analytical data of the various water quality parameters studied does not give clear cut information about the quality status of the water. Hence, various Water Quality Indices have been developed by different researchersto give simplified information on water quality.15,16,17 Water Quality Index developed by the Canadian Council of Ministers of the Environment (CCME-WQI) has been used in present study.
The CCME-WQI incorporates three main elements: scope (F1), frequency (F2) and amplitude (F3). It then produces number between 0-100, where 0 represents the “worst” water quality and 100 represents the “best” water quality.16 In this adopted index, the data of various parameters analysed were incorporated in the CCME-WQI equation given below so as to obtain the single index value representing the overall water quality status of different sampling stations.

BIS18 and ICMR19 standards were adopted in this study for water parameters standards. The index number obtained after computation are further divided into five descriptive categories/ ranking viz. WQI between 95 to100- Excellent; 80 to 94- Good; 65 to 79- Fair; 45 to 64- Marginal; and 0 to 44- Poor.16
Results and Discussion
Physico-chemical properties of Lukha River
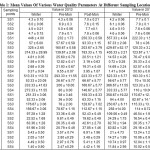
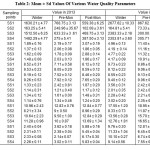
Altogether 13 physico-chemical parameters (pH, electrical conductivity, turbidity, total solid, total hardness, calcium, magnesium, chloride, sulphate, phosphate, nitrate , DO and BOD) were analysed from four sampling locations of Lukha river. The water quality data (mean values) obtained from SS1, SS2, SS3 and SS4 sampling locations during winter (January-February), pre monsoon (April-May) and post monsoon (October-November) seasons of 2013 and 2014 are presented in Table 1 and 2. The seasonal variations in different parameters at different locations are discussed below:
 |
|
 |
|
pH
The pH of river water during winter season was found between 4.3 to 6.0 in 2013 and 4.2 to 6.1 in 2014. It ranged from 4.3 to 7.9 and 7.7 to 7.9 during pre monsoon of 2013 and 2014, respectively. In post monsoon season of 2013, pH of water ranged from 7.0 to 7.8 and 4.7 to 7.8 in 2014. pH value measures the alkalinity or acidic nature of water.20 The pH values were found to be below the recommended values i.e. 6.5 to 8.5 during winter season. Highly acidic nature of water at SS1, SS3 and SS4 during winter season could be mainly due to significant amount of acid mine drainage (AMD) contaminated water received from the coal mining areas of Jaintia Hills. The water during winter was found more acidic than in other seasons. This is because in other seasons river water gets diluted due to high volume of rainfall.
Coal, overburden and abandoned mines discharged acidic water and contaminate the streams of the area.1,2 However, in SS2 the water was found slightly acidic to alkaline in nature. Similar seasonal variations of pH of water were recorded in a lake of the region.21 In SS4, pH was found slightly alkaline in nature during the pre and post monsoon seasons in both of the years. This is because the water is being neutralised by multiple small streams carrying non-acidic water as it flows from SS3 to SS4.
Electrical Conductivity (EC)
High or low EC in water is due to an elevated or reduced level of dissolved ions. The EC values monitored during winter, pre monsoon and post monsoon seasons of 2013 ranged between 57.00µS/cm to 446.00µS/cm; 57.67µS/cm to 232.00µS/cm; and 93.33µS/cm to 250.33µS/cm, respectively. In 2014, EC value varies from 67.33µS/cm to 557.33µS/cm during winter; 78.00µS/cm to 222.33µS/cm in pre monsoon; and 99.67µS/cm to 364.33µS/cm in post monsoon. Significantly higher EC values were observed in SS1 throughout the study period indicating presence of elevated levels of dissolved ions in the river water. SS2 located on upstream of Lukha River displayed minimal electrical conductivity because it does not receive any contaminants from the mining area. Rather, it originates from the forested area of the reserve forest. However, level of conductivity at SS3 and SS4 was found to be low as compared to SS1 indicating dilution and mixing of river water coupled with self-purification process as it flow downstream. Relatively high value of EC in Lukha River can be attributed to high concentration of ions contributed by surrounding mining areas.
Turbidity
The intensity of cloudiness/murkiness of water determines its turbidity level. In other words, water having variety of suspended materials in it will exhibit elevated level of turbidity and vice versa. Turbidity of water samples recorded during winter, pre monsoon and post monsoon of 2013 varies from 0.37 NTU to 4.81 NTU; 9.55 NTU to 25.60 NTU; and 3.19 NTU to 20.15 NTU, respectively. However, it varied between 0.72 NTU to 14.53 NTU in winter; 35.33 NTU to 76.47 NTU in pre monsoon; and 1.59 NTU to 3.94 NTU in post monsoon season of 2014. Seasonal variations of turbidity were observed at different sampling sites and maximum level of turbidity was recorded at SS1 throughout the study period. In both the years, pre monsoon seasons were found to exhibit maximum turbidity with values exceeding the prescribed limit of BIS (i.e. 5 NTU). This may be due to large amount of soil particles or sediment that surface runoff drained into the river. However, the turbidity level in SS3 was found slightly less, because of dilution of water by its mixing it with the water of SS2. However, turbidity level further reduced at SS4 due to settlement or dilutions of the suspended material as the river flows downstream.
Total Solids (TS)
TS determine the solid content dissolved or suspended in water. Normal functioning of aquatic ecosystem is hampered when concentration of TS in water is relatively high. In 2013, during winter TS concentration ranged from 53.33 mg/l to 513.33 mg/l; during pre monsoon from 26.67 mg/l to 293.33 mg/l; and during post monsoon from 66.67 mg/l to 223.33 mg/l. During winter, pre-monsoon and post monsoon of 2014, TS contents were found in the range of 56.67 mg/l to 523.33 mg/l; 70.00 mg/l to 193.33 mg/l; and 66.67 mg/l to 313.33 mg/l, respectively. The lowest concentration of TS recorded was in SS2 and the highest was in SS1. High TS content recorded may be attributed to the presence of elevated solid materials (both dissolved and suspended) contributed by various anthropogenic activities taking place in the catchment area.
Total Hardness (TH)
Hardness value of water gives us a general idea of how easy water can form suds with soap, scale formation in water pipes or boilers. In the present investigation, TH level in 2013 ranged between 53.33 mg/l to 251.33 mg/l during winter; 36.00 mg/l to 98.00 mg/l during pre monsoon; and 63.33 mg/l to 159.33 mg/l during post monsoon. Least TH value was recorded in SS2 and maximum in SS1. TH value varied from 94.00mg/l to 358.67 mg/l; 82.67 mg/l to 170.67 mg/l; and 71.33 mg/l to 238.67 mg/l during winter, pre monsoon and post monsoon seasons of 2014, respectively. In both the years, TH was found maximum at SS1 with class of hardness under category ‘hard’ in all sampling seasons except during pre monsoon of 2013 and winter of 2014. However, SS2 exhibited water quality under category ‘soft’ during 2013 and ‘moderately hard’ during 2014. At SS3 and SS4, the water samples were found ‘hard’ during winter season and ‘moderately hard’ during pre monsoon season in both the years. However, in post monsoon season water exhibited ‘moderately hard’ to ‘hard’ water category during 2013 and 2014, respectively.
Calcium (Ca2+)
Calcium is an important constituent present in natural water. It is also one of the main cations contributing to hardness in water. Permissible limit for calcium content in water is less than 75mg/l. The concentration of calcium in SS1 varied from 33.36mg/l to 109.06mg/l; 9.81mg/l to 34.29mg/l in SS2; 326.35mg/l to 69.81mg/l in SS3; and in SS4 25.79mg/l to 83.82mg/l.Calcium concentration was found least during pre monsoon of 2013 (9.81mg/l) and maximum during winter of 2014 (109.06mg/l).Calcium concentration was observed to be increasing significantly from 2013 and 2014.The level of calcium concentration monitored during present study was found varying as SS1>SS3>SS4 during winter season of 2014. The Ca2+ in river water can be coming from limestone mining areas located in the catchment area of the river.
Magnesium (Mg2+)
Level of magnesium in the river water studied is relatively less and within the permissible limit of 30mg/l. Its concentrations varied from 1.40mg/l to 6.91mg/l and 8.35mg/l to 21.00 mg/l in 2013 and 2014, respectively.
Sulphate (SO42-)
It is a naturally occurring anion present in all kinds of natural waters. When concentration of sulphate is more than 200mg/l the water is not recommended for use for any domestic purpose. The analytical results of the river water samples revealed sulphate content as the most prominent anions present in excess amount of all parameters studied. The sulphate value in SS1 ranged between 559.38mg/l to 2677.62 mg/l; in SS2 it varied between 73.33mg/l to 248.96mg/l (minimum); in SS3 varied between 300.00 mg/l to 2383.33mg/l; and in SS4 varied between 275.00mg/l to 2353.81mg/l. The maximum value of sulphate (2677.62mg/l) was observed in SS1 during winter season and minimum value of 73.33mg/l in SS2 during pre monsoon of 2014. Sulphate concentration at all sampling stations and seasons was found exceeding the prescribed standard limit except in SS2. Concentration of sulphate was found to be extensively high during the winter season.
This excessive amount of sulphate content in Lukha river water may be attributed to the contamination of acid mine drainage (AMD) generated from the coal mining areas and coal storage sites of cement plants which use coal to generate power. High concentration of sulphate in water samples collected in the vicinity of cement plants has been reported earlier.3
Phosphate
Phosphate in natural water is present as soluble phosphates and organic phosphates.22 Analysis of phosphate in water samples collected showed that its concentration ranged from 1.37 mg/l to 1.89 mg/l during winter; 1.78 mg/l to 2.19 mg/l during pre monsoon; and 1.86 mg/l to 3.07 mg/l during post monsoon of 2013. In 2014, it varied from 4.17 mg/l to 4.96 mg/l during winter; 10.91 mg/l to 11.40 mg/l in pre monsoon; and 2.85 mg/l to 3.37 mg/l in post monsoon seasons. Throughout the study period, phosphate level remained low at all sampling sites except during pre monsoon season of 2014. This could be due to the surface runoff carrying phosphate rich material from the surrounding catchment area of the river.
Dissolve Oxygen (DO)
Dissolve oxygen content of any water body depends on the mixing and aeration of water, water temperature, duration of sunlight received and altitude of the area.23 The concentration of DO level in the studied river water was found to be good throughout the sampling period with little seasonal variation. Throughout the study period, concentration ranges from 7.1 mg/l to 9.73 mg/l, showing moderately good level of DO.
Biochemical Oxygen Demand (BOD)
The data on seasonal variation of BOD levels in the river water at SS1, SS2, SS3 and SS4 during winter, pre monsoon and post monsoon of 2013 varied between 1.14mg/l to 1.33 mg/l; 1.21 mg/l to 2.42 mg/l; and 1.17 mg/l to 1.87 mg/l, respectively. In 2014 the BOD level during winter was found varying between 2.01mg/l to 3.56 mg/l; pre monsoon between 2.21mg/l to 2.42mg/l; and post monsoon between 1.54mg/l to 1.75mg/l. The maximum BOD level (3.56 mg/l) was detected in LS1 during winter of 2014 and minimum (1.14 mg/l) in SS2. The seasonal variation of BOD in the river water was also not significant throughout the study period. Relatively low BOD concentration and insignificant seasonal variation was observed throughout the study period indicating that river is relatively free from organic pollutants. The BOD data is in consonant with DO level of the water.
Chloride
Sources of chloride in natural waters may be from soil, municipal or industrial sewage and wastes of animal origin.24 Chloride content in water of Lukha River ranged between 8.21mg/l to 11.28mg/l in winter; 9.00 mg/l to 12.83 mg/l in pre monsoon; and 8.96mg/l to 13.69mg/l in post monsoon of 2013. However, its values ranged between 8.33mg/l to 17.55mg/l; 11.87mg/l to 18.95 mg/l; and 9.51 mg/l to 15.67 mg/l during winter, pre monsoon and post monsoon of 2014, respectively. The concentration of chloride was lower in SS2 as compared to other sampling stations throughout the study period. However, analysis of chloride does not display any significant seasonal variations. The concentration of chloride was found within the permissible limit (BIS: 250 mg/l) thus, indicating absence of chloride pollution sources in the catchment area of the river.
Nitrate
Nitrate in water of Lukha River varied from 2.26mg/l to 2.40 mg/l; 2.14 mg/l to 3.62 mg/l; 5.45 mg/l to 6.17 mg/l during winter, pre monsoon and post monsoon of 2013, respectively. However, in 2014 nitrate concentration varied from 9.14mg/l to 11.33 mg/l during winter; 6.47mg/l to 12.81 mg/l in pre monsoon; and 2.90 mg/l to 3.38 mg/l in post monsoon of 2014. Concentration of nitrate recorded at all stations was found to be below the permissible limit (BIS: 45mg/l).
CCME-WQI Assessment
Water quality indices give a general idea of the status of the water quality. In present study,CCME-WQI was computed using data of various physico-chemical parameters. Application of the CCME-WQI for assessment of water quality has been used reliably by researcher.25,26,27 The data of the various water quality parameters except the value of total solid and phosphates (as no standards are available for these parameters) obtained in present study were incorporated to calculate CCME-WQI value for the water of Lukha river in this index calculation. The results of the computed CCME-WQI are presented in Table 3. As a result, the total number of variables incorporated in this calculation is 11, giving a total number of 66 tests.
Table 3: Cumulative Ccme Wqi Data And Quality Status Of Lukha River
|
Stations |
Station 1 |
Station 2 |
Station 3 |
Station 4 |
|
F1 |
54.55 |
27.27 |
45.45 |
45.45 |
|
F2 |
31.82 |
7.58 |
28.79 |
19.70 |
|
F3 |
50.15 |
10.84 |
44.69 |
36.02 |
|
No. of Failed Variables |
6.00 |
3.00 |
5.00 |
5.00 |
|
Total No. of Failed Test |
21.00 |
5.00 |
19.00 |
13.00 |
|
CCME WQI |
38.73 |
76.97 |
46.85 |
53.46 |
|
Ranking |
Poor |
Fair |
Marginal |
Marginal |
The number of variables deviating from their objectives was found maximum at SS1 and minimum at SS2. The failed variable at SS1 includes pH, EC, turbidity, total hardness, calcium and sulphate. The total number of failed test will be higher in water samples contaminated or polluted in nature. As a result, number of failed test recorded was at SS1 (21) > SS3 (19) > SS4 (13) > SS2 (5). The computed scope (F1), frequency (F2) and amplitude (F3) of the river water at different monitoring stations was found to range from 27.27 to 54.55; 7.58 to 32.82 and 10.84 to 50.15, respectively. SS1 exhibited maximum F1, F2 and F3 values whereas minimum values were monitored in SS2.
Based on the calculated CCME-WQI values, the overall water quality status of Lukha River at SS1 was found ‘poor’ having index value of 38.73. The poor quality of water is attributed by elevated pH, EC and turbidity level and high concentration of total hardness, calcium and sulphate in water. However, at SS2 water was found to be of ‘fair’ category. However, at SS3 WQI value was found to be 46.85 and then increased to 53.46 at SS4. Both stations possess water quality under ‘marginal’ category indicating water is frequently threatened or impaired. At SS4 water quality was found better compared to that of other locations probably due to dilution and self purification processes taking place during the course of flow of the river. Data of various water quality parameters and CCME-WQI clearly indicate that Lukha River is slowly getting adversely affected by the various activities such mining of coal and limestone and manufacturing of cement taking place in the catchment area. Therefore, steps are needed to further check this deterioration problem associated with degradation of water quality.
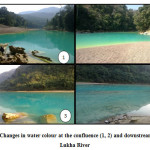
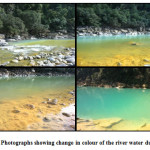
Change in Water Colour
For last 7-8 years people have observed a change in water colour of Lukha River during the winter months and it is distinctly visible near Sonapur village. During the months of December, January and February, the water colour appears deep blue (Figure 2) and is a matter of discussion by the people of Meghalaya. Often effluents from coal and limestone mining areas and effluent from cement plants are cited probable reasons for this change in colour. However, no convincing and conclusive evidences have been produced and no direct link has been established for this unusual phenomenon. On some occasion death of fishes has also been reported from the river near Sonapur village.
 |
|
Survey of the area revealed that a few Kilometres upstream of Sonapur village is the confluence site of the two rivers, the Lukha and Lunar River. These rivers appear distinct in their appearance. The water of Lunar River exhibits slightly yellowish green colour due to presence of thick yellowish powdery and slimy sediments deposited at the river bed. Whereas, the water of Lukha River appears clear as the boulders and pebbles present on the river bed were clearly visible.
The results of physico-chemical analysis gave no clue for appearance of blue colour of the river. However, reasons based on observations during survey and results of laboratory analysis are discussed below which could individually or in combination be the factors for the appearance of blue colour of the Lukha River during winter months.
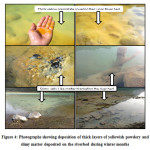
The present study revealed low pH and high concentration of sulphate in the river water during winter months contributed mainly by coal mining areas and coal storage sites of cement plants located in the vicinity of the catchment area. Because, it is known that streams in coal mining areas carry highly acidic water with high sulphate content.1,28 Study on Wilge River – a tributary of Vaal River in South Africa reported a similar situation where acidic water drained from the old coal mining was found to have significantly high sulphate content. This water generate sky blue colour upon mixing with water of the other streams. They believed that precipitation of aluminium compound was responsible for causing blue colour of Wilge River.29 In the case of Lukha River, acid mine drainage (AMD) from coal mining areas and powdery sediment, most likely originating from cement plants could be causing precipitation of aluminium and such other compounds in water upon mixing of the two rivers thereby generate blue colour in water. Lukha River water level and flow was significantly lesser during winter season as compared with that of Lunar River. Hence, dilution of Lunar River water by Lukha River water is minimal. Upon the mixing of these two different water at the confluence, a remarkably change in water colour was observed. The colour was observed to change immediately to light turquoise then light blue and ultimately deep blue as we go downriver (Figure 3). This phenomenon is prominently visible in winter because of low flow rate but river water was found highly acidic and has high concentration of dissolved solids. In other seasons, water of the river gets diluted with rain water. These factors could be the causing scattering of light and bring change to blue colour of water. The blue colour was more prominent in deeper parts of the river rather than in shallow stretch, also this fact gets the support of the above explanation because scattering of light increases with increase in depth. Further, it is also known that appearance of blue colour due to scattering is more prominent when there is less reflection of light due to depth of the water and/or due to presence of yellowish-brown coloured sediments at the bottom. In Lukha River, presence of a thick layer of yellowish-brown slimy jelly like deposited on the river bed in winter developed from the thick yellowish powdery sediments could be another reason for this phenomenon (Figure 4). Hence, appearance of blue colour of Lukha River, most likely is mere an illusion due to scattering effect rather than it is actually due to the blue colour of the water.
 |
|
 |
|
Conclusion
Based on our study it can be concluded that water quality of River Lukha is getting affected by anthropogenic activities such as mining of coal and limestone and manufacturing of cement in the catchment area of the river. Water sample at SS1 (Lunar River) was found of ‘poor’ quality mainly due to acidic nature of water, high values of electrical conductivity and turbidity coupled with high concentration of sulphate, total hardness and calcium. However, SS2 (Lukha River) exhibited ‘fair’ type of water quality. Further downstream at SS3 and SS4 (after confluence and near Sonapur Bridge) water quality was found of ‘marginal’ category indicating that water is frequently threatened or impaired. Based on this study, it can be said that low pH and high sulphate concentration of the Lunar River and powdery slimy sediments are mainly responsible for water pollution of Lukha River. Further, appearance of blue colour of Lukha River is most likely due to scattering of light rather than it being due to actual blue colour of the water.
Acknowledgement
The first author is thankful Ministry of Social Justice and Empowerment and the Ministry of Tribal Affairs, (GoI), New Delhi for awarding a Rajiv Gandhi National Fellowship. Our sincere gratitude goes to the people of Nongsning, Mynkree, Chiehruphi, Thangskai, Wahiajer-Narpuh, Lumshnong and Sonapur village for their consistent support and cooperation without which this work would not have been possible.
References
- Swer, S. and Singh, O. P., Status of Water quality in coal mining areas of Meghalaya, India. In: Proceeding of National Seminar on Environmental Engineering with special reference on Mining Environment, Indian Institute of Mines, Dhanbad. p. 1-9 (2003).
- Swer, S. and Singh, O. P., Coal mining impacting water quality and aquatic biodiversity in Jaintia Hills district of Meghalaya. ENVIS Bulletin- Himalayan Ecology,11(2), 29-36 (2004).
- Lamare, R. E. and Singh, O. P., Degradation in water quality due to limestone mining in East Jaintia Hills, Meghalaya, India. International Research Journal of Environmental Science, 3 (5), 13-20 (2014a).
- Lamare, R. E. and Singh, O. P., Localised effect of artisanal and small scale mining of limestone mining on water quality in Meghalaya, India. Pollution Research, 34 (2), 321-329 (2015).
- Chakraborty, K. and Sudhakar, S., The expansion and impact of cement manufacturing units and mining areas in Lumshnong, Jaintia hills, Meghalaya.Current Science, 106 (7), 997-1000 (2014).
- Mylliemngap, B. K. Ramanujam, and S. N., Icthyodiversity in the Coal Mining and adjacent Non-Coal Mining Drainages of Jaintia Hills, India.Asian Fisheries Science, 24, 177-185 (2011).
- Sarma, K. and Kushwaha, S.P.S., Coal mining impact on land use/land cover inJaintia Hills district of Meghalaya, India using Remote Sensing and GIS Technique. (www.itc.nl/library/papers_2005/msc/ereg/sarma.pdf). p. 1-14 (2005).
- Sarma, K., Kushwaha, S.P.S. and Singh, K. J., Impact of coal mining on plant diversity and tree population structure in Jaintia Hills district of Meghalaya, North East India.New York Science Journal, 3(9), 79-85 (2010).
- Lele, N. and Joshi, P. K., Analyzing deforestation rates, spatial forest cover Changes and identifying critical areas of forest cover changes in North-East India during 1972–1999. Environmental Monitoring and Assessment,156, 159-170 (2009).
CrossRef - Somendro, T. and Singh, O. P., Analysis of land use/land cover dynamics using Remote Sensing and GIS Techniques: a case of Jaintia Hills, Meghalaya. International Journal Current Research, 7 (1), 11873-11879 (2015).
- Gupta, S. D., Tiwari, B. K. and Tripathi, R. S., Coal Mining in Jaintia Hills, Meghalaya: An Ecological Perspective. In: Jaintia Hills, A MeghalyaTribe: Its Environment, Land and People. (Eds. P. M. Passah and A. S. Sarma), Reliance Publishing House, New Delhi, p. 121-128 (2002).
- APHA, Standard Methods of Chemical Analysis of Water and Waste Water. 21st Washington DC, USA (2005).
- Maiti, S. K., Handbook of method in environmental studies, Vol.1: Water and Wastewater Analysis, ABD Publishers, Jaipur, Rajasthan. (2001).
- Trivedy, R.K and P. K. Goel, Chemical and biological methods for water pollution studies. Environmental Publication,Karad, India. (1986).
- Brown, R. M., McCleiland, N. J., Deininger, R. A. and O’Connor, M. F. A Water Quality Index – Crossing the Psychological Barrier (Jenkis, S.H., Ed.). Proceeding of International conference on Water, Jerusalem, Isreal. Pollution 6:787-797 (1972).
- Canadian Council of Ministers of the Environment (CCME): Canadian water quality guidelines for the protection of aquatic life: CCME Water Quality Index 1.0, User’s Manual. In Canadian environmental quality guidelines, 1999, Canadian Council of Ministers of the Environment, Winnipeg, Canada (2001).
- Singh, S., Ghosh, N. C., Krishan, G., Galkate, R., Thomas, T. and Jaiswal, R. K. Development of an Overall Water Quality Index (OWQI)for Surface Water in Indian Context. Current World Environment.10(3), 813-822 (2015).
CrossRef - Bureau of Indian Standard (BIS), Standards of water for drinking and other purposes, New Delhi, India (1993).
- Indian Council of Medical Research (ICMR), Manual of standards of quality for drinking water supplies, New Delhi, India (1975).
- Covington, A. K., Whalley, P. D. and Davison, W., Recommendations for the determination of pH in low ionic strength fresh waters. Pure and Applied Chemistry, 57 (6), 877–886 (1985).
CrossRef - Lamare, R. E. and Singh, O. P., Evaluation of water quality in Thadlaskeiñ Lake, West Jaintia Hills, Meghalaya India. Journal of Chemical, Biological and Physical Science, 4 (3), 2651-2656 (2014b).
- Ravindra, K., Meenakshi, A., Monika, R. and Kaushik, A., Seasonal variations in physico-chemical characteristics of River Yamuna in Haryana and its ecological best-designated use. Journal of Environmental Monitoring, 5, 419-426 (2003).
CrossRef - Avvannavar, S. M. and Shrihari, S., Evaluation of water quality index for drinking purposes for river Netravathi, Mangalore, South India. Environmental Monitoring and Assessment,143, 279–290 (2008).
CrossRef - Girija, T. R., Mahanta, C. and Chandramouli, V., Water Quality Assessment of an Untreated Effluent Impacted Urban Stream: The Bharalu Tributary of the Brahmaputra River, India. Environmental Monitoring and Assessment,130, 221–236 (2007).
CrossRef - Manii, J. K. and Zubaidi, A. A.,Assessment of Hydrochemical Water Quality on Al Delmaj Marsh Application of the CCME WQI. Journal of Babylon University/Pure and Applied Sciences. 21(1): 270-280 (2013).
- Gyamfi, C., Boakye, R., Awuah, E. and Anyemedu, F.,Application of the CCME-WQI Model in Assessing the Water Quality of the Aboabo River, Kumasi-Ghana. Journal of. Sustainable Development. 6 (10):1-7 (2013).
CrossRef - Lakshmi, E and Madhu, G. An assessment of water quality in river pariyar, Kerela, South India Using Water Quality index. IOSR Journal of Environmental Science, Toxicology, and Food Technology, 8 (8):11-16 (2014).
CrossRef - Herlihy, A. T., Kaufmann, Mitch. M.E. And Brown, D. D. Regional estimates of acid mine drainage impact on streams in the Mid-Atlantic and South-Eastern United States. Water, Air, and Soil Pollution. 50: 91-107 (1990).
CrossRef - McCarthy T. S. and Pretorius, K., Coal mining on the Highveld and its implications for future water quality in the Vaal River System. In Proceedings International Mine Water Conference, Pretoria, South Africa, pp. 56-65 (2009).


