Water Quality Assessment of River Beas During Winter Season in Himachal Pradesh, India.
Suman Sharma 1 * and Yogesh Kumar Walia 2
http://dx.doi.org/10.12944/CWE.11.1.24
Present investigation was carried out in 256 km stretch of river Beas in Himachal Pradesh for analysis of important physical, chemical and biological water quality parameters during winter season. Parameters such as temperature, pH, conductivity, turbidity, alkalinity, total dissolved solids (TDS), total hardness, calcium, magnesium, potassium, sodium, cadmium, copper, iron, lead, chloride, fluoride, nitrate, biological oxygen demand (BOD), chemical oxygen demand (COD), Colliform and Escherichia coli were analyzed from six sampling stations i.e. Beaskund , Shamshi, Pandohdam, Dharampur, Nadaun and Pongdam in the study area. The analysis of data reveals that turbidity, cadmium and lead, were found to be higher than the acceptable limit prescribed by Bureau of Indian standards (BIS), 2012 for drinking water in India. Colliform and E.coli were present in all the sampling stations of river Beas except at SS-1 and SS-2. All the other physicochemical parameters excepting pH at SS-5 (8.98±0.057) were within the limit prescribed by World Health Organization (WHO), 2011 and BIS, 2012 for drinking water in India.
Copy the following to cite this article:
Sharma S, Walia Y. K. Water Quality Assessment of River Beas During Winter Season in Himachal Pradesh, India. Curr World Environ 2016;11(1) DOI:http://dx.doi.org/10.12944/CWE.11.1.24
Copy the following to cite this URL:
Sharma S, Walia Y. K. Water Quality Assessment of River Beas During Winter Season in Himachal Pradesh, India. Curr World Environ 2016;11(1). Available from: http://www.cwejournal.org/?p=13496
Download article (pdf)
Citation Manager
Publish History
Introduction
The rivers and lakes play an important role in lives of human beings. The rivers provide irrigation, potable water, cheap transportation, hydroelectricity and livelihood to large population on the earth1&2. The Indian river system is classified in to four major categories i.e. The Himalayan, the rivers traversing the Deccan Plateau, the Coastal and those in the inland drainage basin. Indus river of Himalayan system consist of the Chenab, the Jhelum, the Ravi, the Satluj and the Beas3. River Beas, an important contributory of the Indus system, is the only tributary of system confined to India. The river Beas is a perennial river fed by snow, rainfall and is covered with extensive cover of vegetation in Himachal Pradesh. River Beas originates from Beaskund, in Pirpanjal range near Rohtang pass at 13326 ft above mean sea level. Total length of river Beas is 470 km, out of which it flows 256 km in Himachal Pradesh. The Parvati, Hurla, Sainj, Tirthan, Uhl, Suketi, Looni, Son, Bakkar, Binwa, Neugal, Mankhad, Baner, Banganga and Chakki river are the major tributaries of river Beas in Himachal Pradesh. The important settlements on the bank of river Beas in Himachal Pradesh are Manali, Kulu, Bhuntar, Pandoh, Mandi, Ladbharol, Dharampur, Jaisinghpur, Sujanpur Tira, Nadaun and Dehra Gopipur. The river water quality is highly variable by nature due to environmental conditions such as basin lithology, vegetation and climate4&5. There are three major natural sources of dissolved and soluble matter carried by rivers, the atmospheric inputs of material, the degradation of terrestrial organic matter and weathering of surface rocks. With continuous growth of population, rapid developments in agriculture, mining, urbanization, industrialization, hydro-electrical generation activities and motor vehicle pollution, the river water contamination with hazardous waste is becoming common phenomena6&7. The rate of discharge of pollutants in to the water is far higher than rate of purification. As water quality and human health are closely related and it is in this context, that the water quality assessment is critical for pollution control and protection of surface and ground water8,9&10. The drinking water requirement of the population of Kulu, Mandi, Hamirpur and Kangra districts of Himachal Pradesh is met by uplifting water from river Beas. Besides this, Beas river water is also used for irrigation and hydroelectricity generation. As no systematic study has been undertaken to assess the water quality of river Beas, hence the present investigation was undertaken.
Materials and Methods
In order to assess the water quality of river Beas, six sampling stations i.e.1.Beaskund (SS-1), 2. Shamshi (SS-2), sampling station three 3.Pandoh Dam (SS-3), 4. Dharampur (SS-4), 5. Nadaun (SS-5) and 6. Pongdam(SS-6) , were selected on the basis of identified pollution problems and upon the location of points of sources of waste water discharge in the selected stretch of river Beas. Using dip and grab sampling method the water samples were collected at about 15cm depth from river Beas. Three water samples were collected during winter season, one every fifteen days in the month of November and December in the year 2014. The temperature was recorded using mercury thermometer, pH was recorded using digital pH meter (Environmental & Scientific Instruments 111E), turbidity was recorded using digital turbidity meter (Environmental & Scientific Instruments 331E) and conductivity was recorded using digital conductivity meter (Environmental & Scientific Instruments 611E) respectably. All the samples were preserved with conc. HNO3 (3ml/L) and conc. HCl (0.5ml/200ml) solution for analysis of remaining physicochemical and biological parameters at Environtech Laboratory Mohali, Punjab, India, using standard methods (APHA 2012)11 and other methods(BIS,1987)12. Sodium and Potassium were determined using Microprocessor Flame Photometer (Environmental & Scientific Instruments 1382).Iron was determined using Spectrophotometer (Environmental & Scientific Instruments 2373). Cadmium, Copper and Lead were determined using Flame Atomic Absorption Spectrometer (LABINDIA AA7000). All the instruments were calibrated according to standard calibration procedures. All the data obtained was subjected to statistical analysis mean and standard deviation.
Results
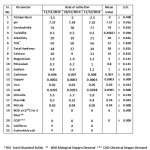
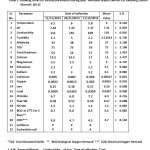
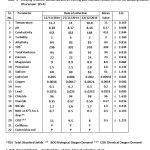
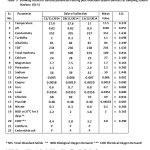
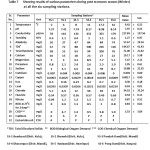
The results of various physicochemical and biological parameters recorded during present study with mean value and standard deviation values at all the six sampling stations are presented in Table 1-6 and comparative analysis of all the six sampling stations is presented in Table 7.
 |
|
 |
|
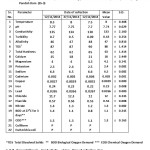 |
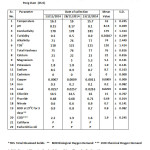
Table 3: Analysis of various parameters during Post Monsoon Season (Winter) at sampling station Pandoh Dam (SS-3) |
 |
|
 |
|
 |
|
 |
|
Discussion
Temperature
Temperature of river water effects chemical and biological reactions, conductivity, pH, and soluble gases. The temperature of river Beas varied widely in the study area with SS-1 recording lowest of -20 C and SS-5 recording highest of 17.50 C with a mean value of 9.42±6.520C.
pH
The pH is measure of acidity or alkalinity of a solution. The mean value of pH of water in study area of river Beas was 7.97±0.55 which was within the acceptable limit of 6.5-8.5 prescribed by BIS, 201213.
Conductivity
The conductivity is numerical expression of water’s ability to conduct electric current and depends on the concentration of ions in solution. The mean value of conductivity of water of river Beas in study area was 217.83±137.56 µS/cm.
Turbidity
The turbidity is the measure of suspended sediment such as silt, clay, organic matter, and microscopic organisms in water sample. The mean value of Turbidity of water in study area of river Beas was 1.27±0.97 NTU, which was slightly higher than acceptable limit of one NTU, but was within the permissible limit of 5 NTU prescribed by BIS, 2012. The higher value of 3 NTU of turbidity at SS-4 was due to confluence of high silt content of rivers Looni and Son with river Beas.
Alkalinity
The alkalinity is capacity to neutralize acid and is usually due to the presence of bicarbonates, carbonates and hydroxide .The mean value of alkalinity of water of river Beas in study area was 57.67±24.54 mg/L, which was within the acceptable limit of 500 mg/L prescribed by BIS, 2012.
Total Dissolved Solids (TDS)
The solids are present in water in suspended or dissolved state and the mean value of TDS of river Beas was 144.67±91.43 mg/L, which was within the acceptable limit of 500 mg/L prescribed by BIS, 2012.
Total Hardness
The total hardness is a measure of dissolved polyvalent metallic ions, and is traditional measure of capacity of water to react with soap and produce lather. The mean value of total hardness of water in study area of river Beas was 71±21.62 mg/L, which was within the acceptable limit of 200 mg/L prescribed by BIS, 2012.
Calcium
Calcium causes both carbonate and non carbonate hardness of water.The mean value of calcium in study area of river Beas was 19.17± 5.58 mg/L, which was within the acceptable limit of 75 mg/L prescribed by BIS, 2012. This concentration of calcium in river water may be due to occurrence of highly soluble halides, gypsum and easily weathered surface rocks in the study area14. The controlled amount of calcium is good for health and is an important factor influencing metabolism and growth, and WHO, 2011 has not proposed any guideline value of calcium15.
Magnesium
Magnesium contributes both carbonate and non carbonate hardness to water. The mean value of magnesium in study area of river Beas was 5.47±2.12 mg/L, which was within the acceptable limit of 30 mg/L prescribed by BIS, 2012.
Potassium
Potassium occurs widely in environment and natural water sources and is an essential element in humans. The mean value of potassium in study area of river Beas was 2.05±0.61 mg/L. The BIS, 2012 and WHO, 2011 has not prescribed any guideline value of the potassium, however high concentration of potassium affects individuals suffering from heart and kidney diseases.
Sodium
Sodium is found virtually in all foods and drinking water and the mean value of sodium in water of study area of river Beas was 19.88±22.35 mg/L. The highest mean value of 61 mg/L was found at SS-4 and may have been due to confluence of river Beas with Looni river, draining the Gumma and Darang area of district Mandi having salt deposits16.
Cadmium
The pollution of water with cadmium is caused by contamination from mining, fertilizers and tobacco products. The mean value of cadmium in water of study area of river Beas was 0.004 mg/L which was higher than acceptable limit of 0.003 mg/L prescribed by BIS, 2012. The higher value of cadmium may be due to extensive mining activities and extensive use of fertilizers in the study area17.
Copper
The copper is used in making pipes, valves, alloys coating and is both essential nutrient and drinking water contaminant. The mean value of copper in water of river Beas was 0.0017 mg/L, which was within the acceptable limit of 0.5 mg/L and 2 mg/L prescribed by BIS, 2012 and WHO, 2011 respectively.
Iron
Iron is one of most abundant metal in earths crust, found in natural water and is essential element in human nutrition. The mean value of iron in the water of river Beas in study area was 0.30±0.18 mg/L, which was at par with acceptable limit of 0.3 mg/L prescribed by BIS, 2012. However WHO, 2011 has not proposed any guideline value for drinking water as daily requirement of human is 10-50 mg/day.
Lead
The lead is used as anti knocking and lubricatingagent in vehicle fuels, paints, acid batteries, solder and alloys. The mean value of lead in water of river Beas was 0.03±0.01 mg/L, which was higher than the acceptable limit of 0.01mg/L prescribed by BIS, 2012 and WHO, 2011. The contamination of river water may have been due to emissions from vehicular traffic along the river Beas and weathering of galena rocks in the study area18.
Chloride
The mean value of chloride in water of study area of river Beas was 34.10±35.24 mg /L, which was within the acceptable limit of 250 mg/L prescribed by BIS, 2012. The mineral deposits, sewage water, human excreta, domestic and industrial waste are the various sources which contribute chloride in water. The highest mean value of 96 mg/L was found at SS-4 and may have been due to confluence of river Beas with Looni river, draining the Gumma and Darang area of district Mandi having salt deposits. Chloride in drinking water are not detrimental normally to health and WHO, 2011 has not proposed any guideline value for drinking water.
Fluoride
The mean value of fluoride in water of study area of river Beas was 0.54±0.11 mg/L, which was within the acceptable limit of 1 mg/L and 5 mg/L prescribed by BIS, 2012 and WHO, 2011 respectively. The fluorides are essential to drinking water for prevention of dental caries, but higher concentration of fluoride may cause dental fluorosis.
Nitrate
The mean value of nitrate in water of river Beas in the study area was 0.87±0.51 mg /L, which was within the acceptable limit of 45 mg/L prescribed by BIS, 2012 and WHO, 2011 respectively. Basic source of nitrates is nitrogen which is constituent of proteins, chlorophyll and many other biological compounds. Higher concentration of nitrate in drinking water is a health hazard and has carcinogenic impact on the digestive system14.
Biological Oxygen Demand (BOD)
The BOD is measure of oxygen in water that is required by aerobic organisms and is an indicator of organic pollution. The mean value of BOD in water of river Beas in the study area was 0.83±0.62 mg /L. The BIS, 2012 and WHO, 2011 has not proposed any guideline values of BOD for drinking water.
Chemical Oxygen Demand (COD)
The COD is amount of chemical oxidant required for oxidation of organic matter that is present in water. The mean value of COD in water of river Beas in the study area was 3.53±3.09 mg/L. The BIS, 2012 and WHO, 2011 has not proposed any guideline values of COD for drinking water.
Colliform and Escherichia coli
The colliforms are useful indicators of the possible presence of enteric pathogenic bacteria. The colliform and E. coli were found in all sampling stations except SS-1 and SS-2. The BIS, 2012 and WHO, 2011 has prescribed nil presence of colliform and E.coli in drinking water. The present investigation reveals that Colliform and E.coli were present in the water at all the sampling stations except at SS-1 and SS-2. Barring lead, cadmium and turbidity all other physicochemical and biological water quality parameters were within the acceptable limit of BIS, 2012.
Acknowledgments
The authors are thankful to Sh. D.S. Saini, Managing Director, Environtech Laboratory, Mohali, Punjab India for providing necessary facilities to undertake this investigation.
References
- Gleick, P. H. Water in crisis: A guide to world’s fresh water resources, Oxford University Press, New York.1-473(1993).
- Smith J. C. and Gleick H. A 21st Century U.S. Policy. Oxford University Press, New York(2012)
- Maity, D. K. Hydrological and 1D Hydrodynamic Modeling in Manali Sub Basin of River Beas, Himachal Pradesh ,India (2009)
- Usha Moza and Mishra, D. N. River Beas Ecology and Fishery,Central Inland Fisheries Research Institute,Bull.150(2007)
- Ashu, A. and Parveen, T. Water Quality Assesment of Three Tributaries of Beas Drainage System in Himachal Pradesh in Upper Reaches of Himalayan Region. Biological Forum-An International J. 2(1) 63-66(2010)
- Shivayogimath C. B., Kalburgi P. B., Deshannavar U. B. and Virupakshiah D. B. M. Water Quality Evaluation of River Ghataprabha, India, Res. J. Environment Sci. vol. 1 (1), 12-18(2012)
- CPCB (Central Pollution Control Board).Status of water Quality in India, MINARAS /35 (2013-14)
- Kumar A., Bisht S., Joshi V. D., Singh A. K. and Talwar A. Physical, Chemical and Bacterilogical Study of Waters from Rivers Of Uttarakhand. J. Hum. Ecol,32(3):169-173(2010)
CrossRef - FWPCA: Federal Water Pollution Control Administration (1968) Water Quality Criteria: Report of National Technical Advisory Committee to the Secretary Interior. U. S. Costal Cities FWPCA , 32-34(1968)
- Thomas C. W., Harvey J. W., Franke O. L., and Alley W. M. Ground Water and Surface water, Single Resource, USGS Circular,1139(1998)
- APHA/AWWA/WEF. Standard Methods For the Examination of Water and Waste Water, American Public Health Association, 22nd Washington D.C. (2012)
- BIS, (Bureau of Indian Standards). Methods of Sampling and Test (Physical and Chemical) for Water and Waste Water. IS:3025 (1987)
- BIS, (Bureau of Indian Standards). Indian Standards, Drinking water Specification (2nd Revision) IS 10500 (2012)
- GSI, (Geological Survey of India). Geology and Mineral Resources of Himachal Pradesh. Miscellaneous Publication No. 30: Part-XVII (2nd Revision Edition), Govt. of India (2012)
- WHO, (World Health Organization). Guidelines for Drinking Water Quality. 4th Edition, Geneva. (2011)
- Balpande, U.S. Ground Water Information Booklet Mandi District, Himachal Pradesh, Central Ground Water Board, Govt. of India. (2007)
- Kumar, A., Rawat, S., Shrivastava, M. and Bhushan, V., Physico-Chemical Analysis and Isolation of Bacteria from Water Samples of Maharana Pratap Sagar, Kangra District of Himachal Pradesh.(2012)
- Das B. K. and Kaur P. Major ion chemistry of Renuka Lake and weathering processes, Sirmaur District, Himachal Pradesh, India. Environmental Geology (USA), 40, 908-917(2001)
CrossRef


