An Approach for Power Generation with Reduced Fuel Consumption Using PTO Driven Generator
Manish Patel1 and H. Raheman1 *
http://dx.doi.org/10.12944/CWE.11.2.24
Using the gear up throttle down concept, suitable power take off (PTO) speed required to run a PTO powered generator was decided. For this PTO test was carried out using an eddy current dynamometer. The tractor engine was loaded to different torque values at different engine speeds for obtaining constant PTO power corresponding to the full load of the generator. Fuel consumption, smoke level, exhaust gas temperature and coolant temperature were measured during PTO test. Engine speed fluctuation and engine overloading were also observed to judge whether the engine was running smoothly, or it was overloaded. The specific fuel consumption was reduced from 268.9 g/kW h at 1579 rpm to 242.9 g/kW h at 1000 rpm. Considering the engine speed fluctuation, overloading of the engine, rapid rise of smoke level, exhaust gas temperature and coolant temperature, an engine speed of 1215 rpm was recommended instead of 1579 rpm (corresponding to standard PTO speed of 540 rpm). A suitable power transmission system comprising belt and pulley drive was designed to run the generator at rated speed of 1500 rpm. When the generator was operated at reduced PTO speed of 415 rpm (corresponding to engine speed of 1215 rpm) in comparison to standard PTO speed of 540 rpm, fuel saving of 0.35 l/h to 0.55 l/h and 0.43 l/h to 0.48 l/h was achieved at different alternating current (AC) and direct current (DC) loads on the generator, respectively. Following this approach, a considerable amount of fuel energy could be saved while generating electric power using tractor. Efficient use of fuel will reduce the overall production cost of agricultural products as well as help in protecting our environment.
Copy the following to cite this article:
Patel M, Raheman H. An Approach for Power Generation with Reduced Fuel Consumption Using PTO Driven Generator. Curr World Environ 2016;11(2) DOI:http://dx.doi.org/10.12944/CWE.11.2.24
Copy the following to cite this URL:
Patel M, Raheman H. An Approach for Power Generation with Reduced Fuel Consumption Using PTO Driven Generator. Curr World Environ 2016;11(2). Available from: http://www.cwejournal.org/?p=15336
Download article (pdf) Citation Manager Publish History
Introduction
With the increased cropping intensity, farmers of developing countries have supplemented animate power (human and draft animal) with tractors, power tillers, diesel engines and electric motors. Electric power plays a pivotal role in various agricultural operations. Besides providing irrigation to the crops, electric power is also used for threshing, chaff cutting, hulling, cane crushing, running small oil extractors, etc. With the increased mechanization methods and use of improved irrigation facilities, the demand for electricity has increased; on the contrary, the availability of electricity in farms of developing countries has shown a decreasing trend that has caused the stress on irrigation practices in recent years. The poor quality and erratic power supply have aggravated the problem; thus, there is increased need for an alternative to grid power. The tractors available in Indian farms are mostly used for agricultural operations like tillage, sowing, inter-culture, harvesting, threshing, etc. Tractors are mostly kept idle after the completion of sowing operation. Hence to improve the working period of tractors, PTO driven generators are gaining popularity for generating electricity during the periods of nonavailability and poor quality of grid power. But due to increase in the price of diesel, cost of producing power is increased. So, there is a need for fuel efficient power generating system, using the tractor as a power unit.
A tractor is a versatile machine that is used for carrying out variety of agricultural activities requiring low power to high power. The farmers cannot purchase different power units for these varieties of activities. The farmer usually selects tractor on the basis of highest power required in farm operations (i.e. primary tillage operations). Due to widely differing power requirement of various operations, the selected tractor becomes bigger for carrying out farming operations other than primary tillage. For maximum operating efficiency, a tractor should be operated near its rated capacity, but many field operations do not require full tractor power. For these lighter operations, a considerable amount of fuel could be saved by shifting to higher gears while reducing the throttle position.1 Some agricultural machines, which require very low power at standard PTO speed (540 rpm), there is a wastage of fuel when operated at high engine speeds. In other words; it is an uneconomical operation.2 A majority of the farmers are operating their PTO driven generator at higher engine speed, resulting in higher specific fuel consumption leading to higher operating cost. Past studies indicate that savings up to 20% on fuel consumption of tractor could be obtained with gear up throttle down concept.3,4,5 The engine could be run at lower speed for minimum specific fuel consumption by reducing the throttle position. Moreover, the rated speed of generator could be maintained to ensure the performance of generator by adopting suitable belt and pulley drive in-between tractor PTO shaft and generator shaft.
Overloading the engine will result in higher torque at a lower engine speed than it is designed for.1 The extent to which farmers are currently practicing "gear up and throttle down" is not known, but it is believed that resistance to adopt this practice arises from fears of engine overloading.4 Hence, for getting lesser fuel consumption, there is a need to determine the critical speed of an engine to avoid the chance of overloading for operating a given generator at full load. Therefore, the primary objective of the present study was to determine the engine speed of a tractor without overloading it for power generation with reduced specific fuel consumption.
Materials and Methods
Selection of Engine Speed
A 26 kW three cylinder four stroke tractor with a rated speed of 2100 rpm was selected for the study to run a 10 kVA generator. The specifications of generator and tractor are given in Table 1. PTO power required to operate the generator at full load (to draw the maximum electric current) was 10.86 kW. The power needed for operating the generator was lower than the available power of the tractor. The general practice is to operate the generator at the standard PTO speed (540 rpm) to maintain the rated speed of the generator. In the present case, the required power can be supplied at a lower engine speed that will provide considerable fuel saving during operation of the generator. It was assumed that the engine could provide power for any part load conditions, if the engine could provide power without overloading at full load of generator. Hence, selection of engine speed was based on full load of the generator.
Engine Torque at different Speeds
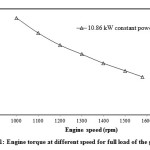
At full load of the generator, the torque requirement at generator shaft is constant, and the generator has to run only at its rated speed to maintain the constant voltage and frequency. Hence, constant shaft power was required to generate the electric current corresponding to the full load. For fuel saving, the engine should be operated at a lower speed but it will cause the corresponding reduction of PTO speed, due to this rated speed of generator will not be maintained which is undesirable for power generation. An engine can be run at lower speed without affecting the generator’s rated speed by changing the pulley ratio that is required with standard PTO speed. So, by providing speed up in belt transmission, the rated speed of the generator could be maintained at a reduced engine speed but it demands higher values of torque at the PTO shaft as required power is constant. Thus, the engine has to supply higher torque towards the lower engine speed for meeting full load of the generator. The equivalent crankshaft torque values at different engine speeds for the constant PTO power corresponding to the full load of generator were calculated by using Eq. (1) and these torque values were plotted against the engine speed as shown in Fig. 1.
Table 1: Specifications of generator and tractor
|
Parameters |
Values |
|
Generator |
|
|
Number of poles |
4 |
|
Rated speed |
1500 rpm |
|
Power rating of three phase AC |
10 kVA, 13.9 A, 405 V, 50 Hz |
|
DC supply |
200 A |
|
Tractor |
|
|
Rated PTO power |
26 kW |
|
Rated engine speed |
2100 rpm |
|
High idle speed |
2300 rpm |
|
Low idle speed |
800 rpm |
|
Maximum engine torque |
138 N-m |
|
Engine speed at maximum torque |
1300 rpm |
|
PTO ratio |
2.924 |
|
Engine speed at 540 rpm of PTO |
1579 rpm |
|
Engine power at 540 rpm of PTO |
22 kW |

where T is the equivalent crankshaft torque (N-m), N is the engine speed (rpm) and Ppto is the PTO power (kW).
 |
|
Engine manufacturer declared the low idle speed for the tractor engine as 800 rpm. Therefore, engine speed of 1000 rpm was selected as minimum speed and tested up to 1579 rpm (corresponding to a standard PTO speed of 540 rpm) with an interval of 100 rpm to fulfill research objective. Figure 1 shows that an engine has to supply higher torque towards lower engine speed.
Power take off Test
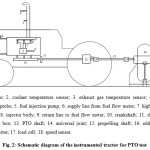
Part load part throttle (PLPT) PTO test was done for the selected tractor as per regulations of Bureau of Indian Standards (BIS) to determine engine performance for operating the generator.6 During test, different torque values were applied to the engine through PTO shaft at their respective speeds with the help of eddy current dynamometer (Fig.1). The schematic diagram of instrumented tractor used for PTO test is shown in Fig. 2.
 |
|
Speed and torque of PTO, fuel consumption, smoke level, exhaust gas temperature and coolant temperature were recorded during the test. Engine speed fluctuation and engine overloading were also observed to judge whether the engine was running smoothly, or it was overloaded. To observe the engine overloading, response to throttle opening was checked at each test point and recorded as a slow or fast response. If the gain in engine speed at full throttle opening was slow, it was concluded that engine was overloaded and optimally loaded when speed gain was fast. AVL fuel flow meter and AVL smoke meter were used for measuring the fuel consumption and smoke level, respectively. PT100 temperature sensors were used for measuring the exhaust gas and coolant temperature.
Limiting values of Filter Smoke Number (FSN)
The FSN value of exhaust gas was measured during the PTO test at each test point and these values were compared with the limiting values of smoke level. Limiting values of smoke level were calculated by engine displacement volume and its operating speed as per the regulations of BIS7. The limiting value of allowable smoke level is based on the nominal gas flow that is given by the Eq. (2).
G = (V x N)/120 (2)
where G is the nominal gas flow for naturally aspirated four stroke engine (l/s), V is the total cylinder swept volume (l) and N is the engine speed (rpm).
The total cylinder swept volume of the tractor engine was 2.94 l. Now, using Eq. (2), the nominal gas flow was calculated corresponding to 1000 to 1579 rpm of the tractor engine. With the help of correlation between the nominal gas flow and Hartridge smoke unit (HSU), the HSU values were determined and then corresponding values of FSN were obtained. The limiting values of FSN at different engine speed are given in Table 2.
Table 2: Limiting values of FSN at different engine speed
|
Engine speed (rpm) |
Nominal gas flow (l/s) |
Limiting HSU |
Limiting FSN |
|
1000 |
25 |
57.5 |
4.29 |
|
1100 |
27 |
57.5 |
4.29 |
|
1200 |
29 |
57.5 |
4.29 |
|
1300 |
32 |
57.5 |
4.29 |
|
1400 |
34 |
57.5 |
4.29 |
|
1500 |
37 |
57.5 |
4.29 |
|
1579 |
39 |
57.5 |
4.29 |
Field Experiment
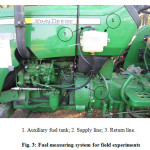
Field experiments were conducted for evaluating the performance of PTO driven generator. Fuel measurement was done in actual working conditions for determining the fuel saving in AC loading as well as in DC welding. Digital noncontact type tachometer was used to measure the engine speed during the field experiments. A fuel measuring system was developed to measure fuel consumption of the tractor engine during operation of the generator. An auxiliary transparent plastic tank was mounted on the tractor. Fuel supply line and return line from the main fuel tank were disconnected, and new fuel lines were connected to the auxiliary tank to supply the fuel and also to accommodate the fuel returned as shown in Fig. 3. Fuel consumption was calculated using Eq. (3).
F = (Ff / t) x 60 (3)
where F is the fuel consumption (l/h), Ff is the amount of fuel required to fill up to marked level (l) and t is the time of the experiment (min).
 |
|
Measurement of voltage and frequency was done to ensure the rated frequency and voltage during the test. Electric current was measured to determine the percentage of loading on the generator. Voltage and frequency were measured with a digital multimeter, and the current was measured with a clamp meter. A research plan for the field experiments of PTO driven generator for measuring the fuel consumption at different loads of AC output and DC welding is given in Table 3. The duty cycle for welding was considered for easy comparison of fuel consumption at two pulley ratios. Duty cycle for different welding electrode is summarized in Table 4.
Table 3: Research plan for the field experiments
|
Independent parameter |
Level |
|
AC load |
33, 50, 65 and 95% |
|
DC load |
45, 65 and 95% |
|
Pulley ratio |
2.75 and 3.6 |
|
Replications |
3 |
|
Dependent parameters |
|
|
Fuel consumption, l/h |
|
|
Voltage, V |
|
|
Current, A |
|
|
Frequency, Hz |
Table 4: Duty cycle for different welding electrode
|
Current rating of electrode (A) |
Duty cycle (%) |
Welding cycle duration (min) |
Actual welding time (min) |
Idle time (min) |
|
90 |
80 |
5 |
4 |
1 |
|
130 |
60 |
5 |
3 |
2 |
|
190 |
40 |
5 |
2 |
3 |
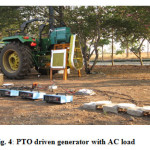
The tractor was parked on a level ground, and the generator was connected to PTO using the propelling shaft. AC load (heating coils) was connected to the generator as shown in Fig. 4, and this load was uniformly distributed over the three phase supply of generator. For a pulley ratio of 3.6, the engine was running at 1215 rpm for maintaining the rated speed of generator as 1500 rpm. The generator was loaded to 33% of its maximum load that tried to reduce engine speed. However, to maintain rated speed of generator, throttle position was increased. Engine speed, voltage, frequency and current were measured, and fuel consumption for 15 min was also measured by tank fill method. These tests were repeated for 50%, 65% and 95% loads with three replications on each load. The same procedure was adopted for testing with pulley ratio of 2.75, where the engine was run at 1590 rpm for maintaining the rated speed of generator.
 |
|
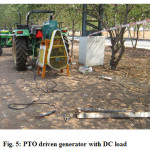
In case of DC load, the welding unit was connected to the generator as shown in Fig. 5. For a pulley ratio of 3.6, the engine was run at 1215 rpm for maintaining the rated speed of the generator. Then welding was done for three cycles (Table 4). Total fuel consumption during three cycles for each welding electrode was measured by tank fill method, and three replications were taken with each welding electrode. The same procedure was adopted for testing with a pulley ratio of 2.75, where the engine was run at 1590 rpm for maintaining the rated speed of the generator.
 |
|
Results and Discussion
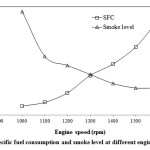
The engine was tested in the speed range of 1000 to 1579 rpm in part load part throttle PTO test. For selecting the engine speed for power generation, the engine was loaded to the torque points given in Fig. 1, and the results of part load part throttle test are shown in Figs. 6 and 7. When the engine was running at a speed corresponding to standard PTO speed, higher specific fuel consumption was obtained, and it reduced considerably by running the engine at lower speeds. This reduction in fuel consumption was due to the reduced frictional losses of the engine at the lower speed range. The specific fuel consumption was reduced from 268.9 g/kW h at 1579 rpm to 242.9 g/kW h at 1000 rpm as shown in Fig. 6.
On the other hand, smoke level, exhaust gas temperature and coolant temperature were found to be increased when the engine was run towards the lower engine speeds. The smoke level increased with reduction in engine speed, since the percent decrease in air consumption rate for combustion of fuel is more than the percent decrease in fuel consumption rate. Due to that, in certain areas within cylinder, the air fuel ratio would be so rich that some of the carbon and oxygen particles will be unable to combine for combustion. These uncombined carbon particles are the cause of higher smoke level. The smoke level increased from 0.6 FSN at 1579 rpm to 2.3 FSN at 1000 rpm as shown in Fig. 6. The limiting value of the smoke level is 4.29 FSN as given in Table 2, for all test speeds. The results of the smoke level showed that the value of FSN was not exceeded in any of the test speed beyond limiting value.
 |
|
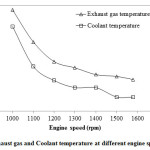
The exhaust gas temperature and coolant temperature were higher towards the lower engine speed as there was more time per cycle available for heat transfer from the engine, which resulted in increased heat losses. The exhaust gas temperature was increased from 249.5 °C to 306.1°C and the coolant temperature was increased from 81.1°C to 84.1°C with reducing the engine speed from 1579 rpm to 1000 rpm, respectively (Fig. 7). The rate of increase of smoke level, exhaust gas temperature and coolant temperature were higher below 1200 rpm indicating overloading of the engine.
 |
|
The engine was also checked for the speed fluctuation and overloading. During the test, it was observed that up to 1200 rpm, the engine was able to develop the required power without any speed fluctuation. However, speed fluctuation was observed below 1200 rpm, which is undesirable for the operation of generator. The engine was checked for overloading at each test point, this was done by fully opening the throttle after loading the engine and the response of engine speed gain was noticed. It was observed that up to 1200 rpm engine responded well to the sudden opening of the throttle to full but below that speed, engine response was slow which indicated engine overloading. Although the fuel consumption advantage of low engine speed continued up to 1000 rpm, but the engine was overloaded. Hence, the engine speed of 1200 rpm was selected as the critical speed for power generation with the given PTO driven generator.
After determining the critical engine speed, suitable V- belt drive was designed as per the regulations of BIS8,9 with a pulley ratio of 3.6 for transmitting the PTO power to the generator to maintain the rated speed of generator as 1500 rpm. The final engine speed was
 |
|
 |
|
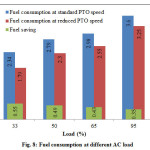
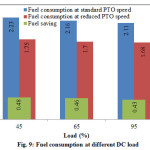
1215 rpm to get the rated speed of generator and the specific fuel consumption at this speed was 248.06 g/kW h. Fuel consumption at different AC and DC loads for both standard PTO speed of operation as well as for reduced PTO speed of operation are graphically presented in Figs. 8 and 9. Fuel saving of 0.35 l/h to 0.55 l/h at different AC loads and 0.43 l/h to 0.48 l/h at different DC loads of generator could be achieved in comparison to standard PTO speed operation by using the gear up throttle down concept.
Conclusions
Considering the engine speed fluctuation, overloading of the engine, and rapid increase of smoke level, exhaust gas temperature and coolant temperature, the engine speed of 1200 rpm was selected as critical speed for operating the generator at full load to obtain reduced specific fuel consumption. A suitable belt and pulley drive was designed, and pulley ratio of 3.6 was selected which required 1215 rpm of the engine to run the generator at rated speed with reduced PTO speed. The fuel saving of 0.35 l/h to 0.55 l/h and 0.43 l/h to 0.48 l/h could be achieved at different AC and DC loads on the generator, respectively in comparison to standard PTO speed operation.
Overall, the study supported a conclusion that PTO driven generators should be operated below the standard PTO speed by adopting suitable transmission ratio outside the tractor unit for getting lesser fuel consumption without affecting the performance of generator. Otherwise, tractor manufacturers should provide multiple gear ratios in PTO; so that standard PTO speed could be achieved at different engine speeds. Low power required PTO driven machines used for stationary farm operations could be operated by running the engine at lower speeds for saving of fuel energy without affecting the machine performance.
References
- Grisso, R. and Pitman, R. Gear up and throttle down–saving fuel.Virginia Cooperative Extension Publication, Virginia, 442–50 (2001).
- Sumer, S. K., Kocabiyik, H., Say, S. M. and Cicek, G. Comparisons of 540 and 540E PTO operations in tractors through laboratory tests. Bulgarian Journal of Agricultural Science, 16(4):526–33 (2010).
- Chancellor, W. J. and Thai, N. C. Automatic control of tractor engine speed and transmission ratio. Transactions of the ASAE, 27(3):642–6 (1984).
CrossRef - Schrock, M., Matteson, D., Blumanhourst, M. and Thompson, J. A device for aiding gear selection in agricultural tractors. Transactions of the ASAE, 29(5):1232–6 (1986).
CrossRef - Gorgan, J., Morris, D. A., Searcy, S. W. and Ston, B. A. Microcomputer based tractor performance monitoring and optimization system. J. Agric. Eng. Res., 38(4):227–47 (1987).
CrossRef - IS 12036. Agricultural tractors–test procedures–power tests for power take–off. Bureau of Indian Standards, New Delhi (1995).
- IS 10000 (Part X). Methods of tests for internal combustion engines. Part X tests for smoke levels, limits and corrections for smoke levels for variable speed compression ignition engines. Bureau of Indian Standards, New Delhi (1980).
- IS 2494 (Part 1). V–belts – endless V–belts for industrial purposes. Part 1 general purpose – specification. Bureau of Indian Standards, New Delhi (1994).
- IS 3142. Pulleys–V–grooved pulleys for endless V–belts sections Z, A, B, C, D and E and endless wedge belts sections SPZ, SPA, SPB and SPC–specification. Bureau of Indian Standards, New Delhi (1993).


