Assessment of the Water Quality of Hussain Sagar, Fox Sagar and Kattamysamma Lakes of Hyderabad, Telangana State, India: Using Water Quality Index (WQI)
Manchala Lingaswamy 1 * and Praveen Raj Saxena2
http://dx.doi.org/10.12944/CWE.11.2.23
The present study was carried out to assess the water quality of three lakes of Hyderabad, Telangana State, India viz., Hussain Sagar, Fox Sagar and Kattamysamma Lake by using water quality index (WQI). For this study systematic sampling has been carried out by collecting sixteen samples from each lake. The collected samples were analyzed for physico-chemical parameters like pH, Electrical Conductivity (EC), Total Dissolved Solids (TDS), Total Hardness (TH), Total Alkalinity (TA), Sodium (Na+), Potassium (K+), Calcium (Ca2+), Magnesium (Mg2+), Nitrates (NO32-), Sulphates (SO42-), Fluoride (F-) and Chloride (Cl-) according to Standard Methods for the Examination of Water and Wastewater (APHA 2005) and Central Pollution Control Board (CPCB) guide manual: Water and Waste water analysis. The results were compared with water quality guidelines for drinking purpose (BIS 2012). The mean values of most water quality parameters were significantly higher than the accept limits in all three lakes.
Ten important water variables were chosen to calculate Water Quality Index (WQI). All the three lakes fall under unsuitable for drinking purpose (>100) according to WQI scale.
Copy the following to cite this article:
Lingaswamy M, Saxena P. R. Assessment of the Water Quality of Hussain Sagar, Fox Sagar and Kattamysamma Lakes of Hyderabad, Telangana State, India: Using Water Quality Index (WQI). Curr World Environ 2016;11(2) DOI:http://dx.doi.org/10.12944/CWE.11.2.23
Copy the following to cite this URL:
Lingaswamy M, Saxena P. R. Assessment of the Water Quality of Hussain Sagar, Fox Sagar and Kattamysamma Lakes of Hyderabad, Telangana State, India: Using Water Quality Index (WQI). Curr World Environ 2016;11(2). Available from: http://www.cwejournal.org?p=934/
Download article (pdf) Citation Manager Publish History
Introduction
Water - the main source of life and one of the most important natural resource of the ecosystem.1 Lakes are the major sources of drinking and domestic usage for rural and urban population of India. A lake is a watershed area in which its quality depends upon every component of that ecosystem. The health of lakes and their biological diversity are directly related to health of almost every component of the ecosystem.2 Topography of the surrounding area, soil, geology and vegetation determine the kind of materials entering into lake which indicates the water quality.3 In present scenario, the contamination and degradation of lake ecosystems has increased manifold due to various anthropogenic activities like urbanization, industrialization, discharge of domestic sewage, untreated industrial effluents, idol immersion and encroachment of Lake Watershed area. The effects of water pollution are not only devastating to people but also to animals, fish and birds4 and causing serious disturbance to the biodiversity of the lake environment.
Water quality assessment has become a critical issue in the last decades. 5, 6, 7, 8, 9, 10, 11, 12 Therefore regular monitoring of the lake water in terms of quality assessment is mandatory to control the pollution to earliest either experimentally or through mathematical modeling. Water quality index is one of the most effective tools to communicate information on the quality of any water body.13 It is basically a dimensionless number that combines multiple water-quality factors into a single number by normalizing values to subjective rating curves. It is a widely used communication tool which summarizes water quality data in an effective and understandable way for to the general public.14
The present study was undertaken to enumerate water quality of the three lakes viz., Hussain Sagar, Fox Sagar and Kattamysamma lake of Hyderabad city using mathematical aggregation of water quality index (WQI) as an indicator of the environmental quality and to classify based on the Indian standards. There is no previous classification study based on the WQI scores on these Lakes.
 |
|
Materials and Methodology
Sample Collection
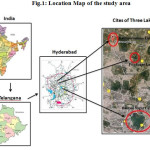
Three different lakes such as Hussain Sagar Lake, Fox Sagar Lake and Kattamysamma Lake in Hyderabad, Telangana State, India were selected for study (Figure.1). Hussain Sagar Lake is located 17°25’22”N, 78°28’28”E at an elevation 510 m in the heart of twin cities of Hyderabad and Secunderabad. It is, built during 1550-1580 AD.15 It is 3.2 km long and 2.8 km wide; its depth ranging from 2.5 to 12.5 m with a surface area of 446 hectares. Fox Sagar Lake local name is Jeedimetla cheruvu or Kolla Cheruvu is the fifth largest lake in India spreading about 2 km.2 Situated (17°30’–17°20’N and 78°30’–78°20’E) 1 km west of Hyderabad-Nizamabad road at Jeedimetla near Kompally in Hyderabad.1,16 Kattamysamma Lake is also known as Gandimysamma Lake is situated between 17°33’–17°42’N and 78°26’–78°20’E near Medak highway in Sooraram, Hyderabad. Systematic sampling (sixteen samples from each lake which covers entire lake) was carried during monsoon season (September-October) in the year 2014.
Study of Physico-Chemical parameters
The physico-chemical parameters were analyzed as per the Standard Methods for Examination of Water and Wastewater17 and Guide manual: Water and Waste water analysis.18 In situ measures such as pH, EC of the water samples were determined on the spot using pH meter and conductivity meter respectively. The laboratory analyses such as cations Calcium (Ca2+) and Magnesium (Mg2+) were analyzed by complexometric titration method using ethylene diamine tetra acetic acid (EDTA). Sodium (Na+) and Potassium (K+) were analyzed using flame photometry. The anions Carbonate (CO32-) and Bicarbonate (HCO3-) were analyzed by acid-base volumetric titration using sulfuric acid (H2SO4) and the chloride ions (Cl−) were analyzed by argent-metric titration using silver nitrate (AgNO3). Nitrates (NO32-) and Fluoride (F-) were analyzed by using nitrate and fluoride ion selective electrodes respectively. Sulphates (SO42-) analyzed by using UV-Visible spectrophotometer.
Calculation of Water Quality Index (WQI)
In the present study, for the calculation of WQI, ten physico-chemical parameters viz., pH, TDS, TH, TA, Ca2+, Mg2+, NO32-, SO42-, F- and Cl- were chosen. The WQI has been calculated by using water quality guidelines for drinking purpose.19 The Weight Arithmetic Water Quality Index method has been used for calculation WQI of three lakes.
The overall WQI is determined by using Eq. (1)
WQI= a0 WiQi / a0Wi
The unit weight (Wi) for each water quality parameter is calculated by using the following expression:
Wi = K/ Si
Where, K is proportionality constant and is determined by using the following formula:
K=1/a0 [1/Si]
Si is the standard permissible value of the i th parameter.
The quality rating (Qi) of Eq. (1) is calculated as under:
Qi = 100 [(Vi- V0/ Si-V0)]
Where, Vi is estimated concentration of the i th parameter in the analyzed water and V0 is the ideal value of this parameter in pure water. All ideal values are taken as zero for drinking water, except pH = 7.0.
Results and Discussion
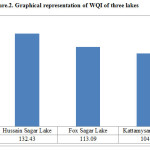
In this study, WQI for three lakes was evaluated to assess the water quality of these lakes. The results of various physicochemical parameters and their standard values (BIS 2012) were presented in Table.1. WQI for Hussain Sagar, Fox Sagar and Kattamysamma Lakes were presented in Table.2, Table.3 and Table.4 respectively. WQI and status of Water quality were presented in Table.5. The graphical representation of WQI for three lakes is shown in Figure.2.
TDS, TH, TA, F-, Cl- values in all the three lakes, Ca2+ in Hussain Sagar and Kattamysamma lakes, Mg2+ in Fox Sagar and Nitrates in the Hussain Sagar were found to be exceeding the acceptable limit.19
The WQI values of Hussain Sagar, Fox Sagar and Kattamysamma Lakes were 132.43, 113.09, and 104.29 respectively. The highest value of WQI was observed in Hussain Sagar while lowest value was observed in Kattamysamma Lake. WQI of all three lakes, falling under E grade and unsuitable for drinking purpose category (WQI > 100) (Table.5).
Discharge of untreated municipal sewage, industrial waste water into these lakes and religious activities like immersion of Gods and Goddess idols made by Plaster of Paris (POP) are responsible for the contamination of these three lakes.
Table 1: Physico-Chemical parameters of three lakes and comparison with standard values
|
S.No |
Parameters |
Hussain Sagar Lake |
Fox Sagar Lake |
Kattamysamma Lake |
BIS (2012) |
|
1 |
pH |
8.0 |
7.7 |
7.5 |
6.5-8.5 |
|
2 |
EC |
1506 |
1313 |
1421 |
1500 |
|
3 |
TDS |
964 |
840 |
1266 |
500 |
|
4 |
TH |
214 |
281 |
402 |
200 |
|
5 |
TA |
467 |
342 |
347 |
200 |
|
6 |
Na+ |
96 |
165 |
131 |
200 |
|
7 |
K+ |
18 |
13 |
15 |
- |
|
8 |
Ca2+ |
134 |
53 |
129 |
75 |
|
9 |
Mg2+ |
20 |
36 |
20 |
30 |
|
10 |
NO3- |
72 |
14 |
28 |
45 |
|
11 |
SO4-2 |
77 |
39 |
123 |
200 |
|
12 |
F- |
1.7 |
1.9 |
1.02 |
1 |
|
13 |
Cl- |
270 |
600 |
268 |
250 |
Table 2: Calculation of Water Quality Index (WQI) for Hussain Sagar lake
|
S.No |
Parameters |
Observed Value (Vi) |
Standard Value (Si) |
Allocated Value (wi) |
Unit Weight (Wi) |
Quality rating (Qi) |
WiQi |
|
1 |
pH |
8 |
6.5-8.5 |
4 |
0.1212 |
66.67 |
8.08 |
|
2 |
TDS |
964 |
500 |
4 |
0.1212 |
192.80 |
23.37 |
|
3 |
TA |
467 |
200 |
3 |
0.0909 |
233.50 |
21.23 |
|
4 |
TH |
214 |
200 |
2 |
0.0606 |
107.00 |
6.48 |
|
5 |
Ca2+ |
134 |
75 |
2 |
0.0606 |
178.67 |
10.83 |
|
6 |
Mg2+ |
20 |
30 |
2 |
0.0606 |
66.67 |
4.04 |
|
7 |
NO32- |
72 |
45 |
5 |
0.1515 |
160.00 |
24.24 |
|
8 |
SO42- |
77 |
250 |
4 |
0.1212 |
30.80 |
3.73 |
|
9 |
F- |
1.7 |
1 |
4 |
0.1212 |
170.00 |
20.61 |
|
10 |
Cl- |
270 |
250 |
3 |
0.0909 |
108.00 |
9.82 |
|
|
Σwi=33 |
ΣWi=1 |
ΣQi=1314.1 |
ΣWiQi=132.43 |
|||
|
WQI=ΣWiQi/ΣWi=132.43 |
|||||||
Table 3: Calculation of Water Quality Index (WQI) for Fox Sagar Lake
|
S.No |
Parameters |
Observed Value (Vi) |
Standard Value (Si) |
Allocated Value (wi) |
Unit Weight (Wi) |
Quality rating (Qi) |
WiQi |
|
1 |
pH |
7.7 |
6.5-8.5 |
4 |
0.1212 |
46.67 |
5.66 |
|
2 |
TDS |
840 |
500 |
4 |
0.1212 |
168 |
20.36 |
|
3 |
TA |
342 |
200 |
3 |
0.0909 |
171 |
15.55 |
|
4 |
TH |
281 |
200 |
2 |
0.0606 |
140.5 |
8.52 |
|
5 |
Ca2+ |
53 |
75 |
2 |
0.0606 |
70.67 |
4.28 |
|
6 |
Mg2+ |
36 |
30 |
2 |
0.0606 |
120 |
7.27 |
|
7 |
NO32- |
14 |
45 |
5 |
0.1515 |
31.11 |
4.71 |
|
8 |
SO42- |
39 |
250 |
4 |
0.1212 |
15.6 |
1.89 |
|
9 |
F- |
1.9 |
1 |
4 |
0.1212 |
190 |
23.03 |
|
10 |
Cl- |
600 |
250 |
3 |
0.0909 |
240 |
21.82 |
|
|
Σwi=33 |
ΣWi=1 |
ΣQi =1193.54 |
ΣWiQi =113.09 |
|||
|
WQI=ΣWiQi/ΣWi=113.09 |
|||||||
Table 4: Calculation of Water Quality Index (WQI) for Kattamysamma Lake
|
S.No |
Parameters |
Observed Value (Vi) |
Standard Value (Si) |
Allocated Value (wi) |
Unit Weight (Wi) |
Quality rating (Qi) |
WiQi |
|
1 |
pH |
7.5 |
6.5-8.5 |
4 |
0.1212 |
33.33 |
4.04 |
|
2 |
TDS |
910 |
500 |
4 |
0.1212 |
182 |
22.06 |
|
3 |
TA |
347 |
200 |
3 |
0.0909 |
173.5 |
15.77 |
|
4 |
TH |
345 |
200 |
2 |
0.0606 |
172.5 |
10.45 |
|
5 |
Ca2+ |
129 |
75 |
2 |
0.0606 |
172 |
10.42 |
|
6 |
Mg2+ |
20 |
30 |
2 |
0.0606 |
66.67 |
4.04 |
|
7 |
NO32- |
28 |
45 |
5 |
0.1515 |
62.22 |
9.43 |
|
8 |
SO42- |
123 |
250 |
4 |
0.1212 |
49.2 |
5.96 |
|
9 |
F- |
1.02 |
1 |
4 |
0.1212 |
102 |
12.36 |
|
10 |
Cl- |
268 |
250 |
3 |
0.0909 |
107.2 |
9.75 |
|
|
Σwi=33 |
ΣWi=1 |
ΣQi =1120.62 |
ΣWiQi =104.29 |
|||
|
WQI=ΣWiQi/ΣWi=104.29 |
|||||||
Table 5: Water Quality Index (WQI) and status of Water quality
|
WQI scale |
Grading |
Water Quality status |
|
0-25 |
A |
Excellent water quality |
|
26-50 |
B |
Good water quality |
|
51-75 |
C |
Poor water quality |
|
76-100 |
D |
Very Poor water quality |
|
>100 |
E |
Unsuitable for drinking purpose |
 |
|
Conclusion
Water quality index proposed in this work use ten parameters to evaluate the water quality of three lakes and this can be used as a useful tool for watershed management and aquatic body monitoring. On the basis of the above discussions, it is concluded that the WQI for all the three lakes were found as unsuitable for drinking purpose.
Acknowledgment
I extend my special thanks to University Grants Commission (UGC), for providing financial assistance through RGNF for doctoral research work. I am thankful to Head of the Department and Dr. M. Ramana Kumar, Dept. of Applied Geochemistry, University College of Science, Osmania University for his enormous support in the laboratory during analysis.
References
- Manchala Lingaswamy., and Praveen Raj Saxena., 2016., Assessment of the Water Quality of Hussain Sagar, Fox Sagar and Kattamysamma Lakes of Hyderabad City, Telangana State, India, using Physico-chemical Parameters. Proceedings of 3rd National Conference on Water, Environment and Society (NCWES - 2016), ISBN: 978-98-5230-124-9, pp. 248-254
- Krishnan, Radha R, Dharmaraj K and Ranjitha Kumari B D, J Environ Biol., 28, 105-108(2007).
- Dong J. D., Zhang Y .Y, Zhang. S, Wang Y.S, Yang. Z.H, Wu M.L. Identification of temporal and spatial variations of water quality in Sanya Bay, China by three-way principal component analysis. Environ Earth Sci 60:1673–1682(2010)
CrossRef - Mathur, Sangeeta Patan, Kriti Sharma, Neelima Nair and Anand Shobhawat, Assessment of Physico-chemical properties of Anasagar Lake of Ajmer (India), Journal of Environmental Research and Development, Vol. 4 No. 3(2010).
- Abbasi T, Abbasi SA (2012) Water quality indices. Elsevier, p, 363
CrossRef - Alexakis D (2011) Assessment of water quality in the Messolonghi-Etoliko and Neochorio region (West Greece) using hydrochemical and statistical analysis methods. Environ Monit Assess 182:397–413
CrossRef - Gamvroula D, Alexakis D, Stamatis G (2013) Diagnosis of groundwater quality and assessment of contamination sources in the Megara basin (Attica, Greece). Arab J Geosci 6(7):2367–2381
CrossRef - Quevauviller P (2007) Water protection against pollution: conceptual framework for a science-policy interface.Environ Sci Pollut Res 14(5):297–307
CrossRef - Tsakiris G, Alexakis D (2014) Karstic spring water quality: the effect of groundwater abstraction from the recharge area. Desal Water Treat 52(13–15):2494–2501
CrossRef - Tsakiris G (2015). The status of the European waters in 2015: a review. Environ Process 2:543–557
CrossRef - Tsakiris G, Spiliotis M, Vangelis H, Tsakiris P (2015) Εvaluation of measures for combating water shortage based on beneficial and constraining criteria. Water Resour Manag 29:505–520
CrossRef - Wu J, Liu W, Zeng H, Ma L, Bai R (2014). Water quantity and quality of six lakes in the arid Xinjiang region, NW China. Environ Process 1(2):115–125
CrossRef - Rizwan R. and Gurdeep S., Assessment of Ground Water Quality Status by Using Water Quality Index Method in Orissa, India, World Applied Sciences Journal, 9(12):1392-1397, (2010).
- Mihaiescu Tania, Mihaiescu Radu, Varban Dan, Varban Rodica, Mihaiescu Mihnea, 2013. Water Quality Assessment of the Nadas River (Romania) In Terms Of Nsf Water Quality Index. Analele Universitaţii din Oradea, Fascicula Protecţia Mediului Vol. XXI.
- Suneela M, Radha Krishna G, Manga Sai V, Bhargav V, Syana Sundra Reddy K, Srinivash DSS, and Srinivash J.S, Water and Sediment Analysis of Hussain Sagar Lake, Hyderabad. Sengupta M and Dalwani R (Editor) proceedings of Taal. The world lake conference 2008, 304-306(2007).
- Lingaswamy. et.al.2015. Water Quality of Fox Sagar Lake, Hyderabad, Telangana State, India, its suitability for Irrigation Purpose, Int. J. Adv. Res. Sci. Technol. Volume 4, Issue8, pp.490-494(2015).
- American Public Health Association (APHA), Standard Methods for the Examination of Water and Waste water (21stEdition) (2005).
- Central Pollution Control Board (CPCB). “Guide manual: Water and Wastewater Analysis”, Ministry of Environment & Forests, Delhi.
- Bureau of Indian Standard (BIS) Indian standard Drinking water Specification (Second Revision), Indian Standard (10500:2012)(2012).


