Projected Change in Climate Under A2 Scenario in Dal Lake Catchment Area of Srinagar City in Jammu and Kashmir
Saqib Parvaze 1 * , Sabah Parvaze 2 , Sheeza Haroon 1 , Noureen Khurshid 1 , J. N Khan 1 and Latief Ahmad 3
1
Division of Agricultural Engineering,
SKUAST- Kashmir,
Shalimar Campus,
190025
Jammu and Kashmir
India
2
Department of Hydrology,
IIT Roorkee,
India
3
Division of Agronomy,
SKUAST- Kashmir,
Shalimar Campus,
190025
Jammu and Kashmir
India
http://dx.doi.org/10.12944/CWE.11.2.11
The present study was done to study the effect of climate change on weather parameters like highest possible temperature, lowest possible temperature, average temperature and precipitation. Multiple linear Regression (MLR), Artificial Neural Network (ANN) and Statistical Downscaling Model (SDSM) models were tested in the Dal lake catchment area of Jammu and Kashmir State. Twenty seven year weather data (1985-2012) obtained from SKUAST-Kashmir weather station was used for the study. The modeling results showed a first-rate agreement between the observed data and predicted values for temperature series with high coefficient of determination R2 values varying from (0.87-0.97) for different models. In case of precipitation R2 values varied from (0.112-219) for different models. The low values of coefficient of determination in precipitation time series are due to lot of uncertainty in occurrence of precipitation which could not be defined by the selected models. The SDSM showed the best results of the three models tested for prediction of weather parameters. Thus SDSM was used for climate scenario generation. By comparing daily precipitation and temperature series for 1985-2012 with 2015-2030, an overall increasing pattern of 0.46%, 1.96%, 0.95% and 2.66% was observed for monthly, highest possible temperature, lowest possible temperature, average temperature and precipitation.
Copy the following to cite this article:
Parvaze S, Parvaze S, Haroon S, Khurshid N, Khan J. N, Ahmad L. Projected Change in Climate Under A2 Scenario in Dal Lake Catchment Area of Srinagar City in Jammu and Kashmir. Curr World Environ 2016;11(2) DOI:http://dx.doi.org/10.12944/CWE.11.2.11
Copy the following to cite this URL:
Parvaze S, Parvaze S, Haroon S, Khurshid N, Khan J. N, Ahmad L. Projected Change in Climate Under A2 Scenario in Dal Lake Catchment Area of Srinagar City in Jammu and Kashmir. Curr World Environ 2016;11(2). Available from: http://www.cwejournal.org/?p=161
Download article (pdf) Citation Manager Publish History
Introduction
For the past century, increase in temperature and CO2 concentration due various factors including change in the pattern of land use4 and greenhouse gas (GHG) emissions from industrial and agricultural sectors,7 have caused changes in the earth’s climate. This increased GHG’s concentration was likely to influence earth’s temperature as well as precipitation along with the pattern of storms as well as changes to sea levels.3,1,6 The visible impacts of the changes in climate of have been already observed in terms of occurrence of extreme events of cold, heat, floods or drought.5
The annual mean and maximum temperatures in India have been reported to have increased by about 0.7 and 0.8oC respectively.2 Many regains in India including the West Coаst, Centrаl Indiа, the Internal Peninsulа and North-Eаst have shown a warming trend in climate.4
In this study, comparison between Multiple Linear Regression (MLR) model of MS-Excel, Artificial Neural Network (ANN) model of MATLAB software and Statistical Downscaling Model (SDSM) was done to determine the best fit model for downscaling the climate chаnge in Dаl Lаke cаtchment of Srinagar City, Jammu & Kashmir, India. The best out of the three was then used to project climate change in the catchment during the period 2015-2030.
Study Area
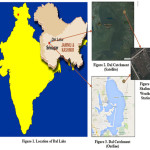
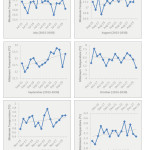
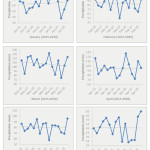
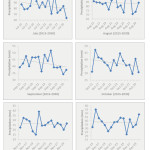
The Dal Lake catchment lies in the Himalayan region of state of Jammu & Kashmir, India between the latitudes 34°02´N and 34°13´ N and longitudes of 74°50´E – 75°09´E. The lake’s catchment has an area of 337 km2 which is nearly 18 times the lake area. The topography of the catchment is uneven with an elevation range of 1580-4380m. Dal Lake is approximately 1580 m above the sea level. The normal annual precipitation in the catchment is 720 mm. Winter season in the area lasts from November to March during which the catchment remains mostly under snow. January is the coldest month with minimum temperatures reeling below the freezing point. The temperature ranges from a maximum of 35 °C in July to a minimum of -7 °C in January. The information regarding the study area and SKUAST-Kashmir weather station is represented from Figures 1-4.
 |
|
Materials and Methods
Measured daily highest possible temperature, lowest possible temperature, average temperature and precipitation data from 1985 to 2011 were selected from the daily observation data from SKUAST-Kashmir station. SDSM predictors were obtained for the same area from the Canadian Climate Impacts Scenarios Group (CCISC) data portal. Predictors were from the available GCM (HadCM3), for the given geographical coordinates of the nearest grid-box to the study area. All of the data files, were then downloaded directly for immediate deployment by MLR, MATLAB & SDSM.
A comparison was first made between the observed data and predictor data obtained from CCISC to check the best fit model amongst MLR, ANN & SDSM using statistical indices like Coefficient of Determination (R2), Mean Square Error (MSE), Root Mean Square Error (RMSE) and Absolute Average Deviation (AAD). After determining the best fit model, that particular model was used for climate scenario generation to predict the climate change for the period 2015-2030.
The term anomaly means a deviation of future climate condition from a baseline period (1985-2011) climate condition. In the present study, the climatic conditions in the baseline period were analyzed which were based on the meteorological station records of the study area. The anomaly of monthly precipitation was calculated as the difference from future monthly average precipitation to the baseline period (1985-2011) monthly average precipitation values. Similarly the anomaly of monthly temperature was calculated.
Results and Discussion
The observed values of daily maximum temperature, minimum temperature, average temperature and precipitation were fitted in the MLR, ANN & SDSM models respectively, which showed a good fit with high values of R2 for each model. The corresponding error values were found to be in the acceptable limit. The accuracy of these models as well as their ability to predict the target values was determined with help of statistical indices like MSE, RMSE, and AAD. The indices from each of these models were then compared to determine the best fit model amongst the three. The comparison between the indices of these models for each of the parameters was given in Table 1.
Table 1: Comparison of indices obtained by MLR, ANN and SDSM
|
Parameter |
Model |
MSE |
RMSE |
R2 |
AAD |
|
Maximum Temperature |
MLR |
8.587 |
2.930 |
0.874 |
16.289 |
|
ANN |
6.884 |
2.624 |
0.899 |
14.303 |
|
|
SDSM |
3.589 |
1.894 |
0.947 |
9.486 |
|
|
Minimum Temperature |
MLR |
4.940 |
2.223 |
0.893 |
5.590 |
|
ANN |
3.748 |
1.936 |
0.919 |
6.841 |
|
|
SDSM |
1.556 |
1.247 |
0.966 |
0.535 |
|
|
Average Temperature |
MLR |
5.038 |
2.244 |
0.908 |
17.703 |
|
ANN |
4.013 |
2.003 |
0.927 |
13.995 |
|
|
SDSM |
1.607 |
1.268 |
0.971 |
7.503 |
|
|
Precipitation |
MLR |
2.763 |
1.662 |
0.078 |
173.661 |
|
ANN |
2.861 |
1.692 |
0.045 |
107.493 |
|
|
SDSM |
2.3-44 |
1.531 |
0.218 |
101.273 |
Based on the above indices, SDSM was found to be the best model for projecting the climate change in the catchment with the highest values of R2 and least values of MSE, RMSE and AAD for each of the parameters. SDSM was therefore used to project the climate change for the catchment.
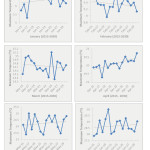
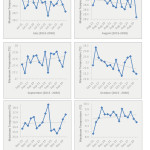
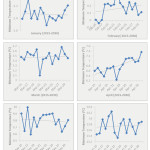
An overall increasing pattern (0.46%) in the monthly maximum temperature was noted particularly in January (3.25%) and June (1.74%), while a consistently decreasing pattern was noted for the month of February (-1.27%). An overall increasing pattern (1.96%) in the monthly minimum temperature was noted particularly in February (45.45%) and November (7.21%), while a consistently decreasing pattern was noted for the month of December (-11.19%).
An overall increasing pattern (0.95%) in the monthly average temperature was noted particularly in January (6.25%) and October (3.08%), while a consistently decreasing pattern was noted for the month of July (-0.69%). A general increasing pattern (2.66%) in the monthly precipitation was noted especially in September (8.34%) and April (7.56%), while a consistently decreasing pattern was noted for the month of December (-7.61%).
 |
|
 |
|
 |
|
 |
|
 |
|
 |
|
Conclusions
The simulated values of the selected parameters obtained by the MLR, ANN and SDSM modelling were close to each other as well as to original values. The highest value of Coefficient of Determination was obtained from SDSM which was then used to predict the climate change for a period of 15 years. The SDSM projections indicate an overall increase in the daily maximum temperature and minimum temperature. The projected precipitation was also higher than the baseline precipitation with an uneven pattern of distribution.
References
- Dash, S.K. and Hunt, J.C.R., 2007. Variability of climate change in India. Current Science, 93(6), pp.782-788.
- Dash, S.K., Jenanani, R. K., Kalsi, S. R. and Panda, S. K., 2007. Some evidence of climate cha ge in 20th century, India. Climate change 85 pp. 299-321
CrossRef - IPCC, 2007: climate change 2007: impacts, adaptation and vulnerability. Contribution of working group II to the fourth assessment report of the Intergovernmental Panel on Climate Change.
- Islam, A. and Sikka, A.K., 2010. Climate Change and Water Resources in India: Impact Assessment and Adaptation Strategies. In Natural and Anthropogenic Disasters (pp. 386-412). Springer Netherlands.
- Meehal, G. A., Stocker, T. F., Collins, W. D., Friedlingstein, P., Gaye, A. T., Gregory, J. M., Kitoh, A., Knutti, R., Murphy, J. M., Noda, A., Raper, S. C. B., Watterson, I. G., Weaver, A. J. and Zhao, Z. C. 2007. Global climate projections, climate change 2007: The physical science basis. Contribution of working group I to the fourth assessment report of the Intergovernmental Panel on Climate Change. Cambridge University Press. Cambridge, United Kingdom & New York, NY, USA.
- Rajendra, K. and Kitoh, A., 2008. Indian summer monsoon in future climate projection by a super high resolution global model. Current Science, 95(11), pp.1560-1569.
- Rosenzweig, C. and Hillel, D., 1998. Climate change and the global harvest.


