Rainfall Profile of Cauvery Delta Zone of Tamil Nadu
N.K Sathyamoorthy 1 , R. Jagannathan 2 * and A. P Ramaraj 1
1
Agro Climate Research Centre,
Tamil Nadu Agricultural University,
Coimbator,
641003
Tamil Nadu
India
2
Department of Agronomy,
Tamil Nadu Agricultural University,
Coimbatore,
641003
Tamil Nadu
India
http://dx.doi.org/10.12944/CWE.11.2.21
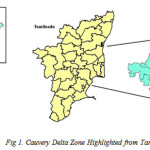
Thanjavur and Nagapattinam districts of Cauvery Delta Zone (CDZ) depend on canal irrigation for agriculture and are subjected to the vagaries of monsoon. This creates water crisis and affects agriculture of the region considered as rice bowl of Tamil Nadu. This necessitated the study of rainfall to plan and mitigate water scarcity. Rainfall data from Adhirampattinam, Aduthurai stations of Thanjavur district (Inland) and Nagapattinam station (Coastal area of Nagapattinam district) were utilized for the study. Normal rainfall of CDZ is 956 mm; Nagapattinam receives highest (1350 mm) and aduthurai (994 mm) recorded lowest. November is the wettest month for all locations while driest month differs among locations. Northeast monsoon (NEM) was considered as stable monsoon for CDZ as could be seen from the seasonal mean of 641 mm, 620 mm and 919 mm recorded by Adhirampattinam, Aduthurai and Nagapattinam, respectively. Trend analysis of seasons revealed that Adhirampattinam and Nagapattinam follow a decreasing trend for rainfall and rainydays during NEM and Southwest monsoon (SWM), with an increasing trend for Hot weather period (HWP) and Cold weather period (CWP). An interesting deviation is that Aduthurai recording an increasing trend for NEM while it followed same trend for HWP and SWM.
Copy the following to cite this article:
Sathyamoorthy N. K, Jagannathan R, Ramaraj A. P. Rainfall Profile of Cauvery Delta Zone of Tamil Nadu. Curr World Environ 2016;11(2) DOI:http://dx.doi.org/10.12944/CWE.11.2.21
Copy the following to cite this URL:
Sathyamoorthy N. K, Jagannathan R, Ramaraj A. P. Rainfall Profile of Cauvery Delta Zone of Tamil Nadu. Curr World Environ 2016;11(2). Available from: http://www.cwejournal.org/?p=14260
Download article (pdf)
Citation Manager
Publish History
Introduction
Rainfall is a vital agro-climatological parameter in the seasonally arid fragments of the world and its evaluation an essential prerequisite for agricultural planning in India (Alak gadgil, 1986). Valipour (2013a, 2013b and 2013c) studied the status of irrigated and rainfed agriculture in the world, and summarized benefits and drawbacks of irrigation systems. The author indicated that 46% of cultivated areas in the world are not suitable for rainfed agriculture because of climate changes and other meteorological conditions. Valipour (2014) stated that environmental efficiencies of irrigated establishments vary considerably through distinctive agricultural water management regions. Studying irrigated agriculture pointers plays a highlighted role in agricultural water management during past years and future.
India being a tropical country, its agricultural planning and consumption of water depends on monsoon, which accounts for more than 50% of rainfall received by it. The unevenness in receipt of this monsoon over space and time thus make it an important parameter for thorough analysis (Jagannadhasharma, 2005). Tamil Nadu one of the prominent rice growing states in India, has been cultivating rice from time immemorial as this State is gifted with all fortunate climatic conditions suitable for rice growing. Paddy is the principal crop expansively cultivated in all the districts of the state.
In the present study, Cauvery delta zone (CDZ) was chosen for rainfall analysis as it is the rice bowl of Tamil Nadu state. It covers the rivers Cauvery, Vennaru, Kudamuruti, Paminiar, Arasalar and Kollidam. The major dams operated by this region are Mettur and Bhavanisagar. Canal irrigation, well irrigation and tank irrigation are being practised in this zone. Thanjavur district is a portion of Cauvery delta with rich and fertile soil. This district is contributing the major part of the food grains predominantly paddy to the state pool and hence commonly known as “Granary of South India”. The climate is tropical and major portion of rain is received through NEM. Even though the rice crop is grown in all three seasons in Thanjavur, Rabi season that coincides with NEM has the highest acreage among the other seasons (Kharif and Summer).
Cauvery, Vennaru, and Grand Anaicut Canal with their subsidiaries viz. Vettar, Kudamuruti, Thirumalairajan, Veerachozhan, Arasalar, Agniyar, Kalyana Odai and Poonaikuthi river constitute the irrigation system of the district. Over reliance on canal irrigation, which is subjected to depredations of the monsoon and intricacies of interstate water sharing provisions among the riparian states, is the key negative feature of the district. Thus the focus on this zone for rainfall profile studies is considered as an important task.
Materials and Methods
Study Location
Thanjavur lies between 9º 50’ and 11º 25’ northern latitude and 78º 45’ and 79º 25’ of eastern longitude. Nagapattinam lies between 10º10' and 11º20' northern latitude and 79º15' and 79º50’ eastern longitude and they fall under CDZ (Fig 1). The soil is fertile because of the deltaic terrain and greater parts of the district entail an undulant plain. The climate is tropical and the district come under the class of medium and high rainfall zone with more than 50% annual rainfall received during NEM.
 |
|
Analysis and Tools
Mean, Standard Deviation (SD) and Coefficient of Variation (CV) were computed for rainfall and rainydays using Weathercock software developed by Central Research Institute for Dryland Agriculture. SPSS software package was used to study the trend of rainfall and rainydays. Monthly, seasonal and annual values were cumulated from daily values to study the temporal behavior of the monsoon.
Study Period
The daily Rainfall observation from 1975 to 2005 were collected for all the three stations viz., Adhirampattinam, Aduthurai and Nagapattinam and were used for various calculations involved in the study.
Results and Discussion
Rainfall Variability
Annual
In the present study among the stations Nagapattinam recorded highest mean annual rainfall of 1350 mm followed by Adhirampattinam 1155 mm and Aduthurai 994 mm(Table 1). Annual Rainfall of Nagapattinam ranges between 661 mm and 1825 mm with a standard deviation of 275 mm and coefficient of variation is 20.4 %. Annual rainfall of Adhirampattinam ranges between 427 mm and 2189 mm with a standard deviation of356 mm and coefficient of variaion is 30.8 %. Annual rainfall of Aduthurai ranges between 344 mm and 1768 mm with a standard deviation 325 mm and coefficient of variation is 32.7 %. This trend of variability in rainfall observed for this location is a universal phenomenon in monsoon climate (Aty, 1976).
Table 1: Rainfall and rainyday variability statistics
|
|
Rainfall |
Rainydays |
||||||||||
|
Adirampattinam |
Mean |
SD |
CV |
Highest |
Lowest |
Mean |
SD |
CV |
Highest |
Lowest |
||
|
CWP |
57 |
87 |
152 |
395 |
0 |
3 |
5 |
132 |
19 |
0 |
||
|
HWP |
127 |
76 |
60 |
258 |
4 |
6 |
3 |
51 |
14 |
1 |
||
|
SWM |
330 |
140 |
43 |
624 |
133 |
17 |
5 |
32 |
26 |
7 |
||
|
NEM |
641 |
273 |
43 |
1507 |
186 |
28 |
8 |
30 |
44 |
10 |
||
|
Annual |
1155 |
356 |
31 |
2189 |
427 |
54 |
11 |
21 |
71 |
23 |
||
|
Aduthurai |
||||||||||||
|
CWP |
43 |
71 |
167 |
305 |
0 |
2 |
3 |
132 |
13 |
0 |
||
|
HWP |
76 |
79 |
104 |
366 |
0 |
4 |
3 |
68 |
11 |
0 |
||
|
SWM |
256 |
100 |
39 |
457 |
63 |
15 |
5 |
31 |
21 |
3 |
||
|
NEM |
620 |
241 |
39 |
1109 |
192 |
27 |
7 |
25 |
37 |
14 |
||
|
Annual |
994 |
325 |
33 |
1768 |
344 |
48 |
9 |
20 |
65 |
28 |
||
|
Nagapattinam |
||||||||||||
|
CWP |
95 |
150 |
158 |
621 |
0 |
4 |
4 |
109 |
16 |
0 |
||
|
HWP |
80 |
65 |
81 |
231 |
1 |
4 |
3 |
71 |
10 |
0 |
||
|
SWM |
256 |
100 |
39 |
460 |
13 |
15 |
5 |
33 |
24 |
2 |
||
|
NEM |
919 |
270 |
29 |
1543 |
260 |
32 |
8 |
25 |
47 |
15 |
||
|
Annual |
1350 |
276 |
20 |
1825 |
661 |
55 |
8 |
15 |
78 |
37 |
||
Seasonal
Percent contribution of seasonal rainfall to annual rainfall were worked out and the results revealed that NEM was the major season for CDZ in which Thanjavur and Nagapattinam receives more than 50 % of its annual rainfall. Adhirampattinam receives 55.5 %, Aduthurai 62.4 % and Nagapattinam 68.1 % of annual rainfall, respectively (Table 2). SWM was the next highest contributor to annual rainfall with 28.5 %, 25.7 % and 18.9 % for Adhirampattinam, Aduthurai and Nagapattinam, respectively. This is followed by HWP while the least contributor is CWP.
Table 2: Percent contribution of seasonal rainfall
|
Season |
Adhirampattinam (%) |
Aduthurai (%) |
Nagapattinam (%) |
|
CWP |
4.9 |
4.3 |
7.1 |
|
HWP |
11.1 |
7.6 |
5.9 |
|
SWM |
28.5 |
25.7 |
18.9 |
|
NEM |
55.5 |
62.4 |
68.1 |
Northeast Monsoon
NEM (Table 1) is the main season for Cauvery delta zone and it ranges between 260 mm (1979) and 1543 mm (1976) for Nagapattinam with a standard deviation of 270 mm and coefficient of variation is 29.3 %. For Adhirampattinam it ranges between 186 mm (1977) and 1507 mm (1981) with a standard deviation of 273 mm and coefficient of variation is 43 %. Aduthurai, the least of the three stations ranges between 192 mm (1975) and 1109 mm (1999) with a standard deviation of 241 mm and coefficient of variation is 38.8%. Coefficient of variation for CWP is higher for all the three stations. The lowest coefficient of variation observed during NEM indicates that this monsoon is a stable one as has been recorded by Dhar et.al, (1982).
The rainyday also follows a similar pattern as that of rainfall. Nagapattinam has the highest number of rainydays (55) in a year followed by Adhirampattinam (54) and lowest with Aduthurai (48) (Table 1). CWP experiences a large coefficient of variation similar to rainfall.
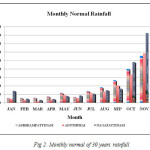
Analysis of Monthly Rainfall and Rainydays
The monthly rainfall normals arrived using observed data revealed that November (Table 3) was the month having highest rainfall (278 mm, 292 mm and 412 mm for Adhirampattinam, Aduthurai and Nagapattinam respectively) for a month in all the three study locations (Fig 2). However there exist differences in recording least rainfall for a month in different locations with January 28 mm being lowest for Adhirampattinam while it is March with values of 9 mm and 18 mm for Aduthurai and Nagapattinam, respectively.
 |
|
Analysing the normals of rainydays reveals that November (Table 1) was the month having highest number of rainydays 11, 11 and 13 days for Adhirampattinam, Aduthurai and Nagapattinam respectively. The least number of rainydays (1 rainyday) fall between the months of January to April for all these stations.
Table 3: Normals for monthly rainfall (RF) and rainydays (RD)
|
Month |
Adhirampattinam |
Aduthurai |
Nagapattinam |
|||
|
RF(mm) |
RD |
RF(mm) |
RD |
RF (mm) |
RD |
|
|
Jan |
28 |
2 |
25 |
1 |
71 |
3 |
|
Feb |
29 |
2 |
18 |
1 |
24 |
1 |
|
Mar |
31 |
1 |
9 |
1 |
18 |
1 |
|
Apr |
38 |
2 |
20 |
1 |
23 |
1 |
|
May |
59 |
3 |
46 |
2 |
40 |
2 |
|
Jun |
34 |
2 |
29 |
2 |
44 |
2 |
|
Jul |
69 |
4 |
58 |
3 |
54 |
3 |
|
Aug |
92 |
5 |
67 |
4 |
74 |
4 |
|
Sep |
134 |
6 |
103 |
6 |
84 |
5 |
|
Oct |
200 |
10 |
167 |
9 |
241 |
10 |
|
Nov |
278 |
11 |
292 |
11 |
412 |
13 |
|
Dec |
163 |
7 |
161 |
7 |
267 |
9 |
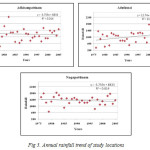
Annual Trend Analysis
The change in amount of yearly rainfall will directly affect the availability of water. Therefore, it is vital to know whether there is a decrease in rainfall quantity so that, the information can be used for regulating the planning and management of irrigation project and water resources associated issues (Kwanyuen, 2001). Trend analysis (Table 5a) of annual rainfall for 30 years revealed that total annual rainfall and number of rainydays is decreasing for Adhirampattinam (Fig 3) and Nagapattinam (Fig 3) and showed a increase for Aduthurai (Fig 3). Though the R square value is not significant, a clear trend could be observed as the amount of increase is considerably higher.
 |
|
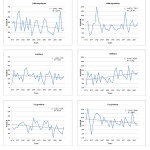
Seasonal Trend Analysis
Out of the three locations, Adhirampattinam (Fig 4) and Nagapattinam (Fig 4) follow a similar decreasing trend for rainfall and rainydays during both monsoons while it shows an increasing trend for HWP and CWP. The increase in rainfall during HWP may support the irrigated crops. Typically Aduthurai (Fig 4) follows an increasing trend during NEM and HWP while a decreasing trend during SWM and CWP. The geographical location of Aduthurai (inland) could possibly be the reason for such variation in trend compared to other locations, which are located along the coasts. Further the seasons were disaggregated into monthly trends and are presented in Table 4a.
 |
|
Table 4a: Annual and seasonal trend analysis of Rainfall and rainydays
|
Month |
Adhirampattinam |
Aduthurai |
Nagapattinam |
|||
|
RF |
RD |
RF |
RD |
RF |
RD |
|
|
Season |
||||||
|
CWP |
I |
I |
D |
D |
I |
I |
|
HWP |
D |
I |
I |
I |
I |
I |
|
SWM |
D |
D |
D |
D |
D |
D |
|
NEM |
D |
D |
I |
I |
D |
D |
|
Annual |
D |
D |
I |
I |
D |
D |
|
I – Increasing D – Decreasing C – No change |
||||||
Monthly Trend Analysis
The analysis of monthly trend (Table 4b) revealed that April and May month had an increasing trend and July had a decreasing trend for rainfall and rainydays for all the locations studied. The months August and September also had decreasing trend for all the locations and a deviation is that of Nagapattinam were in it was able to maintain a same level of precipitation over the study period of August.
Table 4b: Monthly trend analysis of Rainfall and rainydays
|
Month |
Adhirampattinam |
Aduthurai |
Nagapattinam |
|||
|
RF |
RD |
RF |
RD |
RF |
RD |
|
|
Jan |
I |
I |
D |
D |
I |
I |
|
Feb |
I |
I |
D |
I |
I |
I |
|
Mar |
D |
D |
I |
D |
D |
D |
|
Apr |
I |
I |
I |
I |
I |
I |
|
May |
I |
I |
I |
I |
I |
I |
|
Jun |
D |
D |
I |
D |
I |
I |
|
Jul |
D |
D |
D |
D |
D |
D |
|
Aug |
D |
D |
D |
D |
C |
C |
|
Sep |
D |
D |
D |
C |
D |
D |
|
Oct |
D |
D |
I |
I |
D |
D |
|
Nov |
I |
I |
I |
I |
D |
D |
|
Dec |
D |
D |
I |
D |
D |
D |
I – Increasing D – Decreasing C – No change
Conclusion
Cauvery delta zone especially Thanjavur district is contributing the main part of food grains production especially paddy to the state pool and hence prevalently known as “Granary of South India”. Normal annual rainfall of this zone is 956.3mm; Out of the three locations studied Nagapattinam received highest rainfall of 1350.2 mm while Aduthurai recorded the lowest (994.1mm). Among the monsoons, NEM was the stable monsoon with seasonal normal rainfall of 641.3mm, 620.3mm and 919.4mm respectively for Adhrampattinam, Aduthurai and Nagapattinam as could be seen from less coefficient of variation. These quantities were received in 28, 27 and 32 rainydays.
Adhirampattinam and Nagapattinam had decreasing trend for rainfall and rainydays during NEM and SWM seasons and showed increasing trend for HWP and CWP. Interestingly Aduthurai showed an increasing trend during NEM and HWP and decreasing trend during SWM and CWP differing from other two locations. Increasing rainfall during summer and decreasing rainfall during NEM necessitates modification in water management strategies in future.
References
- Alaka Gadagil, (1986).‘Annual and weekly analysis of rainfall and temperature for Pune: a multiple time series approach’. Inst. Indian Geographers.Vol.8(1): pp 92-96.
- Aty SH (1976). ‘On the distribution of rainfall sequences with application to actual data’. J Dirasat., Jordan Univ., Natural Science 3: pp 15–25.
- Dhar, O. N. Rakhecha, P. R. and Kulkarni, A. K. (1982). ‘Fluctuations in northeast monsoon rainfall of Tamil Nadu’. Int. J. Climatol., 2, pp 339–345.
CrossRef - Ishappa, M.R. and Aruchamy, S. (2010). ‘Spatial Analysis of Rainfall Variation in Coimbatore District Tamil nadu using GIS’. Int. J. journal of geomatics and geosciences., 1(2), pp 106-118.
- Jagannadha Sarma, V.V (2005). Rainfall pattern in the coastal zone of Krishna Godavary basin Andhra Pradesh India’. J of appl hydrol.Vol.18 (1&2), pp 111
- Kwanyuen, B. (2001). ‘Comparative study of rainfall change in the north of Thailand. The Chao Phraya Delta: Historical Development, Dynamics and Challenges of Thailand's Rice Bowl’. December 4-6, Tokyo.
- Valipour, M. (2013a). Necessity of irrigated and rainfed agriculture in the world,” Irrig Drain Sys Eng. S9:e001. 

- Valipour, M. (2013b), Evolution of irrigation-equipped areas as share of cultivated areas,” Irrig Drain Sys Eng. 2:e114.
- Valipour, M. (2014). Variations of irrigated agriculture indicators in different continents from 1962 to 2011. Advances in Water Science and Technology 01, 01-14.
- Valipour., M. (2013c). Need to update of irrigation and water resources information according to the progresses of agricultural knowledge. Agrotechnology,” S10:e001. 2013c. 

CrossRef


