Rainfall Trend and Variability Analysis of Sub-Tropical Hills of Arunachal Pradesh in Northeastern Himalayan Region of India
Kaushik Bhagawati1 * , Rupankar Bhagawati1 , Amit Sen1 , Kshitiz K Shukla1 and Rajesh A Alone1
http://dx.doi.org/10.12944/CWE.11.2.35
The climate change especially the changes in rainfall pattern is most crucial for Himalayan region as it leads to changes in river runoff and consequently affecting environment, agricultural productivity and human livelihood downstream. Current study aims to evaluate the rainfall trend and variability in the highest rainfall recipient sub-tropical hill regions of Arunachal Pradesh in Northeastern Himalayan region of India. Sen’s estimator is used for trend analysis and Mann-Kendall test to determine significance of the trend. The 37 years (1979-2015) data reveals no clear and consistent trend of average annual rainfall. But a wide inter and intra seasonal variation in the monthly rainfall has been observed. Also a significant shift in rainfall during pre-monsoon and Southwest monsoon was noticed leading to change in forest and agricultural growing seasons, mid-season dry spell during July and increase in extreme rainfall events during August, September and October. The trend analysis of rainfall will help in prediction of future climate scenarios in this Himalayan region and to understand the impact of climate change.
Copy the following to cite this article:
Bhagawati K, Bhagawati R, Sen A, Shukla K. K, Alone R. A. Rainfall Trend and Variability Analysis of Sub-Tropical Hills of Arunachal Pradesh in Northeastern Himalayan Region of India. Curr World Environ 2016;11(2) DOI:http://dx.doi.org/10.12944/CWE.11.2.35
Copy the following to cite this URL:
Bhagawati K, Bhagawati R, Sen A, Shukla K. K, Alone R. A. Rainfall Trend and Variability Analysis of Sub-Tropical Hills of Arunachal Pradesh in Northeastern Himalayan Region of India. Curr World Environ 2016;11(2). Available from: http://www.cwejournal.org?p=954/
Download article (pdf) Citation Manager Publish History
Introduction
Current human induced climate change is unprecedented in the history of earth and its impacts are very real though with spatially varied intensity, that is supported and confirmed by consistent rise in average air and ocean temperatures, decrease in glacier levels and rise in sea level.1 The impact of climate change is believed to be more prominent and extensive especially on the Himalayan Mountains as they are among the most fragile environments/ecosystems on the Earth.2 The Northeastern Himalayan region comes under Indo-Myanmar Maga-Biodiversity Zone sustaining huge repository of biodiversity and water and also provide ecosystem services to the communities downstream.3,4,5 The region harbor some of the world’s most endangered and endemic flora and fauna species as well as the home to traditional communities who are highly dependent on the ecosystem services for their subsistence and livelihood.6 Unfortunately the Northeastern Himalaya is now a priority eco-region and biologically rich ‘hotspot’.7 Mountain ecosystems are likely to experience wide ranging effects on the environment, biodiversity, agriculture and socio-economic conditions under the influence of climate change.8 Climate change, especially change in hydrological cycle due to change in rainfall patterns leading to changes in river runoff and consequently affecting whole ecosystems downstream including environment, agricultural productivity and human livelihood.
With total geographical area of about 8.37 million hectare, Arunachal Pradesh is the largest hill state in Northeastern Region of India. It is entirely a hilly state lies on the mighty Himalayan and Patkoi ranges. It has rich biological as well as cultural diversity. In a general survey it was found that the state has 23.52% of total flowering plants of India9 including around 4,500 species of angiosperm and 550 species of orchids; and it also has huge repository of medicinal plants, where primary survey revealed around 500 species.10 Regarding the genetic resource, the state ranked second in the country.11 Agriculture of the region is most vulnerable to climate change due to its high dependence on climate especially rainfall as 83 per cent of cropped area are under rainfed cultivation. The Himalayan mountain system divides the state mainly into five river valleys: the Kameng, the Subansiri, the Siang, the Lohit and the Tirap. These rivers, along with innumerable rivulets ultimately drain down to form two major river systems and valleys of the region- the Brahmaputra and the Barak that determine the socio-economic life of almost whole Northeastern part of India. Any change in the hydrological cycles of these rivers effect the fate agriculture and economy of millions of people downstream.
In view of the strategic location of the state in the Northeastern Himalayan region, based on long term daily recorded data an attempt was made to study the trends of rainfall in the sub-tropical hill region that represent the biologically and agriculturally most crucial and diverse part of the state, and influence the climate of whole state. The trend analysis of climatic variables especially rainfall will help in the construction of future climate scenarios in the region. Also, understanding of rainfall variability for a region is necessary to appreciate the impact of climate change.
Materials and Methods
Study Site
The study is concentrated at Basar located in the Sub-tropical Hill zone of Arunachal Pradesh in Northeastern Himalayan region of India stretching between N27o59.53' and E94o41.27'. Topographically, it is generally a hilly region, with the elevation of the hills ranges from 600 meters to over 800 meters.
Data
The daily rainfall for the period of 37 years (1979-2015) has been collected from Agro-meteorological Observatory at ICAR Research Farm, Gori, Arunachal Pradesh maintained by India Meteorological Department. The data were quality checked and the time series of monthly and seasonal rainfall were prepared from daily data.
Statistical Analysis
The statistical characteristics like Mean and Coefficient of Variation were calculated for different seasons to get understanding of the variability.
Generally, trend analysis of time series consists of determination of the magnitude of trend and its statistical significance. Here the magnitude of trend is determined using Sen’s estimator method12 and is the most popularly used for determination of the magnitude of trend in hydro-meteorological time series analysis. In this method of estimation, the slope (Ti) of all data pairs are initially calculated by

where xi and xk are data values at j and k (j>k) respectively. The median of N values of Ti is Sen’s estimator of slope which is calculated as 1/2
A positive value of β indicated an upward (increasing) trend and a negative value indicates a downward (decreasing) trend in the time series.13
The Mann-Kendall test has been employed to determine the significance of trend in rainfall.14,15 The statistics (S) is defined as per Salas11:
Where N is the number of data points. It is assumed that (xj-xi) = θ we have
For large sample size (N>10), normal distribution is assumed for conducting the test,16 with mean and variances as follows:
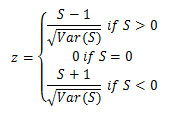
Where n is the number of tied (having no difference between the compared values) and tk is the number of data point in the kth tied group. Here the Z-statistics is computed as given by Hirsch et al17:
If |Z| < Zα, the null hypothesis (Ho) that there is no trend is rejected at α level of significance in a two-sided test at 95% confidence level.
Results and Discussion
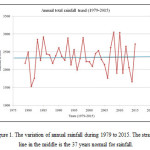
The 37 years (1979-2015) mean annual rainfall was found to be 2345 mm with coefficient of variation (CV) of 16.4 per cent. Though the rainfall during the study period has been very erratic or irregular (Fig. 1), but no significant increasing or decreasing trend of rainfall was noticed as shown in table-I based on Sen’s estimator.
 |
|
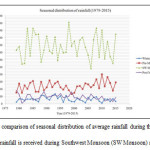
On an average 66.5 per cent of rainfall was received during Southwest monsoon season (June-September) followed by 20.5 per cent during pre-monsoon (March-May), while the post monsoon (October to December) and winter (January-February) receives 7.7 and 5.3 per cent of total rainfall respectively (Fig. 2). The CV of 37 years average rainfall for Southwest monsoon, pre-monsoon, post-monsoon and winter is 21.3, 26.3, 43.2 and 51.8 respectively, indicating wide variability in post-monsoon and winter rainfall. During the period (1979-2015) the highest rainfall (3049.7 mm) is recorded in 2008, while the lowest rainfall (1530.8 mm) in 1981.
 |
|
Table 1: The Sen’s estimator of slope for rainfall in Arunachal Pradesh based on the daily data during 1979-2015. Though there is variability in the distribution of rainfall, but there is no observed significant increasing or decreasing trend, both in seasons and in months.
|
Rainfall Trends |
||||||||||||||||
|
Annual |
Winter |
Pre-Monsoon |
SE Monsoon |
Post Monsoon |
||||||||||||
|
-3.73 |
-0.12 |
+2.19 |
-2.29 |
-0.85 |
||||||||||||
|
Monthly rainfall trends in mm per year (37 years average) |
||||||||||||||||
|
Mon-ths |
Jan |
Feb |
Mar |
Apr |
May |
Jun |
Jul |
Aug |
Sep |
Oct |
Nov |
Dec |
||||
|
+0.30 |
-0.08 |
+0.51 |
-0.82 |
+1.29 |
-0.81 |
-1.16 |
+0.39 |
+0.29 |
-0.86 |
-0.10 |
-0.14 |
|||||
|
Increasing (+) and decreasing (-) trends The significant difference is marked with “*”. |
||||||||||||||||
Considering the pre-monsoon (March, April and May), in the last five years (2011-2015), the average monthly rainfall has increased in month of March (120.88 mm) and May (297.72 mm) compared to 37 years normal of 102.9 mm and 223.6 mm respectively for the months. While in the month of April the rainfall has been decreased (122.7 mm) compared to normal of 155.0 mm. In Southwest monsoon season there is significant decrease in the average rainfall of July in the last five years (375.7 mm) compared to the normal of 469.7 mm, while the last five year average rainfall has increased in August (365.5 mm) as compared to normal of 336.1 mm. Thus there is shift in the rainfall pattern in the last 5 years compared to 37 years normal. This may result in the shift in the growing season of forest trees and sowing date of some crops. This also account for mid-season dry spell during month of June and July challenging the ecological structure and rain-fed agriculture of the region. However increase in the high intensity rainfall during August, September and October cause serious damage to the standing ready to harvest crops.18,19 The uneven distribution of rainfall with heavy rain in the short span resulted floods in the plains of Assam, generally during late July to mid August. Also during post-monsoon, it has been noticed that the average monthly rainfall during 2011-15 has decreased for all the months compared to 37 years normal for the months with significant decrease in October (59.6 mm) compared to normal (124.4 mm). During winter, the average rainfall of January increased in the last five years (58.22 mm) compared to normal (44.88 mm), while average monthly rainfall in February decreased to 45.12 mm (2011-2015) compared to normal of 78.8 mm (1979-2015). Thus there is no appreciable change in the winter rainfall as a whole in the recent past.
The result reveals no clear and consistent trend in average total annual rainfall over the region, but there is wide inter and intra seasonal variation in its distribution. Previous studies on the long term rainfall trends in India also find no significant trend.20,21,22,23 The finding in the study is also in accordance with the finding of Dash et. al.24 that indicated increasing trend in the rainfall during pre-monsoon seasons. The current study also shows that there is increase in the extreme rainfall events especially during September and October months which is in agreement with the previous finding in different part of the country.25,26 During the study the dry spell has been observed during the months of May, June, July and August and in the recent decade the frequency of mid-season dry spell was found to be more prominent in the month of July. Such variation of dry spell was also observed in previous finding by Dash et. al.27. The water deficit conditions lead to change in ecosystem and the behavior of plant cultivars in the region.28
Conclusion
Understanding the variability and temporal distribution of rainfall is crucial for resource planning and management under current era of climatic variability. Though no significant trend in total annual rainfall has been observed during the period, the variability in temporal distribution was found to be significant during all the four seasons. The observed trend is insignificant but they exists indicating uncertain and worrisome possibility of rainfall extreme events like mid-season drought and flush floods.
References
- IPCC, Summary for Policymakers, Fourth Assessment Report (AR4). New York, Cambridge University Press (2007)
- Sharma, E., Chettri, N., Tse-ring, K., Shrestha, A.B., Jing, F., Mool, P., Eriksson, M., Climate Change Impacts and Vulnerability in the Eastern Himalayas. ICMOD, Kathmandu, Nepal (2009)
- Hamilton, L.S., Why mountain matters? World Conservation: The IUCN Bulletin, 1/2002 (2002)
- Korner, C., Mountain biodiversity, its causes and function. Ambio Supplement, 13: 11-17 (2004)
- Viviroli, D., Weingartner, R., Hydrological significance of mountains: From regional to global scale. Hydrological Earth Systems Science, 8(6):1016-1029 (2004)
CrossRef - Kollmair, M., Gurung, G.S., Hurni, K. & Maselli, D., Mountains: Special places to be protected? An analysis of worldwide nature conservation efforts in mountains. International Journal of Biodiversity Science and Management, 1: 1-9 (2005)
CrossRef - WWF Annual Report, WWF International Avenue du Mont-Blanc 1196 Gland Switzerland, Pp: 24 (2005)
- Beniston, M., Climatic change in mountain regions: a review of possible impacts. Climate Change, 59:5-31(2003)
CrossRef - Hegde, S.N., Arunachal Pradesh State Biodiveristy Strategy & Action Plan – Final Report. State Forest Research Institute, Itanagar (2002)
- Haridasan, K., Shukla, G.P., Benewal, B.S., Medicinal Plants of Arunachal Pradesh. SFRI Information Bulletin, No.5. State Forest Research Institute, Itanagar (1989)
- SAPCC, Arunachal Pradesh State Action Plan on Climate Change. Department of Environment and Forest, Government of Arunachal Pradesh, Itanagar (2011)
- Salas, J.D., Analysis and modeling of hydrologic time series. In Handbook of Hydrology (ed. Maidment, D.R.), McGraw-Hill, New York, pp. 19.1-19.72 (1993)
- Jain, S.K., and Kumar, V. Trend analysis of rainfall and temperature data of India. Current Science, 102(1): 37-49 (2012).
- Douglas, E.M., Vogel, R.M., Knoll, C.N., Trend in flood and low flows in the United States: Impact of spatial correlation. Journal of Hydrology., 240:90-105 (2000)
CrossRef - Burn, D.H., Cunderlik, J.M., Pietroniro, A., Hydrological trends and variability in the Liard river basin. Hydrological Sciences Journal, 49:53-67 (2004)
CrossRef - Helsel, D.R. and Hirsch, R.M., Statistical Methods in Water Resources, Elsevier, New York (1992)
- Hirsch, R.M., Helsel, D.R., Cohn, T.A., Gilroy, E.J. Statistical treatment of hydrologic data. In Handbook of hydrology (ed. Maidment, D.R.), McGraw-Hill, New York, pp. 17.1-17.52 (1993)
- Arunachal Times, Paddy Crop Failure, Farmers Apprehensive. 15th July’2009. (2009) http://www.arunachaltimes.in/archives/jul09%2015.html.
- Arunachal Times, Flash flood causes extensive damage to crops, roads; local MLA ‘unconcerned’. 14th September, 2012 (2012) http: //www.arunachaltimes.in /sep12%2014.html.
- Mooley, D.A. and Parthasarthy, B., Fluctuations of all India Summer monsoon rainfall during 1871-1978. Climatic Change, 6: 287-301 (1984)
CrossRef - Thapliyal, V. and Kulshreshtha, S.M., Climate changes and trends over India. Mausam, 42:333-338 (1991)
- Lal, M., Climatic change – Implications for India’s water resource. Journal of Indian Water Resource Society, 21:101-119 (2001)
- Kumar, V., Jain, S.K., Singh, Y. Analysis of long-term rainfall trends in India. Hydrological Sciences Journal, 55: 484-496 (2010)
CrossRef - Dash, S.K., Jenamani, R.K., Kalsi, S.R., Panda, S.K. Some evidence of climate change in twentieth-century India. Climatic Change, 85:299-321 (2007)
CrossRef - Pal, I. and Al-Tabbaa, Trends in seasonal precipitation extremes – an indicator of climate change in Kerala. Indian Journal of Hydrology., 367:62-69 (2009)
CrossRef - Pattanaik, D.R. and Rajeevan, M., Variability of extreme rainfall events over India during southwest monsoon season. Meteorological Applications., 17:88-104 (2010)
- Dash S.K., Kulkarni, M.A., Mohanty, U.C., Prasad, K., Changes in the characteristics of rain events in India. Journal of Geophysical Research., 114:101- 109 (2009)
CrossRef - Das, R., Bhagawati, K., Boro, A., Medhi, T., Medhi, B., Bhaisana, R.K. Relative Performance of Plant Cultivars Under Respective Water Deficit Adaptation Strategies: A Case Study. Current World Environment., 10(2):683-689 (2015)
CrossRef


