Rainfall Variability and Trend Detection in Dindigul District of Amaravathi Basin
S. Thangamani1 and A. Ravira J2 *
1
Tamil Nadu Agricultural University,
Coimbatore,
India
2
Water Technology Centre,
Tamil Nadu Agricultural University,
Coimbatore,
India
http://dx.doi.org/10.12944/CWE.11.2.27
The present study attempted to find out the relation between rainfall variability, trend and distribution in Dindigul district of Amaravathi basin for groundwater management. A detailed analysis of monthly, seasonal and spatial variation of rainfall (1971-2014) for the study area had carried out. The normal annual rainfall of the district varies from 700 to 1600 mm. The north east monsoon contributed the maximum rainfall of 439mm (50%), followed by South-west monsoon which contributed 254 mm (29%), summer which contributed 147 mm (16.8%) and winter contributed the minimum rainfall of 26.8 mm (2.8%).A high value of CV had observed in all the stations, which indicate the greater rainfall variability, and more chances of occurrence of drought. Higher variability of coefficient of variation was observed in central part of the district.Theresult of MMK z-test at 1% level indicates that the majority of stations showed non-significant trend in annual, summer and monsoon season of rainfall. Out of the 13 stations studied in the district, annual rainfall of only one station (Kuthiraiyar) showed significant decreasing trend in annual rainfall (-3.05 mm/year) and five stations recorded the significant decreasing trend in rainy days during southwest monsoon. Chatrapatti and Natham stations recorded the significant increasing trend during north east monsoon and Virupatchi station recorded the decreasing trend.
Copy the following to cite this article:
Thangamani S, Raviraj A. Rainfall Variability and Trend Detection in Dindigul District of Amaravathi Basin. Curr World Environ 2016;11(2) DOI:http://dx.doi.org/10.12944/CWE.11.2.27
Copy the following to cite this URL:
Thangamani S, Raviraj A. Rainfall Variability and Trend Detection in Dindigul District of Amaravathi Basin. Curr World Environ 2016;11(2). Available from: http://www.cwejournal.org/?p=16009
Download article (pdf) Citation Manager Publish History
Introduction
Rain is a very important natural phenomenon, which can persuade the human life. In fact, the rain that falls into certain area can viewed because of many factors, which can divided into three segments: space, time and other factor. The rainfall analysis and its results at a particular location can illustrate in above three categories. Several researchers have studied the distribution, variability and trends of rainfall at global, regional and basin scales. A study on temporal (monthly, seasonal and annual) rainfall trends in twentieth century over Kerala, India reported a significant decrease of rainfalls during the southwest monsoon and an increase during the post-monsoon season.1 An attempt was made to study the temporal variability of rainfall and its trend at Seonath sub basin in the Chhattisgarh State (India). They used Modified Mann-Kendall (MMK) (non-parametric), Spearman’s rho test (parametric) to detect the trend and Sen’s slope to detect trend magnitude in which decreasing trend have observed in annual and seasonal rainfall series of the whole basin.2
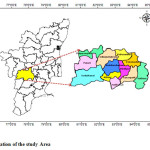
Study Area
The study area Dindigul district extends over 6,266 km2 of geographical area in Tamil Nadu. The total population of the district is 2.16 million (2011 census). More than 78 per cent of them live in rural areas. The density of population is 291 per sq.km. The district consists of 14 blocks and two blocks are noticed as driest parts. Out of the net area sown, only 9 per cent is sown more than once. The majority of the villages in the eastern and the central part of the district are in the category with less than 40 per cent of net sown area. Dry farming is predominant in the district and the important wet land tracts are located in the Shanmuganathi and the Kodaganar basins. This implies that, the agriculture is mainly depended on rainfall (dry farming). As for seasonal distribution, the full benefit of south-west monsoon could not be harvested because of Western ghats, and north east monsoon is the principle monsoon in the district. So an attempt has made to study the rainfall distribution, trend and variability over the station and trend in number of rainy days is also studied in the district. This includes the spatial variation of rainfall, variability over different seasons, and trend of rainfall.
 |
|
 |
|
Dindigul district is a hard rock terrain located in the south part of Tamil Nadu, India. It lies in between 9o 91’ and 10 o 84’ North latitudes and 77 o 24 and 78 o 44’ east longitude. It occurs within the survey of India toposheet Nos.58 F/6-8, 10-12, 14-16; 58 J/I-4 and 7 covering a total area of 6,266.64 km2.The study area falls in the sub-basin of Cauvery River basin. The normal annual rainfall over the district varies from about 700 mm to 1,600 mm. The study area enjoys a tropical climate. The periods from April to June area generally hot and dry (summer) and it is pleasant during November to January (winter). The hilly region records low temperature and fairly heavy rainfall. The North-East monsoon is the main source of water in the district.
Materials and Method
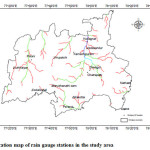
The daily rainfall data for the period of 1971-2014 was collected from Public works Department, Chennai and tabulated to calculate the monthly and seasonal rainfall for the individual rain gauge stations. The seasonal analysis of rainfall and rainy days were carried out for Winter (January-February), Summer (March –May), South-west (June-September) and North east monsoon (October -December).
 |
|
 |
|
Trend Analysis
The magnitude of the trend in the seasonal and annual series was determined using the Sen’s estimator3 and statistical significance of the trend in the time series was analysed using Modified Mann-Kendall (MMK) test.4 The Z values for seasonal and annual rainfall clearly exhibit the trends in spatial dimension over the study area.5 Sen’s estimator6 was widely used for determining the magnitude of trend in hydro-meteorological time series.7 In this method, the slopes (Ti) of all data pairs are first calculated by.
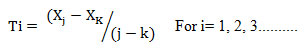
where Xj and Xk are data values at time j and k (j>k) respectively. The median of these N values of Tiis Sen’s estimator of slope, which is calculated as
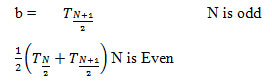
A positive value of b indicates an upward (increasing) trend and a negative value indicates a downward (decreasing) trend in the time series.
To ascertain the presence of statistically significant trend in hydrologic climatic variables such as temperature, precipitation and stream flow with reference to climate change, nonparametric Mann-Kendall (MK) test had been employed by a number of researchers.8 The MK method searches for a trend in a time series without specifying whether the trend is linear or non-linear.
The statistics (S) is defined as
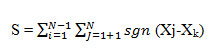
Where, N is number of data points. Assuming (Xj-Xk) = θ, the value of sign (θ)is computed as follows:
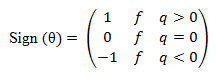
This statistics represents the number of positive differences minus the number of negative differences for all the differences considered. For large samples (N>10), the test is conducted using a normal distribution9 with the mean and the variance as follows:
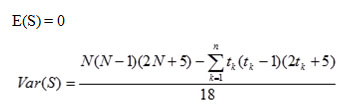
Where, n is the number of tied (zero difference between compared values) groups, and tkis the number of data points in the kth tied group. The standard normal deviate (Z-statistics)10 is then computed as
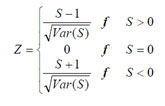
If the computed value of %Z %>zα/2, the null hypothesis (Ho) is rejected at a level of significance in a two-sided test. In this analysis, the null hypothesis was tested at 99 % and 95% of confidence level.
 |
|
Statistical Procedure for Rainfall Variability Analysis
Co efficient of variation (CV) is a statistical measure of how the individual data points vary about the mean value. A greater value of CV is the indicator of larger spatial variability, and vice versa. CV is used to classify the degree of variability of rainfall events as less, moderate and high. When CV < 20% it is less variable, CV from 20% to 30% is moderately variable, and CV > 30% is highly variable. Areas with CV > 30% are said to be vulnerable to drought.11
 |
|
Results and Discussion
Spatial and Temporal Distribution of Rainfall
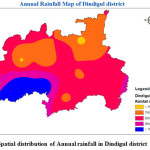
The rainfall characteristics showing mean, variance, seasonal distribution of individual station has shown in table 1. It is evident from the fig 3 and table 2, that the normal annual rainfall over the district varies from about 700 m to 1600 mm. It is minimum around Palani (709 mm) in the north western part and Vedasandur (732.4mm) in the north eastern part of the district. It gradually increases towards south and southwest and reaches a maximum around Kodaikanal (1606.8 mm).
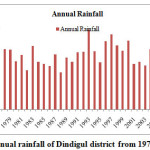
It is evident that, maximum rainfall of 1250 mm occurred during the year 1977 followed by 1993(1235.90 mm) while the year 2013 received the minimum rainfall of 408 mm (Fig. 4) and the average annual rainfall of the district for the period of 43 years from the year 1971 to 2014 is 862.86 mm.
Seasonal Distribution of Rainfall
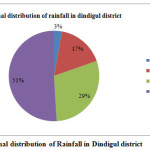
The north east monsoon contributed the maximum rainfall of 439mm (50%), followed by South-west monsoon which contributed 254 mm (29%), summer which contributed 147 mm (16.8%) and winter contributed the minimum rainfall of 26.8 mm (2.8%)(Fig.5). The highest contribution of North east rainfall was observed from Palani station (62.7%) followed by Kuthiraiyar (62.0%). The equal in proportion of seasonal distribution was observed in Kodavanari.e 39% from south west monsoon and 40.3% from North east monsoon.
Average Monthly Rainfall
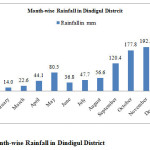
The average monthly rainfall of the district is shown in Fig.6, it was observed that the rainfall trend was increasing from January to May then it is decreasing in June month. Again it starts to increase up to November. While analysing the average monthly rainfall of the basin, November month received a maximum of 192.3 mm rainfall followed by (October 177.8 mm) and February month received a minimum rainfall of 14.6 mm.
Rainfall Variability Analysis
The percentage of CV varies from 26 (Kodaikanal) to 42.0 %( Mardanadii Dam). The average value of CV in Dindigul district is 31.9 %. According to Hare (1983), if the CV> 30%, then the rainfall is highly variable. High value of CV indicates the greater rainfall variability and more chances of occurrence of drought. There is no station falls under the category of less variability (< 0.20). From table 1, there are Seven stations falling under moderately variable and six stations come under highly variable. Highly variability was observed in the central part of the district (> 0.30).
Table 1: Classification of CV according to Hare (1983)
|
Classification of CV |
Number of stations |
|
Less variable (< 0.20) |
Nil |
|
Moderately variable(0.20 to 0.30) |
7 |
|
highly variable (> 0.30) |
6 |
Table 2: Seasonal distribution of average rainfall in different stations in Dindigul district
|
Station |
Annual |
Winter |
Summer |
South-West |
North -east |
|||||
|
Mean (mm) |
CV* |
Mean (mm) |
% of annual |
Mean (mm) |
% of annual |
Mean (mm) |
% of annual |
Mean (mm) |
% of annual |
|
|
Peranai |
887 |
0.29 |
26.3 |
3 |
141.8 |
16 |
258 |
29.1 |
461 |
52 |
|
Virupatchi |
690.7 |
0.32 |
17.2 |
2.5 |
100.2 |
14.5 |
170.2 |
24.7 |
401.5 |
58.3 |
|
Mardanadi dam |
1126.6 |
0.42 |
54.1 |
4.7 |
245.5 |
21.2 |
341 |
29.4 |
517.7 |
44.7 |
|
Kodavanar |
708.1 |
0.32 |
40.2 |
5.6 |
108 |
15.1 |
279.3 |
39 |
289.2 |
40.3 |
|
Kuthiraiyar |
905.9 |
0.39 |
20.2 |
2.3 |
120.7 |
13.6 |
195.6 |
22.1 |
548.1 |
62 |
|
Kamachipuram |
880.9 |
0.28 |
12.2 |
1.4 |
167.9 |
18.6 |
250.4 |
27.8 |
462 |
51.3 |
|
Chatrapatti |
764 |
0.35 |
17.6 |
2.3 |
108.9 |
14.3 |
187.7 |
24.6 |
447.3 |
58.7 |
|
Vedasandur |
740.3 |
0.3 |
13.4 |
1.8 |
141.6 |
19 |
210 |
28.2 |
380.7 |
51.1 |
|
Dindigul |
887.6 |
0.29 |
26.6 |
3 |
143.4 |
15.9 |
276.6 |
30.7 |
454.3 |
50.4 |
|
Nilakottai |
791.1 |
0.3 |
17.5 |
2.2 |
160.6 |
20.1 |
248.9 |
31.1 |
372.5 |
46.6 |
|
Natham |
1110.4 |
0.26 |
20.8 |
1.8 |
173.4 |
15.1 |
405.7 |
35.4 |
545.6 |
47.6 |
|
Palani |
711.4 |
0.37 |
23.9 |
3.3 |
112.6 |
15.6 |
133.5 |
18.5 |
453.4 |
62.7 |
|
Kodaikanal |
1504.1 |
0.26 |
63.3 |
4.2 |
294.7 |
19.5 |
435.6 |
28.8 |
716.6 |
47.5 |
*CV = coefficient of variation
Trend Analysis
The results of the Mann-Kendall analysis to deduct the trend in annual and seasonal rainfall for the study area have given in Table 3. The Modified Mann-Kendall (MMK) z-test (10%, 5% and 1% level of significance) applied to annual and seasonal rainfall over different stations.
Table 3: Mann Kendall’s Test and Percent change in magnitude of rainfall in Dindigul district using Sen's slope
|
S.No |
Station |
Annual |
Winter |
Summer |
South west |
North east |
|||||
|
Z |
S |
Z |
S |
Z |
S |
Z |
S |
Z |
S |
||
|
1 |
Peranai |
NS |
0.29 |
NS |
-0.12 |
NS |
1.24 |
NS |
-1.48 |
NS |
0.52 |
|
2 |
Kuthiraiyar |
S |
-3.05 |
NS |
0 |
NS |
-1.45 |
S |
-10 |
NS |
-7.43 |
|
3 |
Kodavanar |
NS |
0.44 |
NS |
0.6 |
S |
-1.06 |
NS |
1.71 |
NS |
-3.13 |
|
4 |
Kodaikanal |
NS |
6.15 |
NS |
0 |
NS |
0.87 |
NS |
0.31 |
NS |
4.34 |
|
5 |
Natham |
NS |
10.11 |
NS |
-0.24 |
NS |
1.67 |
NS |
-0.18 |
NS |
8.8 |
|
6 |
Nilakottai |
NS |
4.07 |
S |
2.06 |
NS |
4.79 |
NS |
-9.61 |
NS |
13.54 |
|
7 |
Dindigul |
NS |
-0.11 |
NS |
0 |
NS |
0.27 |
S |
-2.57 |
NS |
2.3 |
|
8 |
Chatrapatti |
NS |
-4.73 |
NS |
0 |
NS |
0 |
NS |
-1.83 |
NS |
-0.07 |
|
9 |
Virupatchi |
NS |
-12.54 |
NS |
0 |
NS |
-0.81 |
NS |
-5.12 |
NS |
-0.13 |
|
10 |
Kamachi puram |
NS |
0.29 |
S |
0.13 |
NS |
5.07 |
NS |
-5.59 |
NS |
5.79 |
|
11 |
Vedasandur |
NS |
-0.75 |
NS |
0 |
NS |
-0.98 |
NS |
-0.58 |
NS |
0.63 |
|
12 |
Palani |
NS |
2.4 |
NS |
0 |
S |
-1.38 |
S |
-1.65 |
NS |
4.17 |
|
13 |
Mardanadi dam |
NS |
-178.9 |
NS |
-1.5 |
NS |
-9.6 |
S |
-72.4 |
NS |
-112 |
Z - Mann Kendall’s Z test
S - Sen’s Estimator
The magnitude of the trend in annual and seasonal rainfall has been determined using the Sen’s estimator is given in Table 3.As evident from table 3 that results were non-significant in majority of stations.Significant decreasing trend was observed during annual, South- west monsoon seasons in Kuthiraiyar station.The increase in annual rainfall varied between 10.11 mm/year (for Natham) to 0.29 mm/year (for Peranai and Kamachipuram) non significantly.
The results of MMK z-test at 1% level are shown in Table 2 indicates that the majority of stations show a non-significant trend in annual, pre-monsoon and monsoon seasons. Out of the 13 stations studied, annual rainfall of only one station (Kuthiraiyar) showed significant decreasing trend.In the monsoon season (South west and North east), the maximum decrease is of the order of -72.4 mm/year for Mardanadi dam(data available from 1999 onwards) and minimum decrease is for Palani station (-1.65 mm/year).The increasing trend in winter season rainfall is found to vary from 0.13 mm/year (Kamachipuram) to 2.06 mm/year (Nilakottai).
Trend of Rainy Days
The average of rainy days in the district is 47. In which Kodaikanal receives the highest number of rainy days (85.7) followed by Natham (56), Dindigul (51) and Chatrapatti (35.7) followed by Kodavanar (36) along with Virupatchi (37).
Table 4: Station wise rainy days in Dindigul district
|
Station |
Annual |
Winter |
Summer |
Southwest |
Northeast |
|
Chatrapatti |
35.8 |
4.2 |
8.1 |
12.3 |
21.3 |
|
Dindigul |
51.3 |
1.5 |
8.4 |
17.6 |
23.7 |
|
Kamachipuram |
48.4 |
3.1 |
10.3 |
16.9 |
24.2 |
|
Kodaikanal |
85.7 |
3.3 |
17.6 |
33.8 |
31 |
|
Kodavanar |
37 |
0.6 |
7.8 |
9.5 |
19.1 |
|
Kuthiraiyar |
40.3 |
1.4 |
6.5 |
11.7 |
20.7 |
|
Mardanadi dam |
49.9 |
1.8 |
10.9 |
17.8 |
19.4 |
|
Natham |
56.4 |
1.9 |
8.9 |
21.5 |
24.1 |
|
Nilakottai |
44.5 |
1.4 |
9.6 |
13.6 |
19.9 |
|
Palani |
39.6 |
1.2 |
7.3 |
10.1 |
21 |
|
Peranai |
46.5 |
1.4 |
8.7 |
14.2 |
22.1 |
|
Vedasandur |
41.1 |
0.8 |
7.4 |
11.5 |
21.4 |
|
Virupatchi |
37.1 |
14.9 |
6 |
9.7 |
18.6 |
During south west monsoon 15 rainy days were recorded and during north east monsoon 22 rainy days were recorded. North east monsoon recorded more numbers of rainy days compared to southwest monsoon. The station Kodaikanal, Mardanadi dam and Natham recorded almost equal numbers of rainy days in both the monsoons. The results indicate that more number of rainy days were observed during October (10.17) followed by November (8.45) and September month (6.59).
Table 5: Mann Kendall’s Test and Significance in Rainy days of Dindigul District
|
Station |
Annual |
Winter |
Summer |
South-west |
Northeast |
|||||
|
Test Z |
S |
Test Z |
S |
Test Z |
S |
Test Z |
S |
Test Z |
S |
|
|
Chatrapatti |
0.95 |
NS |
0 |
NS |
1.49 |
NS |
-1.9 |
S |
1.95 |
S |
|
Dindigul |
0.18 |
NS |
-0.22 |
NS |
0.74 |
NS |
-0.64 |
NS |
0.61 |
NS |
|
Kamachipuram |
-0.42 |
NS |
1.21 |
NS |
0.88 |
NS |
-1.22 |
NS |
0.02 |
NS |
|
Kodavanar |
0.16 |
NS |
0.31 |
NS |
-0.05 |
NS |
0.3 |
NS |
-0.55 |
NS |
|
Kodaikanal |
-0.27 |
NS |
1.13 |
NS |
0.17 |
NS |
-1.82 |
S |
0.7 |
NS |
|
Kuthiraiyar |
-1.89 |
S |
-0.13 |
NS |
0 |
NS |
-1.47 |
NS |
-0.25 |
NS |
|
Mardanadi dam |
0.68 |
NS |
0.28 |
NS |
-0.14 |
NS |
0.5 |
NS |
0.72 |
NS |
|
Natham |
1.15 |
NS |
0 |
NS |
0.48 |
NS |
0.4 |
NS |
1.67 |
S |
|
Nilakottai |
0.21 |
NS |
0.14 |
NS |
0.51 |
NS |
-1.74 |
S |
1.26 |
NS |
|
Palani |
-0.72 |
NS |
0.29 |
NS |
-2.49 |
S |
-2.03 |
S |
0.64 |
NS |
|
Peranai |
0.04 |
NS |
-0.48 |
NS |
2.69 |
S |
-1.3 |
NS |
-0.06 |
NS |
|
Vedasandur |
-0.79 |
NS |
-1 |
NS |
0.17 |
NS |
-1.06 |
NS |
0.04 |
NS |
|
Virupatchi |
-2.08 |
S |
1.76 |
S |
-2.4 |
S |
-1.84 |
S |
-2.24 |
S |
Z - Mann Kendall’s Z test
S - Significance
Kodavanar and Virupatchi stations recorded the significant decreasing trend of annual rainy days. Virupatchi is the only station which shows the significant decreasing trend in all seasons except winter season (increasing trend).The highest annual rainy days were recorded in Kodaikanal station located in the hilly area called as princess of hills receives high amount of rainfall and allocate major amount of runoff to catchment in the Dindigul district. A non significant decreasing trend of rainfall in all seasons was observed. However, in rainy days, significant decreasing trend was observed during south west monsoon at 90% level of significance. In Palani, the significant decrease of rainy days has observed during southwest monsoon and summer.
Out of thirteen stations in the districts, five stations recorded the significant decreasing trend in rainy days during southwest monsoon. Chatrapatti and Natham stations recorded the significant increasing trend during north east monsoon and Virupatchi recorded the decreasing trend.
Conclusion
The trend detection analysis of rainfall for thirteen stations of Dindigul has indicated a decreasing rainfall trends in annual, monsoons, and winter seasons. The MKK test indicates that the significant rainfall trend has observed only in annual, monsoon and pre-monsoon seasons at 1% level of significance. The increase in annual rainfall varied between 10.11 mm/year (for Natham) to 0.29 mm/year (for Peranai and Kamachipuram) non-significantly. Significant decreasing trend was observed during annual (-3.05 mm/year), South- west (-10 mm/year) monsoon seasons in Kuthiraiyar station. The number of rainy days shows the decreasing trend in Chatrapatti (-1.9) and Virupatchi (-1.74) stations, during southwest monsoon.In Palani, the significant decrease of rainfall during south -west monsoon (-1.65 mm/day) and non-significant increase in annual rainfall (2.4 mm/day) has observed but significant decrease of rainy days observed during southwest monsoon (-2.03) and summer (-2.49). The variability of rainfall also high in the district (> 30 percentage) which indicates the non-significant trend from 1971 to 2014 and the climate change may influence the variability of rainfall. This leads to higher the groundwater exploitation and there may be the chance of flood and drought occurrence in the district. Since dry farming is predominant in the district, the decrease in rainy days during monsoon and variability of rainfall affects the agricultural practice, which results in failure of crops.
Acknowledgement
Authors thank Directorate of Water Management, ICAR, Bhubaneswar for the financial support under NICRA project.
Reference
- Krishnakumar, K.N., Prasada Rao, Gopakumar, C.S. Rainfall trends in twentieth century over Kerala, India. Atmos Environ, 43:1940–1944. (2008)
CrossRef - Chakraborty,S. Trend and variability analysis of rainfall series at Seonath River Basin, Chhattisgarh,India. Int J ApplSci Eng Res, 2(4):425–434.(2013)
- Sen, P.K. Estimates of the regression coefficient based on Kendall’s tau. Journal of the American Statistical Association, 63: 1379-1389 (1968)
CrossRef - Gajbhiye, Sarita, Meshram, Chandrashekhar, Mirabbasi, Rasoul& Sharma, S. K. Trend analysis of rainfall time series for Sindh river basin in India. Theoretical and Applied Climatology, (2015), DOI 10.1007/s00704-015-1529-4
CrossRef - S., Balasubramani,K. and Kumaraswamy,K. Spatio-temporal Analysis of Rainfall Distribution and Variability in the Twentieth Century, Over the Cauvery Basin, South India, Environmental Management of River Basin Ecosystems, Springer Earth System Sciences, (2015), DOI 10.1007/978-3-319-13425-3_2
- Partal, T. &Kahya, E. Trend analysis in Turkish precipitation data. Hydrological Processes, 20:2011–2026 (2006)
CrossRef - Kumar, V., Jain, S.K., & Singh, Y. Analysis of long-term rainfall trends in India.Hydrological Sciences Journal, 55: 484-496 (2010)
CrossRef - Singh, P., Kumar, V., Thomas, T. & Arora, M. Changes in rainfall and relative humidity in different river basins in the northwest and central India.Hydrological Processes,22: 2982-2992 (2008)
CrossRef - Helsel, D.R.,& Hirsch, R.M. Statistical Methods in Water Resources. Elsevier, New York (1992).
- Hirsch,R.M.,Helsel,D.R.,Cohn,T.A.& Gilroy,E.J. Statistical treatment of hydrological data. In handbook of hydrology.Maidment D.R(ed). McGraw-Hill,NewYork;17.1-17.52 (1993).
- Hare, F.K., Climate and Desertification.Revised analysis (WMO-UNDP) WCP-. Geneva, Switzerland, 44: 5-20 (1983).


